TheStrat TFC Monitor
- Indicatori
-
Robert Gerald Wood
 Sviluppatore di software professionista da oltre 25 anni, ora costruisce strumenti per me stesso e li condivide con la comunità più ampia.
 - Versione: 1.5
- Aggiornato: 23 novembre 2023
- Attivazioni: 10
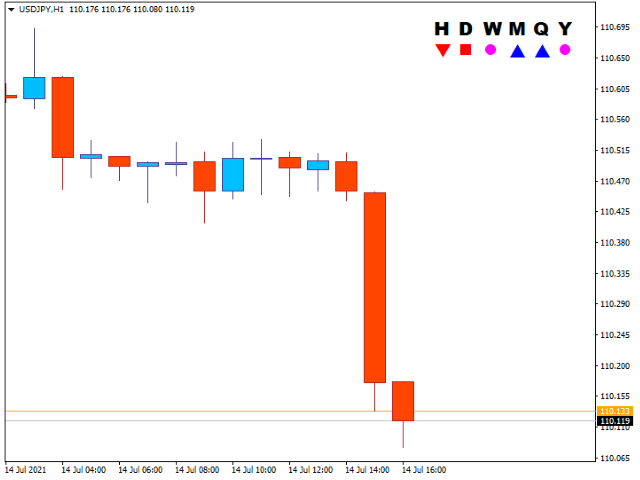
Quando fai trading usando The Strat , è importante tenere d'occhio più tempi.
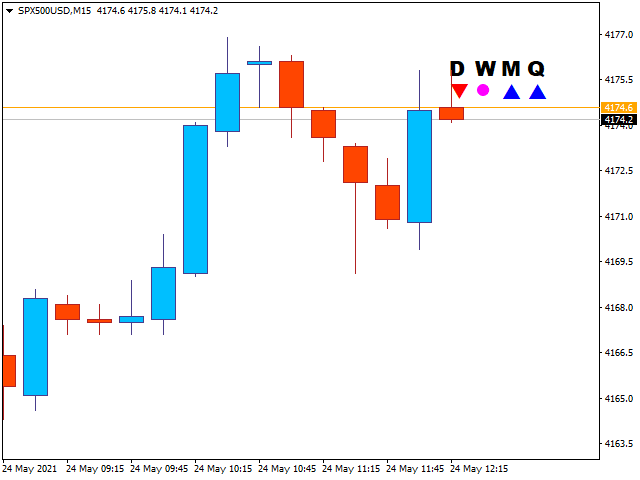
Questo indicatore mostrerà lo stato giornaliero, settimanale, mensile e trimestrale della candela corrente per ogni periodo di tempo.
- Un'icona a forma di cerchio mostra che la candela in quel lasso di tempo è attualmente una Inside o Type 1 nella terminologia di TheStrat. Una candela Inside Day sta consolidando l'azione dei prezzi e stiamo cercando un breakout dall'intervallo.
- Un'icona a triangolo, rivolta verso l'alto o verso il basso, è una candela di tendenza, o Tipo 2 nella terminologia di TheStrat. Una candela di tendenza può essere rialzista o ribassista, a indicare che ha superato l'intervallo delle candele precedenti e ora tende in una direzione.
- Un'icona quadrata è una candela esterna, o Tipo 3 nella terminologia di The Stratocaster. Ciò indica due cose, una che il prezzo è indeciso sulla direzione in quel lasso di tempo, e probabilmente piuttosto instabile, e due, che in tempi più bassi ci sono probabilmente buone opportunità per negoziare inversioni brevi. Il quadrato sarà di colore rialzista o ribassista per mostrare quale parte sta attualmente vincendo.
I colori utilizzati per ciascuna icona possono essere configurati secondo i propri gusti e anche la dimensione del testo e delle icone è configurabile.
IMPOSTAZIONI
Selezioni del periodo di tempo
Mostra ogni ora
Quando True, mostra lo stato della candela oraria.
MostraGiornaliero
Quando True, mostra lo stato giornaliero della candela.
Mostra settimanalmente
Quando True, mostra lo stato della candela settimanale.
MostraMensile
Quando True, mostra lo stato della candela mensile.
Mostra trimestrale
Quando True, mostra lo stato della candela trimestrale.
MostraAnnuale
Quando True, mostra lo stato annuale della candela.
Visualizza la formattazione
InsideFontColour
Il colore da utilizzare quando si disegna all'interno delle candele (Tipo 1).
BullishFontColor
Il colore da utilizzare quando si disegnano candele di tendenza rialzista (Tipo 2) o Outside (Tipo 3).
BearishFontColour
Il colore da utilizzare quando si disegnano candele di tendenza rialzista (Tipo 2) o Outside (Tipo 3).
HeaderFontName
Il carattere da utilizzare per le intestazioni delle icone di stato della candela.
Dimensione del font
La dimensione del carattere da utilizzare per le intestazioni. Questo controlla anche la dimensione complessiva del display dell'indicatore.