TheStrat TFC Monitor
- Göstergeler
- Sürüm: 1.5
- Güncellendi: 23 Kasım 2023
- Etkinleştirmeler: 10

The Strat kullanarak işlem yaparken, birden çok zaman dilimine göz kulak olmak önemlidir.
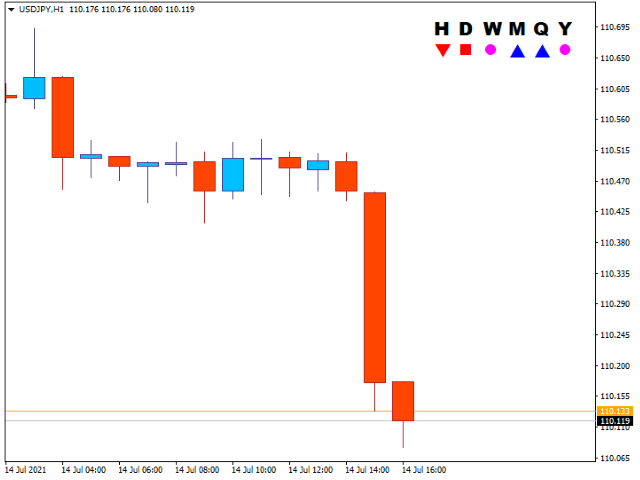
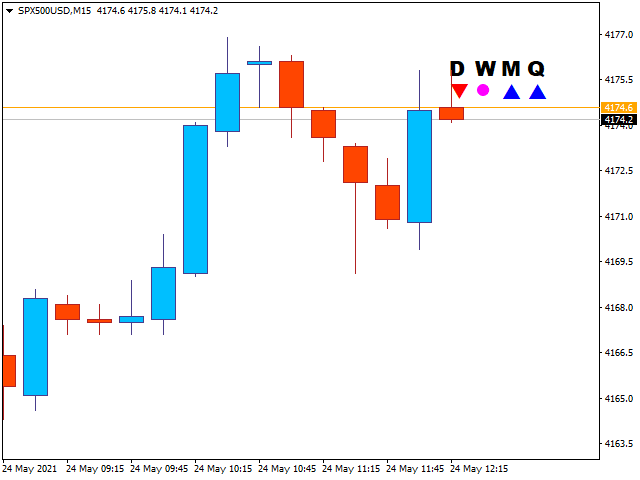
Bu gösterge, her zaman dilimi için mevcut mumun Günlük, Haftalık, Aylık ve Üç Aylık durumunu gösterecektir.
- Daire simgesi, o zaman dilimindeki mumun şu anda TheStrat terminolojisinde bir Inside veya Type 1 olduğunu gösterir. Bir Inside Day mumu, fiyat hareketini pekiştiriyor ve biz, aralığın kırılmasını arıyoruz.
- Yukarıyı veya aşağıyı gösteren bir Üçgen simgesi, trend olan bir mum veya TheStrat terminolojisinde Tip 2'dir. Trend Olan bir mum, Boğa veya Ayı olabilir, bu da önceki mum aralığının dışına çıktığını ve şu anda tek yönde eğilim gösterdiğini gösterir.
- Kare simgesi, Dış mum veya Strat terminolojisinde Tip 3'tür. Bu iki şeye işaret eder, biri fiyatın o zaman diliminde yön konusunda kararsız olması ve muhtemelen oldukça dalgalı olması ve ikincisi, daha düşük zaman dilimlerinde kısa geri dönüşler ticareti için muhtemelen iyi fırsatlar olmasıdır. Kare, şu anda hangi tarafın kazandığını göstermek için Boğa veya Ayı rengi olacaktır.
Her simge için kullanılan renkler zevkinize göre yapılandırılabilir ve metin ve simgelerin boyutu da yapılandırılabilir.
AYARLAR
Zaman Çerçevesi Seçimleri
ShowSaatlik
Doğru olduğunda, saatlik mum durumunu gösterir.
Günlük göster
Doğru olduğunda, günlük mum durumunu gösterir.
Haftalık göster
Doğru olduğunda, haftalık mum durumunu gösterir.
Aylık Göster
Doğru olduğunda, aylık mum durumunu gösterir.
Üç ayda bir göster
Doğru olduğunda, üç aylık mum durumunu gösterir.
Yıllık göster
Doğru olduğunda, yıllık mum durumunu gösterir.
Biçimlendirmeyi Görüntüle
Yazı Tipi Rengi
(Tip 1) mumların içini çizerken kullanılacak renk.
Boğa Yazı Tipi Rengi
Yükseliş eğilimi gösteren (Tip 2) veya Dış (Tip 3) mumları çizerken kullanılacak renk.
Ayı Yazı Tipi Rengi
Yükseliş eğilimi gösteren (Tip 2) veya Dış (Tip 3) mumları çizerken kullanılacak renk.
BaşlıkYazı TipiAdı
Mum durumu simgelerine Başlıklar için kullanılacak Yazı Tipi.
Yazı Boyutu
Başlıklar için kullanılacak yazı tipinin boyutu. Bu aynı zamanda gösterge ekranının genel boyutunu da kontrol eder.