SORS Osw
- Indicatori
-
William Oswaldo Mayorga Urduy
 MQL4 and MQL5 trader and developer since February 2019, delivering projects in under one day and providing post-delivery technical support.
Optimized code, advanced logic, and high-quality code. - Versione: 2.7
- Aggiornato: 28 luglio 2024
- Attivazioni: 5
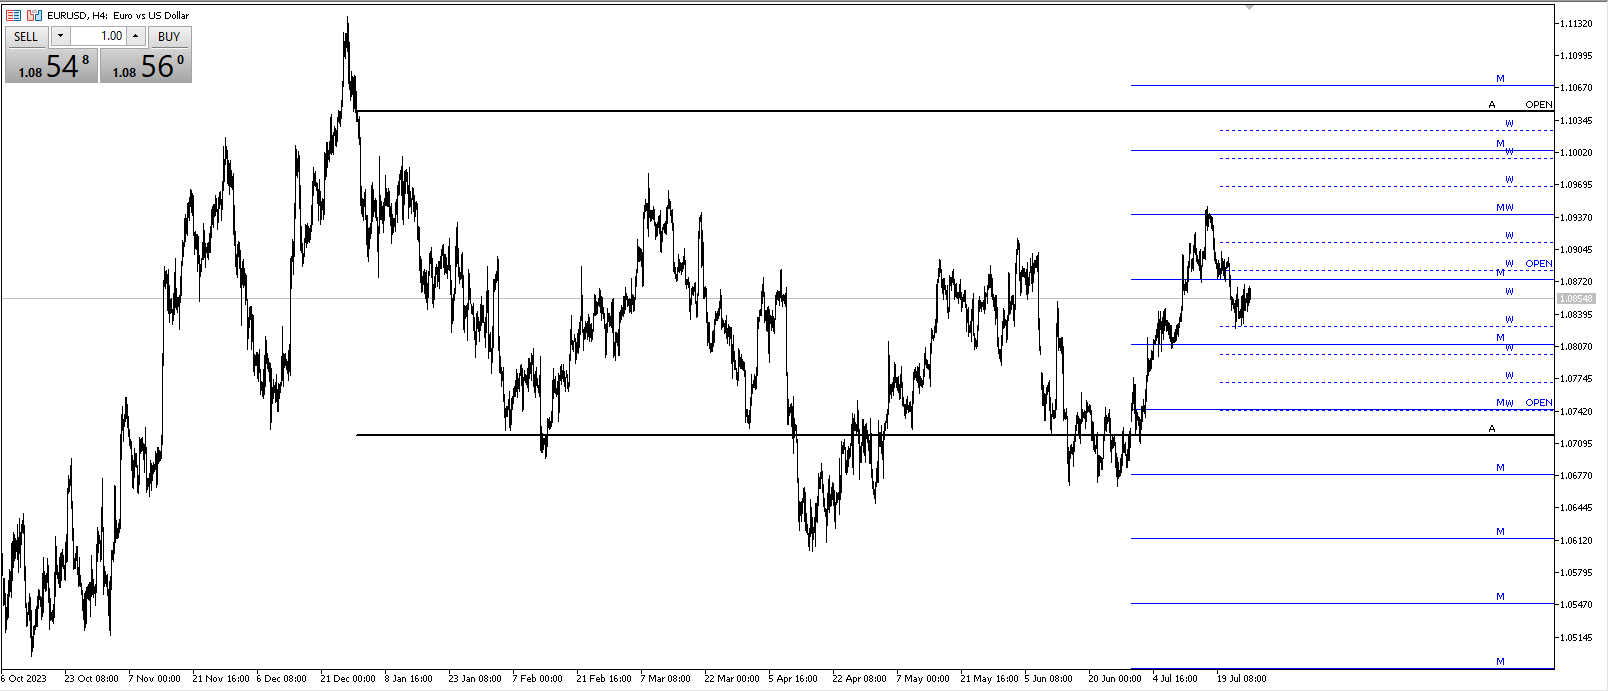
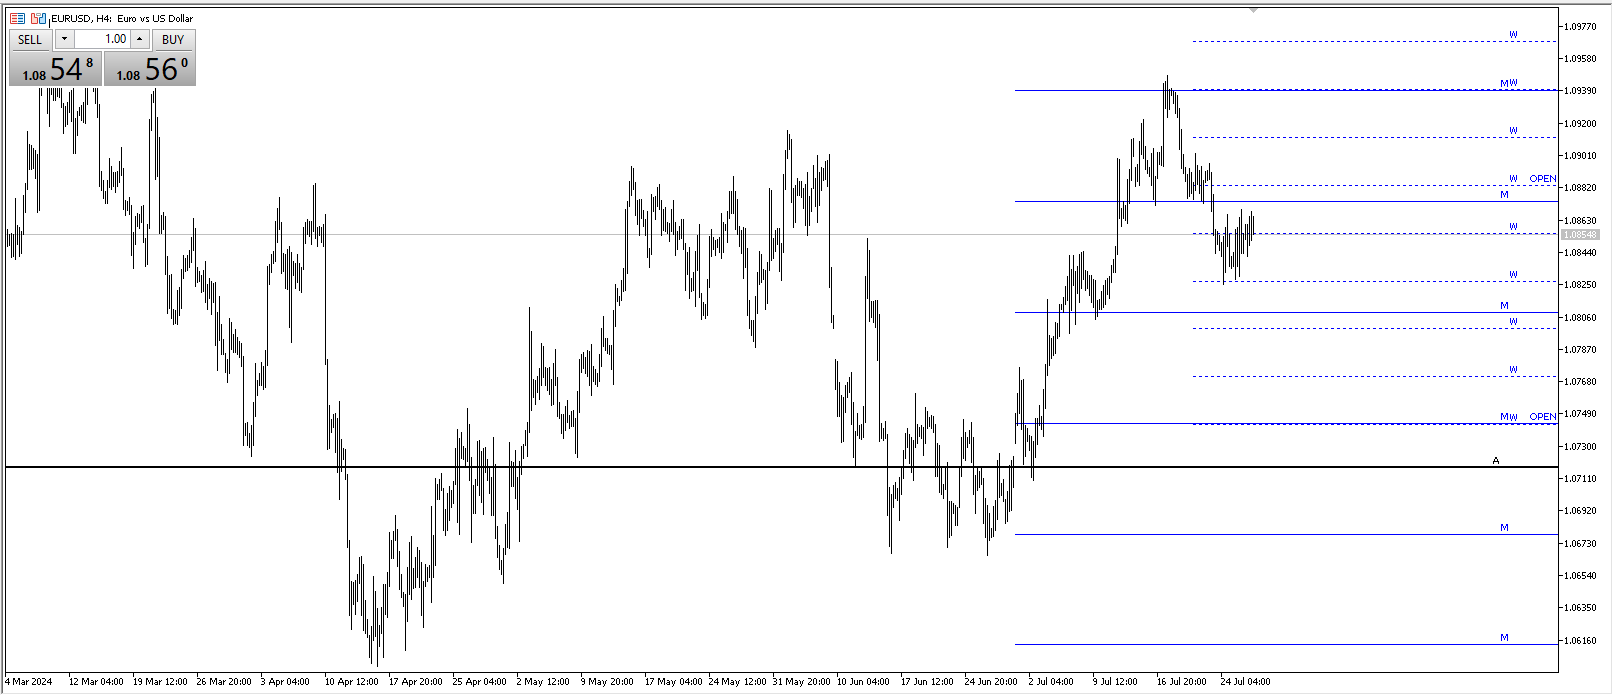
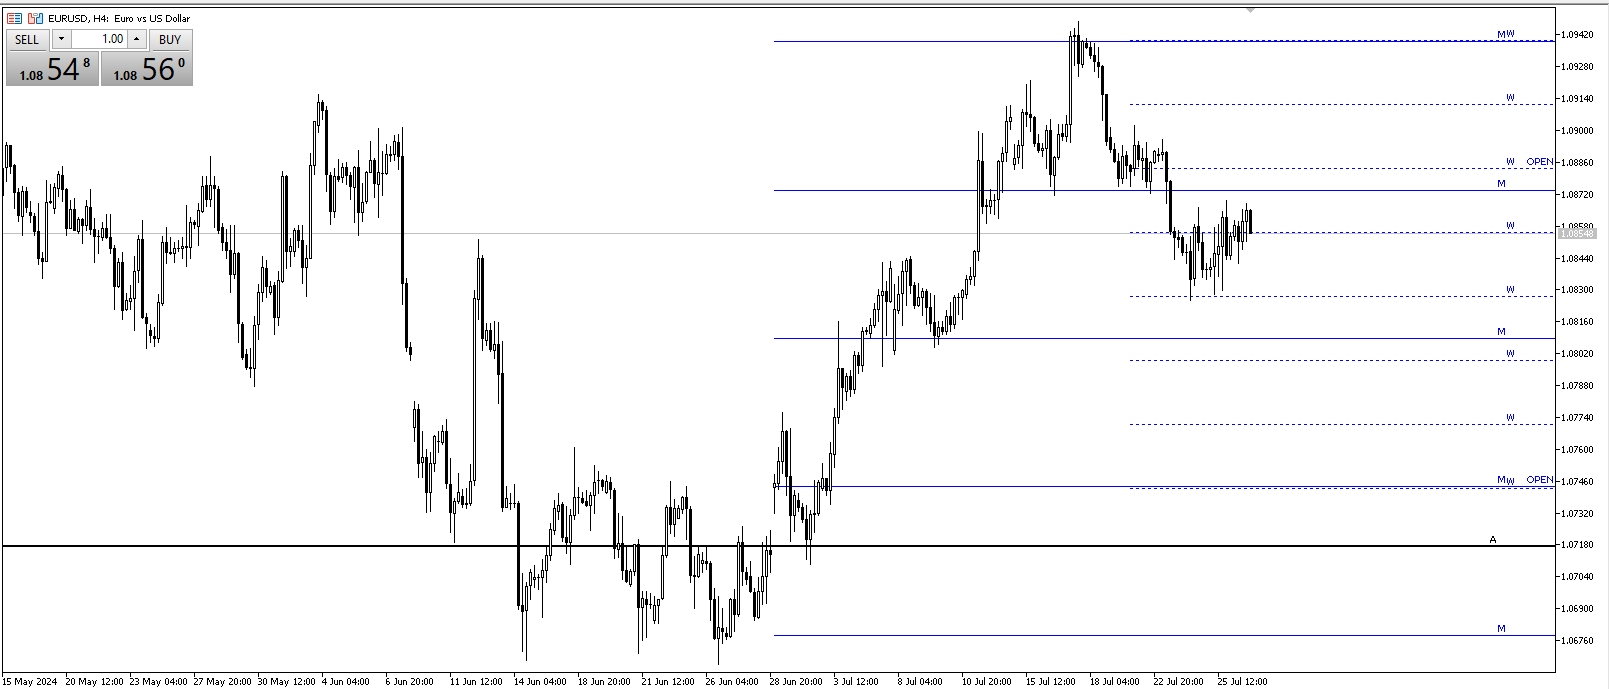
Manuale utente: Sistema di livelli dinamici SORS
L'indicatore SORS è uno strumento ad alta precisione progettato per proiettare i livelli chiave di supporto e resistenza in tempo reale. Utilizza la deviazione standard (volatilità endogena) per calcolare gli intervalli di espansione in base al prezzo di apertura dei cicli temporali critici. Il suo obiettivo è identificare aree di esaurimento o accelerazione, consentendo al trader di operare con una tabella di marcia matematica.
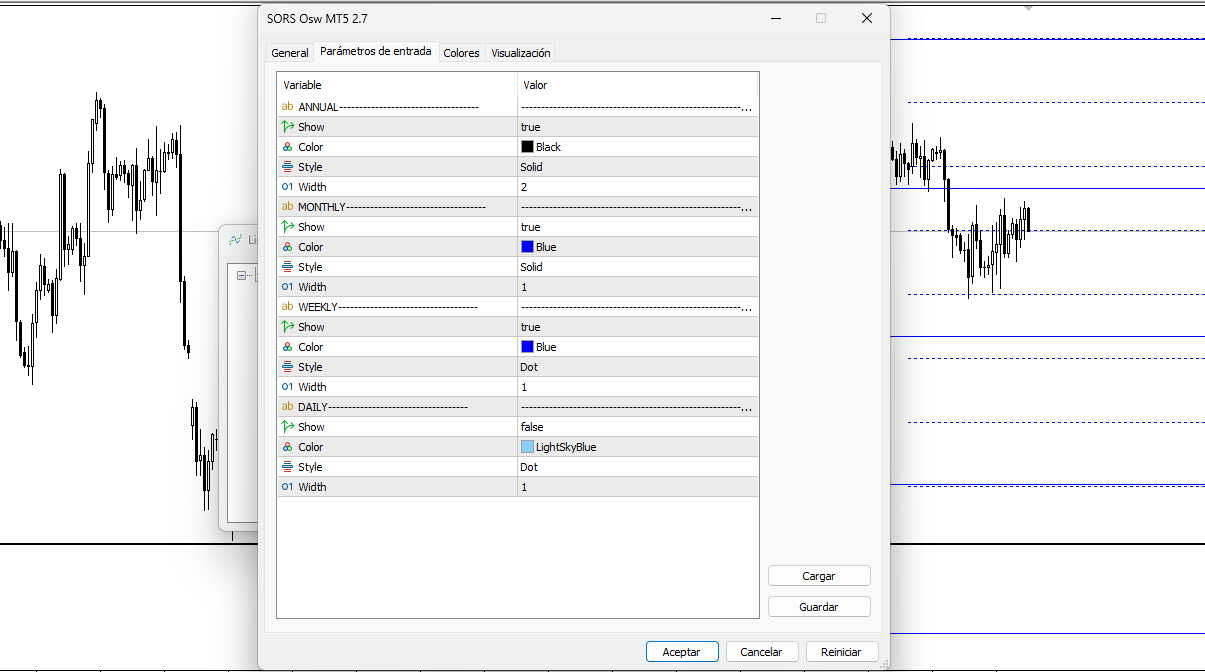
Guida ai parametri (menu di inserimento)
Il menu consente di personalizzare la visibilità e l'aspetto di ogni ciclo di trading:
Impostazione annuale (ANNUAL): controlla i livelli in base al prezzo di apertura dell'anno. Ideale per identificare bias macroeconomici a lungo termine.
Impostazione mensile (MONTHLY): proietta gli intervalli a partire dal primo giorno del mese. Questa è la base per il trading di posizione.
Impostazione settimanale (WEEKLY): definisce i livelli a partire dal prezzo di apertura di lunedì. Fondamentale per l'intraday e lo swing trading.
Impostazioni giornaliere: mostra la volatilità della sessione corrente (disattivata di default per maggiore chiarezza visiva).
Per ogni ciclo, l'utente può regolare:
Mostra: Abilita/Disabilita il livello.
Colore/Stile/Larghezza: Personalizza il tono, il tipo di linea e lo spessore per differenziare le gerarchie temporali.
Interpretazione visiva e operativa
Quando SORS è installato, verranno visualizzati i livelli orizzontali proiettati dall'inizio di ogni periodo:
Livello di APERTURA: Questo è il prezzo di equilibrio per il periodo. Se il prezzo si muove al di sopra di esso, il bias è rialzista; al di sotto, è ribassista.
Livelli di Espansione: Si tratta di zone di ipercomprato (sopra) e ipervenduto (sotto) calcolate in base alla volatilità.
Zone di Inversione: I livelli estremi (livelli da 3 a 5) agiscono tipicamente come barriere dove il prezzo tende a correggere verso il livello di APERTURA.
Zone di Continuazione: Una solida rottura dai livelli 1 o 2 indica un forte trend verso il range successivo.
Raccomandazioni d'uso
Confluenza: il segnale più forte si verifica quando un livello settimanale coincide con un livello mensile o annuale. Queste zone di "doppia barriera" offrono ingressi ad alta probabilità.
Asset: ottimizzato per Forex (coppie principali), oro (XAUUSD) e indici.
Intervalli temporali: esegui l'analisi sul grafico H4 per avere una visione d'insieme ed esegui operazioni sul grafico M15 o H1 utilizzando i livelli come obiettivi di take-profit o zone di ingresso.