Sar Manager MT4
- Indicators
-
Andrei Strashko
 About Us
We are professional traders and experienced developers of Expert Advisors (EAs), trading indicators, and trading utilities for MetaTrader 4 and MetaTrader 5. - Version: 1.1
SAR Manager
SAR Manager is a signal indicator for MetaTrader 4 based on the standard Parabolic SAR algorithm. The indicator detects changes in SAR direction, generates virtual BUY and SELL signals, calculates Stop Loss and Take Profit levels, and displays all related information directly on the chart.
The product is intended for market analysis and manual trade support. It does not open, modify, or close real trading orders.
Signal Calculation
A BUY signal is confirmed when the Parabolic SAR points move from above the price to below it. A SELL signal is confirmed when the SAR points move from below the price to above it.
A new signal is calculated only after the candle has closed. The current forming candle is not used to confirm an entry. The virtual entry price is determined by the opening price of the next candle after the change in SAR direction has been confirmed.
The indicator tracks one virtual position at a time. While the position remains active, new entries are not generated. The position is closed when Stop Loss or Take Profit is reached, an opposite Parabolic SAR signal appears, or a price gap crosses one of the specified levels.
Stop Loss and Take Profit
Stop Loss and Take Profit distances are specified in MetaTrader points. For a BUY signal, Stop Loss is placed below the virtual entry price and Take Profit is placed above it. The opposite placement is used for a SELL signal.
Values are specified in points rather than pips. The actual price distance depends on the point size of the selected trading instrument.
During historical calculations, Stop Loss and Take Profit may both be located within the range of the same candle. Candle data does not show which level was reached first. The Same Bar Policy parameter is provided to process this situation. The user can select Stop Loss First or Take Profit First. Stop Loss First is used by default.
Chart Display
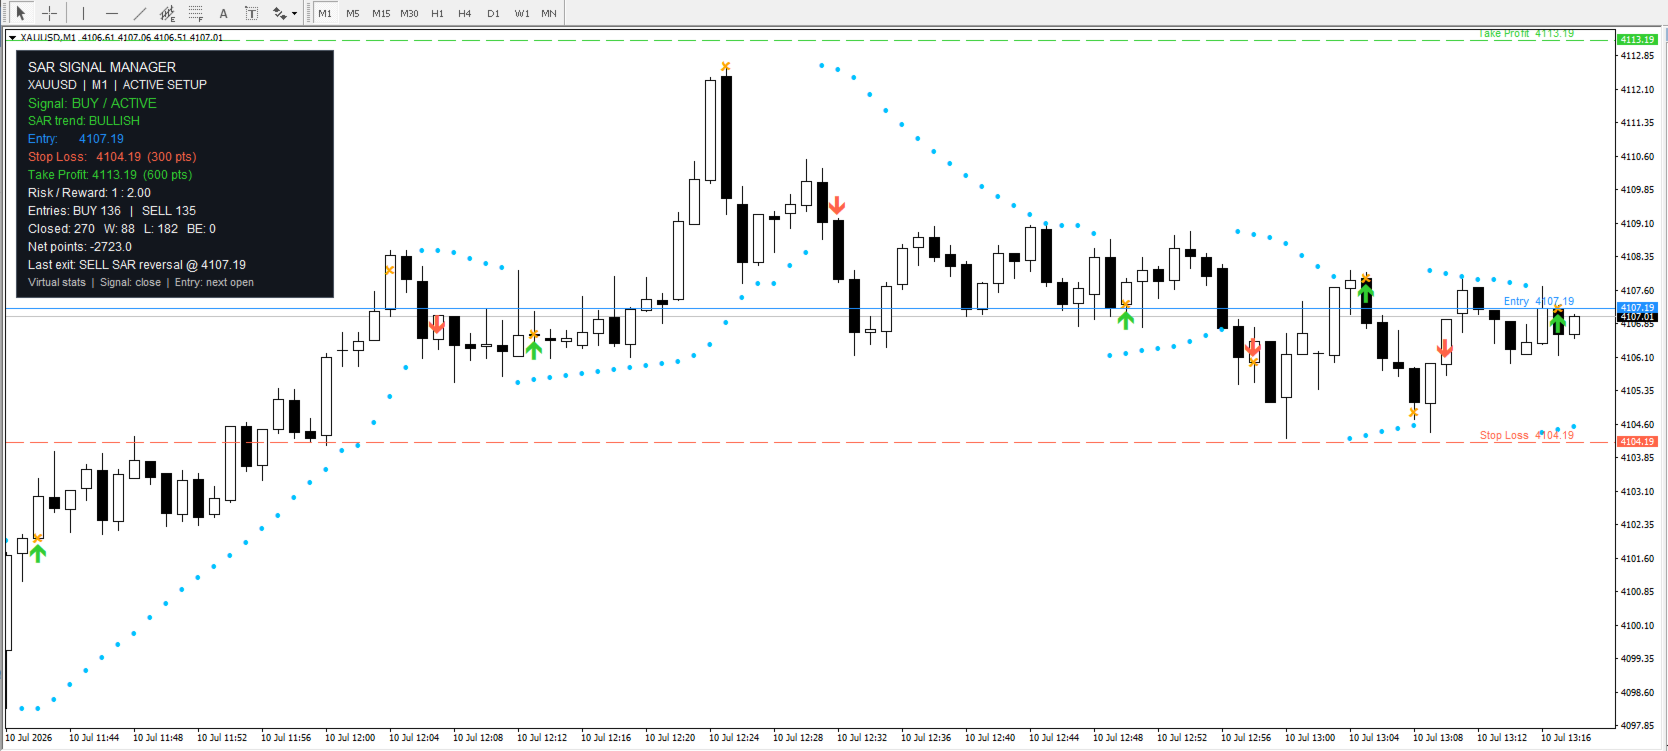
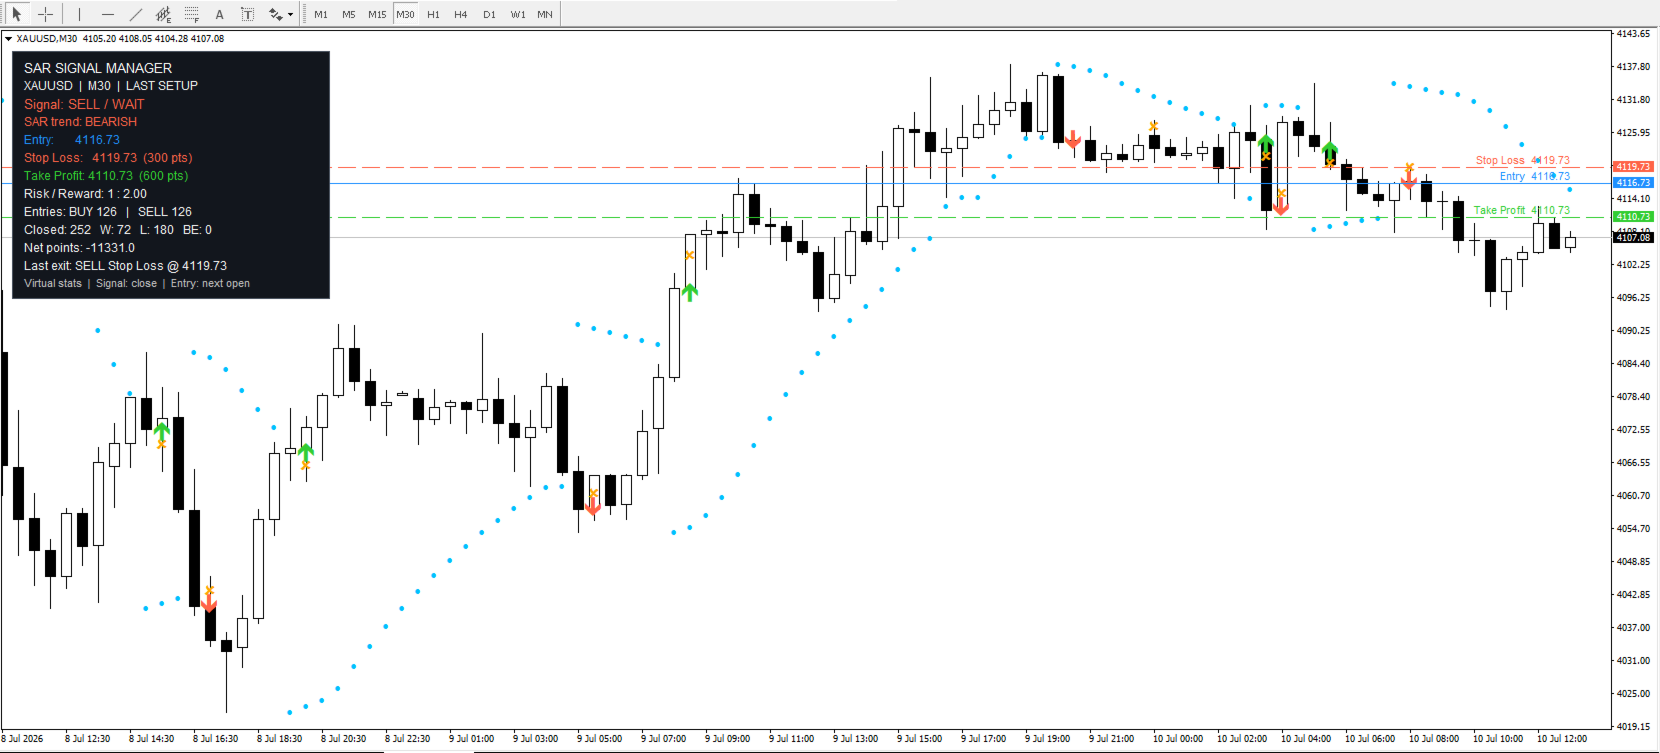
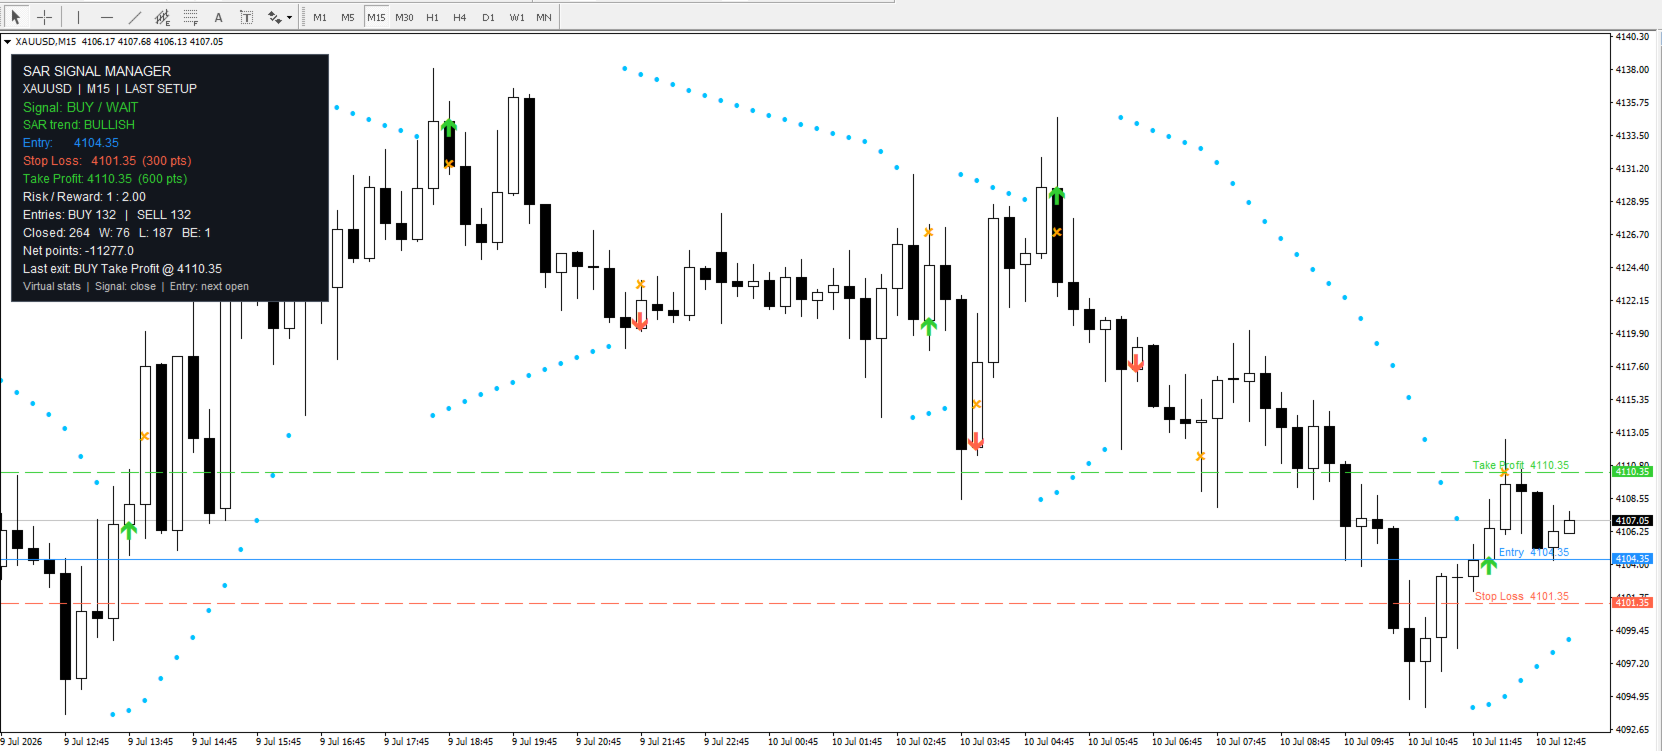
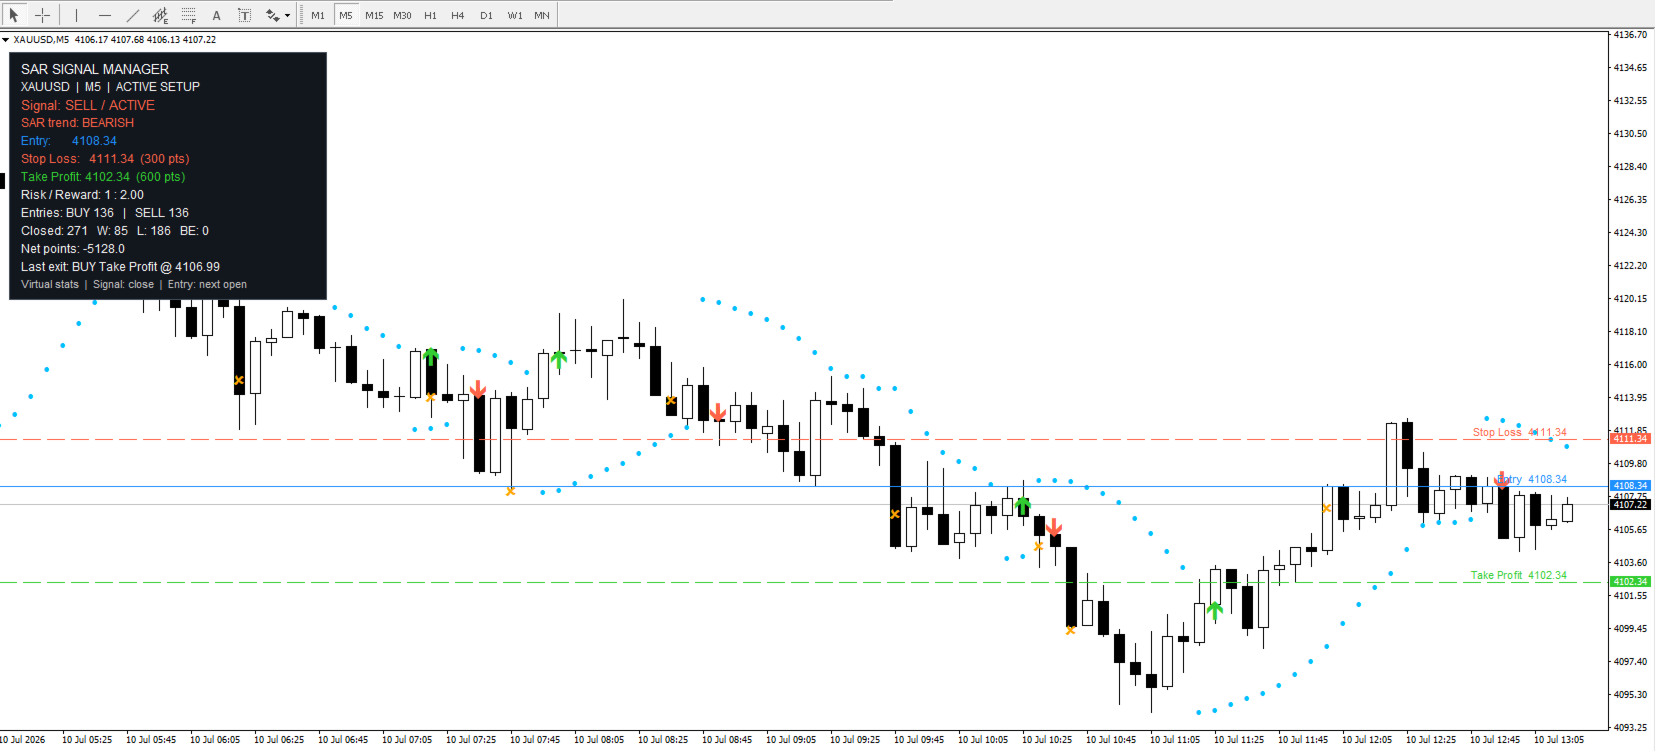
SAR Manager displays Parabolic SAR points, virtual BUY and SELL entry arrows, position exit markers, and horizontal Entry, Stop Loss, and Take Profit lines. Level names and corresponding prices can also be displayed on the chart.
The lines are automatically displayed for an active virtual position. After the position is closed, the latest levels can be retained or removed according to the selected settings. The colors of signals, lines, text, and other chart elements can be adjusted.
The number of historical candles processed by the indicator is specified in the input parameters. Increasing the history depth displays more previous signals but may require additional calculation time.
Information Panel
The indicator places an information panel on the chart. It displays the current symbol and timeframe, active signal, virtual position status, and current Parabolic SAR direction.
For an active signal, the panel shows the Entry price, Stop Loss, Take Profit, and the calculated risk-to-reward ratio. The statistical section displays the number of virtual BUY and SELL entries, positive, negative, and breakeven closes, the total virtual result in points, and information about the latest exit.
Statistics are calculated only from the history loaded and processed by the indicator. The values displayed on the panel may change when the number of historical candles is modified.
Notifications
The indicator can send notifications when a new virtual entry appears or when a virtual position is closed. Entry and exit notifications can be enabled separately.
Supported notification methods include standard MetaTrader pop-up alerts, mobile push notifications, email messages, and sound alerts. Push and email functions must be configured in the trading terminal before they can be used.
When the indicator is first attached to a chart, it does not send notifications for previous historical signals. Each new entry or exit is processed once to prevent repeated notifications for the same event.
Input Parameters
The indicator settings are divided into logical groups. Separate groups are provided for Parabolic SAR parameters, virtual Stop Loss and Take Profit distances, historical calculation depth, and the processing order of levels within the same historical candle.
Additional groups contain notification settings, line and marker display options, retention of the latest levels, and the colors of the panel and chart objects. The parameters can be changed in the indicator properties before launch or during operation.
Using the Indicator
Attach SAR Manager to the required chart and configure the Parabolic SAR parameters. Then specify the Stop Loss and Take Profit distances in points, select the history depth, and adjust the chart display settings.
After a new signal is confirmed, the indicator displays its direction, virtual Entry price, and calculated levels. The subsequent position status, exit reason, and updated statistics are shown on the chart and in the information panel.