Momentum MTF dashboard
- Indicators
-
Makarii Gubaydullin
 Multifunctional Trade Assistant:
MT5: https://www.mql5.com/en/market/product/71145 - Version: 1.0
- Activations: 20
Multi-timeframe Momentum values on the selected Symbols: compare the current market trends
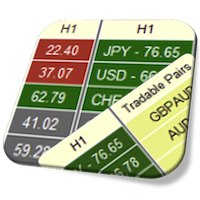
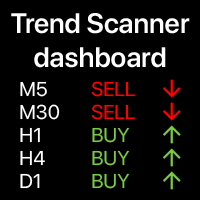
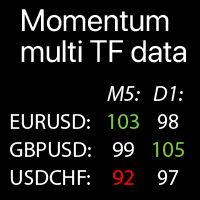
The indicator displays Momentum indicator values from all selected timeframes and Symbols in a single table, which allows you to quickly analyze current market price trends.
Each Symbol can be customized: removed / replaced. You can add up to 40 Symbols.
Panel can be moved to any place of the chart (drag anywhere).
In the settings you can configure:
- Momentum indicator settings: Period, Applied price type.
- Each timeframe may be enabled / disabled.
- Highlight option: if enabled - key levels will be highlighted in the custom colors.
- Extremes (key levels): high and low values;
- Alerts: may be enabled for Extreme levels: high Momentum / low Momentum / both.
-
Visual styles: size, dark / white theme, highlight colors.
The Momentum indicator is a popular oscillator that measures the rate of change in an asset's price over a specified period.
It helps traders identify the strength or weakness of a trend and potential reversal points.
How Momentum Works:
- Calculation: the indicator compares the current closing price to the closing price N periods ago.
- Interpretation:
- Above 100 (or zero in absolute values): Indicates upward momentum (bullish).
- Below 100 (or zero in absolute values): Indicates downward momentum (bearish).
- Divergence: If price makes a new high/low but Momentum fails to confirm, it may signal a reversal.
- Usage in Trading:
- Trend Confirmation: Rising Momentum confirms an uptrend, while falling Momentum confirms a downtrend.
- Overbought/Oversold Levels: Traders often use fixed levels (e.g., 100 as a midpoint) or dynamic thresholds to spot extremes.
- Crossing the Centerline: A move above 100 (or zero) may signal a buy, while a drop below may signal a sell.
Example Strategies:
-
Trend Following: Buy when Momentum is rising and above 100; sell when falling below 100.
-
Reversal Signals: Look for bearish/bullish divergences between price and Momentum.