Integrated Dashboard Scanner
- Indicators
- Krzysztof Janusz Stankiewic
- Version: 3.53
- Updated: 21 October 2025
- Activations: 10
Integrated Dashboard Scanner – Your Market Command Center (v3.51)
Short Description
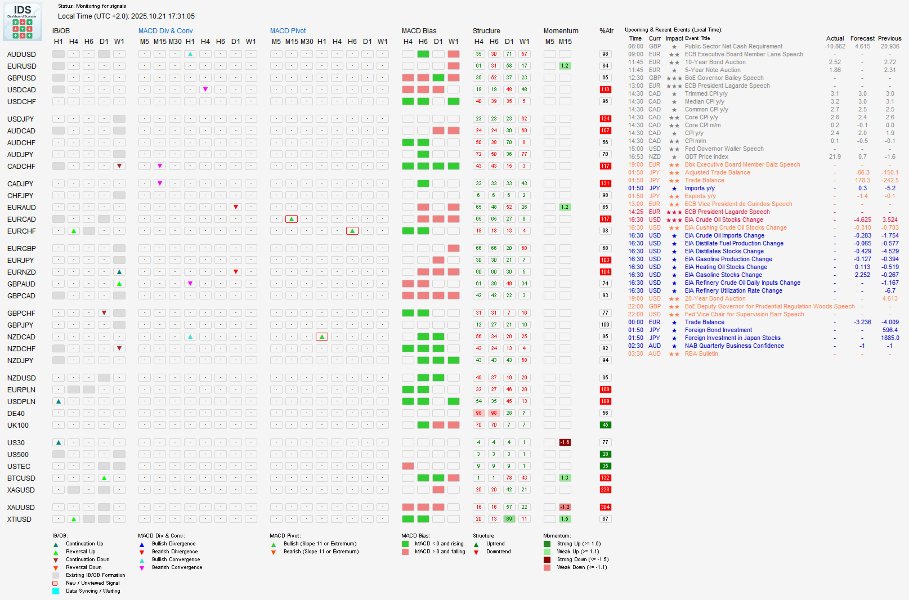
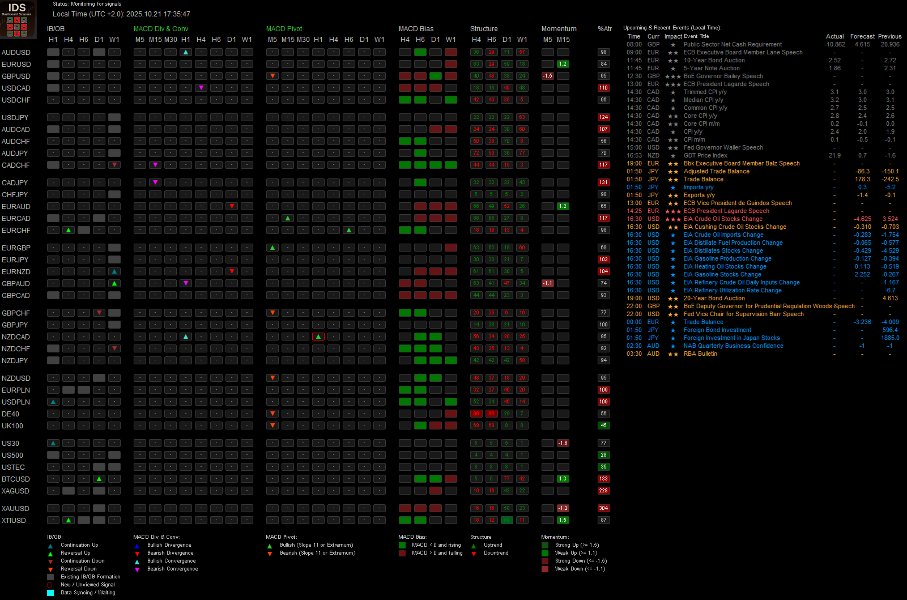
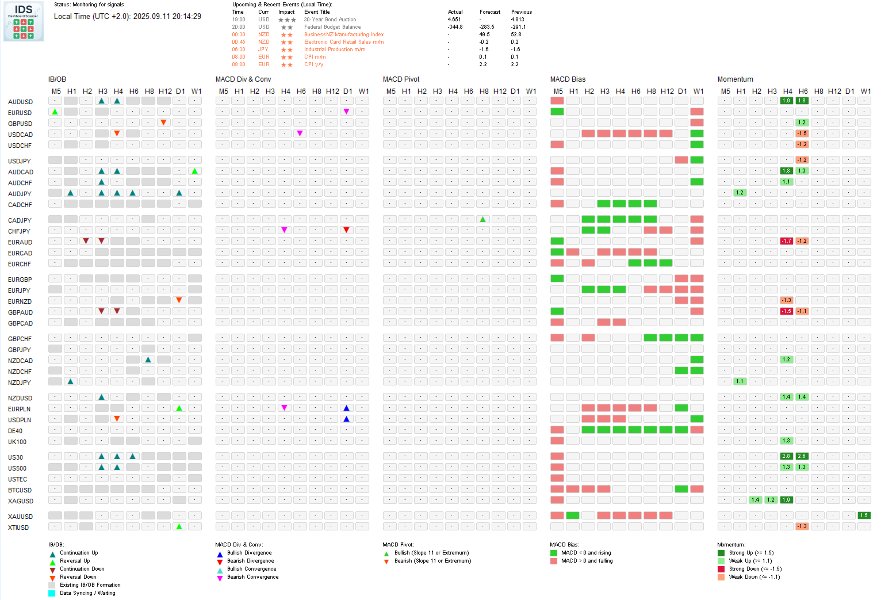
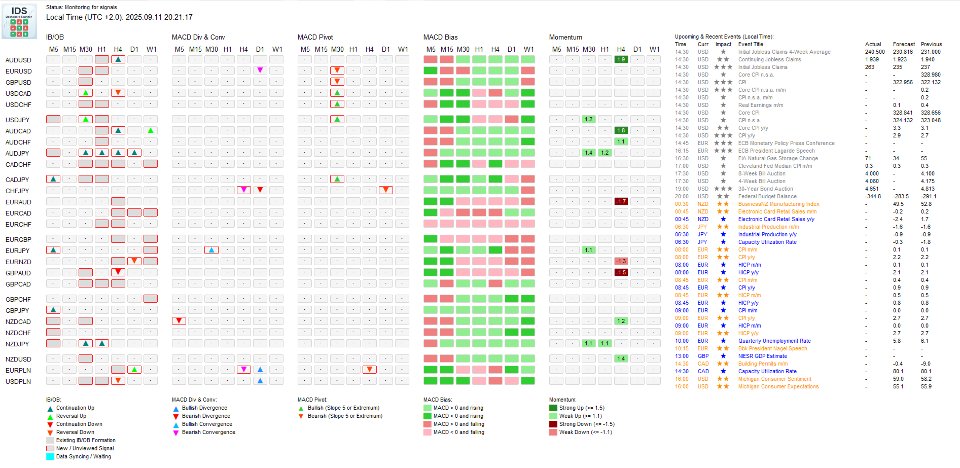
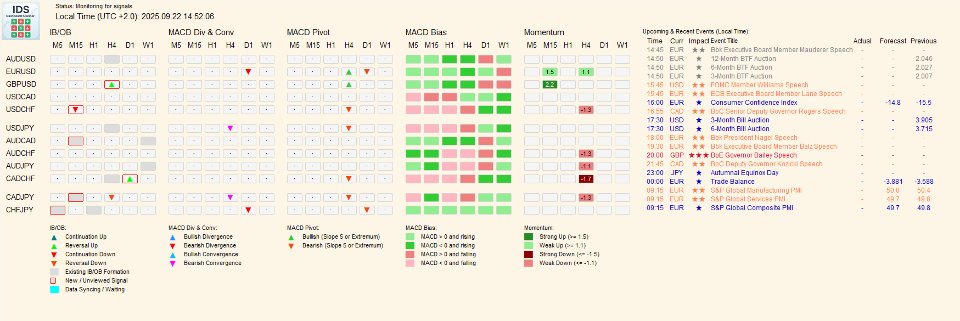
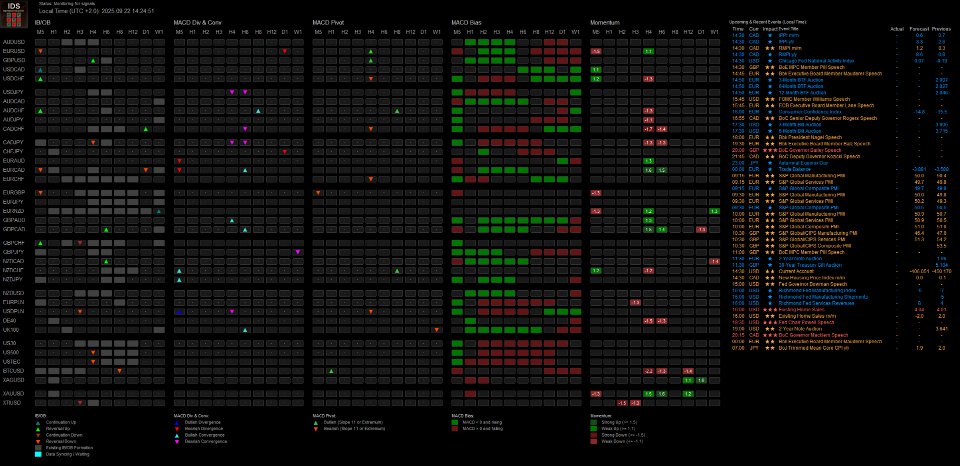
The Integrated Dashboard Scanner monitors multiple symbols and timeframes from a single panel. Version 3.51 features four core scanning modules based on Dariusz Dargo's trading strategy (IB/OB Breakouts, MACD Divergence & Convergence, MACD Pivot, MACD Bias) plus four supplementary filter modules (Market Structure, Momentum, Daily ATR Usage and Economic News). Each module can be configured independently with its own timeframes and alert settings. Click any signal to instantly switch your target chart to the relevant symbol and timeframe.
Key Features
-
Time-saving: Monitor all instruments from one panel—no more manual chart switching.
-
Four core strategy modules: IB/OB, MACD Divergence/Convergence, MACD Pivot, MACD Bias based on Dariusz Dargo's methodology.
-
Four supplementary filter modules: Market Structure, Momentum, Daily ATR Usage and Economic News to validate and time core signals.
-
NEW (v3.50): Market Structure Scanner: Advanced analytical tool tracking trend direction and retracement depth. Use as supplementary filter for core signals.
-
NEW (v3.50): Daily ATR Usage: Shows how much of the daily volatility range has been consumed, helping identify exhaustion or expansion opportunities.
-
NEW (v3.50): Per-Module Alert Control: Configure alerts independently for IB/OB, Divergence, and Pivot modules with visual indicators on the dashboard.
-
NEW (v3.50): Per-Module Timeframe Configuration: Each scanner monitors its own set of timeframes.
-
DPI-Aware Interface: Automatically adjusts to your display scaling for crisp visuals on any monitor.
-
One-Click Chart Switching: Click any signal to instantly switch to the relevant symbol and timeframe.
-
Large-Scale Monitoring: Monitor up to 384 symbol/timeframe combinations simultaneously.
-
Flexible Alerts: On-screen, push, and email notifications with automatic consolidation.
Scanning Modules Overview
Core Strategy Modules (Based on Dariusz Dargo's Methodology)
IB/OB Breakouts & Formations
Detects Inside Bar (consolidation) and Outside Bar (expansion) patterns at important price levels, then signals when price breaks out.
-
Inside Bar: A smaller bar completely contained within the previous bar—indicates consolidation. When price breaks out of this pattern at a swing high/low, it often leads to strong moves.
-
Outside Bar: A larger bar that engulfs the previous bar—indicates expansion and volatility increase.
-
Swing Level Filter: "Period to define Swing High/Low" (default: 31) filters IB/OB setups to show only those forming at local extremum points. The mother bar must be the highest high or lowest low within the last 31 bars to qualify as a valid setup.
What this actually does: This filter ensures patterns form at swing highs/lows, not just anywhere on the chart. It eliminates random IB/OB patterns forming during sideways consolidation where price isn't making clear swings. In a strong trend, you'll still see regular signals as price makes new highs or lows—the filter just makes sure each pattern is at a local turning point.
Higher values (e.g., 50) = stricter filter, the mother bar must be the extreme over a longer period—fewer signals, only at major swings. Lower values (e.g., 20) = looser filter, patterns qualify with shorter-term extremes—more frequent signals.
-
Breakout Classification: The scanner visually shows whether a breakout is continuation (same direction as prevailing trend) or reversal (opposite direction).
-
Formation Signals: Optionally highlight when a pattern forms, even before breakout occurs.
Quick Setup: Enable the module, configure timeframes in "Timeframes for IBOB Scanner". Adjust "Period to define Swing High/Low"—higher values (e.g., 50) = only patterns at major levels; lower values (e.g., 20) = more frequent signals. Enable/disable formation alerts (color before breakout). Configure alert settings independently for this module.
MACD Divergence & Convergence
Detects mismatches (divergence) or alignments (convergence) between price movement and the MACD indicator momentum.
-
Divergence: Price makes a new high but MACD doesn't (bearish divergence) or price makes a new low but MACD doesn't (bullish divergence). This mismatch often precedes reversals because momentum is weakening even though price is still moving.
-
Convergence: Price and MACD both make higher highs (bullish) or both make lower lows (bearish). This alignment confirms trend strength—momentum is accelerating with price.
-
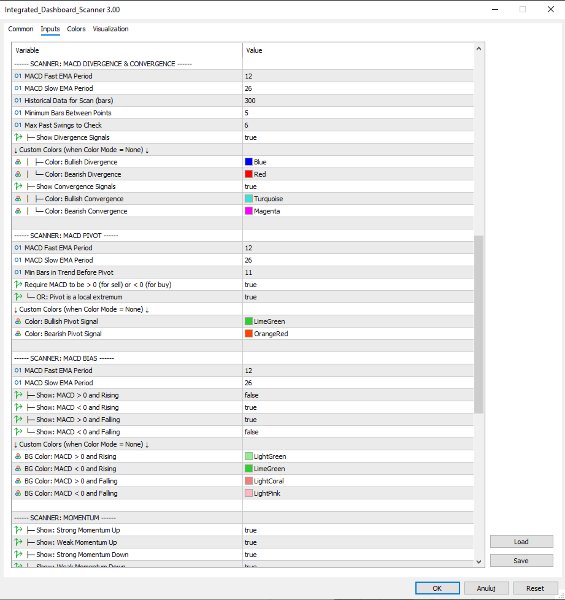
Independent Control: Enable/disable Divergence and Convergence signals separately. Set unique colors for each type.
-
Lookback Window: "Max Past Swings to Check" (default: 6) limits how far back the scanner looks for divergence/convergence patterns, focusing on recent, relevant setups.
Quick Setup: Enable the module, configure timeframes in "Timeframes for Divergence Scanner". Set MACD periods (Fast EMA: 12, Slow EMA: 26 are standard defaults). Adjust "Max Past Swings to Check" if you want to see older or only very recent patterns. Enable/disable divergence or convergence signals based on your strategy. Configure alerts independently for this module.
MACD Pivot
Identifies potential trend exhaustion by detecting when MACD momentum suddenly reverses after a sustained move.
-
How It Works: The scanner looks for situations where MACD histogram has been consistently rising (or falling) for several bars, then suddenly reverses direction. This "pivot" suggests the trend may be losing steam.
-
Trend Requirement: "Min Bars in Trend Before Pivot" (default: 5) means MACD must have been moving in one direction for at least 5 consecutive bars before a reversal counts as significant. This filters out minor wobbles.
-
Pivot Validation Options: You can choose how strictly to validate pivots:
-
"Require MACD to be > 0 (for sell) or < 0 (for buy)": If enabled, a bullish pivot only counts when MACD was below zero (recovering from bearish territory), and a bearish pivot only counts when MACD was above zero (weakening from bullish territory).
-
"OR: Pivot is a local extremum": If enabled, the pivot counts if MACD histogram reaches a local high/low at the reversal point, regardless of zero line position.
You can enable one, both, or neither:
-
Both disabled: Any reversal after the minimum trend bars qualifies as a pivot (most signals, least strict).
-
One enabled: Pivot must meet that condition (moderate filtering).
-
Both enabled: Pivot qualifies if it meets EITHER the zero line condition OR the extremum condition (still moderate, not super strict—it's OR logic, not AND).
-
Quick Setup: Enable the module, configure timeframes in "Timeframes for Pivot Scanner". Set MACD periods (Fast EMA: 12, Slow EMA: 26). Adjust "Min Bars in Trend Before Pivot"—higher values (e.g., 8) = only after strong trends; lower values (e.g., 3) = catch earlier pivots. Configure the validation options based on how selective you want to be. Configure alerts independently for this module.
MACD Bias
Shows the current momentum state of each symbol at a glance using MACD position and direction.
-
Four Possible States:
-
Rising & Above Zero: Strong bullish momentum (uptrend accelerating)
-
Rising & Below Zero: Recovering from downtrend (potential early uptrend)
-
Falling & Above Zero: Weakening uptrend (potential early downtrend)
-
Falling & Below Zero: Strong bearish momentum (downtrend accelerating)
-
-
Selective Display: Choose which states to show based on your trading style:
-
For established, strong trends: Display "Rising & Above Zero" and "Falling & Below Zero"—these show momentum accelerating in the direction of an already-established trend.
-
For early trend signals: Display "Rising & Below Zero" and "Falling & Above Zero"—these catch potential trend changes as MACD recovers from bearish territory or weakens from bullish territory.
-
For all momentum shifts: Display all four states to see every MACD condition.
-
-
Color Coding: Background color instantly shows the current bias—no need to read text.
Quick Setup: Enable the module, configure timeframes in "Timeframes for Bias Scanner". Set MACD periods (Fast EMA: 12, Slow EMA: 26). Select which of the four bias states you want displayed on the dashboard. Cells will only show when symbols match your selected states.
Supplementary Filter Modules
Economic News Calendar
Displays upcoming economic events and highlights symbols that will be affected.
-
Automatic Event Scanning: Fetches upcoming economic events from the MQL5 calendar and shows them on-screen with countdown timers.
-
Flexible Panel Positioning: Choose between two layouts—display the news panel at the top of the dashboard (next to the time) or to the right of the scanner. Pick whichever fits your screen better.
-
Symbol Highlighting: Automatically highlights symbols in the main grid when they're about to be affected by news (default: 30 minutes before). For example, if USD news is coming, all USD pairs will be highlighted.
-
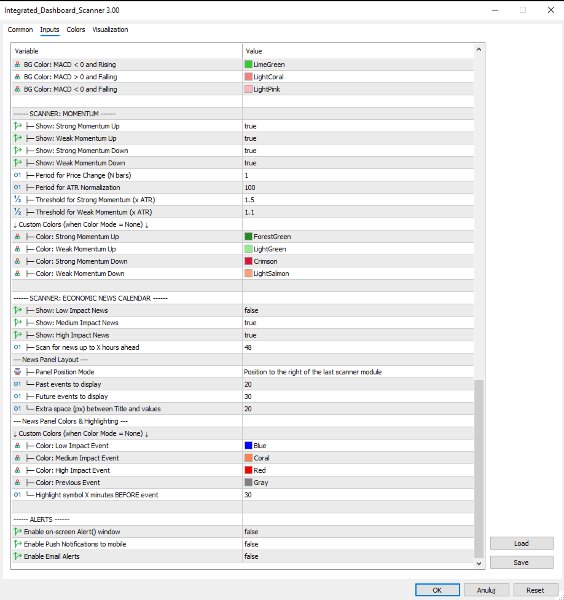
Filtering: Select which importance levels to show (Low, Medium, High) and how far ahead to scan (default: 48 hours).
-
Event History: Configure how many past events (default: 3) and upcoming events (default: 6) to display.
Quick Setup: Enable the module, choose "Panel Position Mode" (top or side). Select impact levels to monitor, set "Scan for news up to X hours ahead" (default: 48), and "Highlight symbol X minutes BEFORE event" (default: 30). Adjust event history numbers if needed.
Market Structure (NEW in v3.50) — Advanced Analysis Module
This is an advanced analytical tool provided as a supplementary feature. It serves as an additional filter when cross-referencing signals from the core strategy modules. Market structure analysis is inherently complex due to the nature of candlestick data and real-time swing identification.
Note: Treat structure signals as supplementary analysis and verify against other modules or your own chart analysis before making trading decisions. The scanner provides structure information as a technical reference, not as standalone trading signals.
Tracks market structure by analyzing trend direction and measuring how deeply price has retraced into recent swings.
-
Trend Direction: Shows whether each symbol is in an Uptrend or Downtrend based on swing analysis. Displayed in the tooltip with color coding.
-
Swing Sensitivity (default: 3.0): Controls which price moves are significant enough to track. This uses ATR (Average True Range - a measure of typical volatility). Higher values (e.g., 4.0) = only large swings are tracked. Lower values (e.g., 2.0) = smaller swings also count. For example, a value of 3.0 means a swing must be at least 3× the typical price fluctuation to be considered significant.
-
Retracement Highlighting (default: 75%): Shows how far (in percentage) price has pulled back into the current swing. When retracement exceeds your threshold, the cell background changes color. The default 75% catches deep pullbacks into the Discount Zone—areas where price has retraced significantly and may offer better entry opportunities. Setting it to 50% is useful for Premium/Discount zone strategies: retracement above 50% = price is in the Discount Zone (pulled back deep, "cheap"); retracement below 50% = price is in the Premium Zone (still near swing extreme, "expensive").
Quick Setup: Enable the module, set timeframes in "Timeframes for Structure Scanner". Adjust swing sensitivity if needed (start with default 3.0). Set retracement threshold: 75% for extreme pullbacks, 50% for Premium/Discount zones. Hover over cells to see full details. Always cross-reference structure readings with price action on the chart.
Momentum Scanner — Supplementary Filter Module
Identifies instruments with unusually strong price movements by comparing current price change to typical volatility. Use this module as a filter to confirm signals from the core strategy modules (IB/OB, MACD).
-
How It Works: The scanner measures how much price has moved compared to its Average True Range (ATR - typical price fluctuation over time). For example, a value of 2.0 means price moved twice as much as it normally does—indicating strong momentum. The scanner only displays symbols that exceed your defined thresholds.
-
Thresholds: Set what counts as "Strong" (default: 1.5, meaning price moved 50% more than typical) and "Weak" (default: 1.1, meaning 10% more than typical) momentum. The scanner filters out symbols with momentum below the "Weak" threshold, showing only instruments with notable movement.
-
Direct Display: Shows the momentum value in each cell. Higher numbers = stronger moves.
Quick Setup: Enable the module, configure timeframes.
"Period for Price Change" (default: 1): Sets the measurement window. Default (1 bar) measures immediate momentum—recommended for most traders. Higher values (e.g., 5) measure momentum over a longer period.
"Period for ATR Normalization" (default: 100): Controls volatility calculation. Leave at default.
Thresholds: Adjust "Strong" (default: 1.5) and "Weak" (default: 1.1) based on how selective you want to be—higher thresholds = fewer, stronger signals. Select which states to display (strong/weak, up/down).
Daily ATR Usage (NEW in v3.50) — Supplementary Filter Module
Shows how much of the daily volatility range has already been used up on intraday timeframes. Use this module as a filter to identify optimal entry timing for signals from the core strategy modules.
-
How It Works: The scanner compares the current price movement on lower timeframes (e.g., H1, M15) against the average daily range. A reading of 30% means price has only moved 30% of what it typically moves in a full day—suggesting room for more movement. A reading of 120% means price has already exceeded the typical daily range—suggesting potential exhaustion.
-
Visual Highlighting: Automatically highlights symbols with low usage (<50%, potential for expansion) or high usage (>100%, potential exhaustion).
-
Percentage Display: Shows exact usage percentage for each symbol.
Quick Setup: Enable the module, set "ATR Period for D1" (default: 14 days). The scanner automatically calculates and displays usage percentages with color highlighting. Look for low percentages to find instruments with expansion potential, or high percentages to identify exhaustion zones.
How to Use – Quick Setup
-
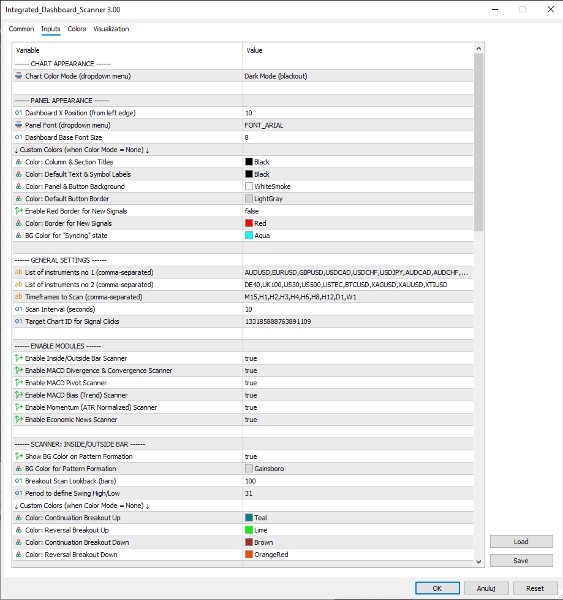
Add Symbols: Enter symbols into "List of instruments no 1" and "List of instruments no 2" (comma-separated, e.g., EURUSD,GBPUSD,USDJPY).
-
Configure Timeframes: Each module has its own timeframe list. Configure them independently based on your strategy. For example, scan IB/OB on H4 and D1, but scan Momentum on M15 and H1.
-
Set Up Target Chart:
-
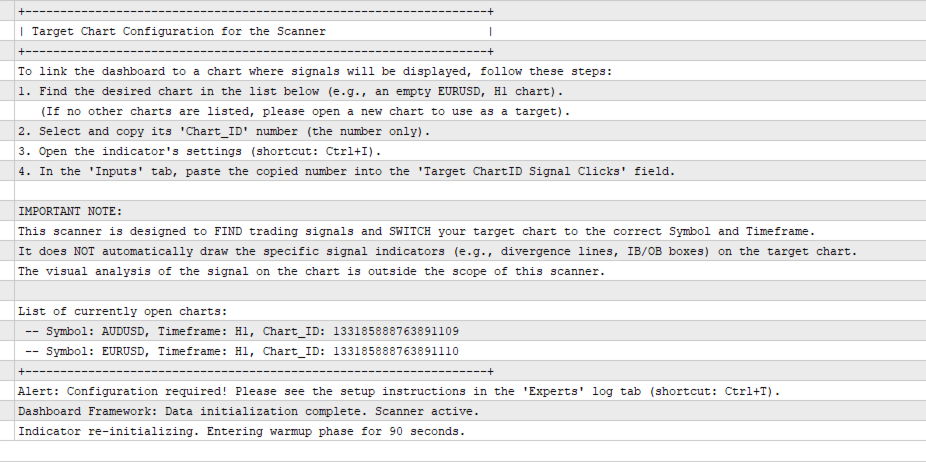
Open a new chart (any symbol).
-
Press Ctrl+T to open the Terminal window, go to "Experts" tab.
-
Find the line showing the chart ID (a number like 133424567890).
-
Copy that number and paste it into "Target Chart ID for Signal Clicks" in the scanner settings.
-
Customize your target chart with templates, indicators, etc. When you click a scanner signal, only the symbol and timeframe will change—your layout stays intact.
-
-
Enable Alerts: Choose which modules should send alerts (IB/OB, Divergence, Pivot). Enabled modules show a small indicator on the dashboard.
-
Scan Speed: Set "Scan Interval (seconds)" to control refresh frequency (default: 10 seconds). Lower values = more frequent updates but slightly higher CPU usage.
Strategy Integration
The scanner includes four core modules implementing Dariusz Dargo's trading methodology (IB/OB, MACD Divergence/Convergence, MACD Pivot, MACD Bias, Economic News) and four supplementary filter modules (Momentum, Daily ATR Usage, Market Structure and News Calendar) designed to help validate and time entries from the core signals.
Recommended approach: Use the core modules to identify trading opportunities, then cross-reference with the filter modules to improve entry timing and risk management. For example, combine an IB/OB breakout signal with low Daily ATR Usage (room for expansion) and strong Momentum readings for higher-probability setups.
Important Note
The scanner displays information and alerts—it does not draw lines on charts (such as divergence trendlines) and does not execute trades. Alerts are primarily visual (text in cells, color changes, optional red border around new signals). Push notifications and emails are optional—configure them in the ALERTS section.
Advanced Features
-
Red Border for New Signals: New, unviewed signals can be marked with a red border. Can be enabled/disabled per module.
-
Alert Consolidation: If multiple new signals appear in one scan cycle, they're combined into a single notification instead of spamming you.
-
Panel Legends: Optional visual legends show which modules have alerts enabled and other status information.
Full Control Over Settings
-
General: Set scan frequency, organize symbols into two separate lists for better management.
-
Modules: Enable or disable any of the eight modules independently.
-
Parameters: Fine-tune every module—MACD periods, swing detection sensitivity, momentum thresholds, ATR settings, news filtering, etc.
-
Panel Appearance: Choose Light or Dark mode, or set custom colors. Adjust panel position, font sizes, and colors for different states.
-
Alerts: Configure on-screen, push, and email notifications. Set alerts per module with independent red border control.
The core scanner modules are designed to work together following Dariusz Dargo's trading strategy principles, with supplementary filter modules providing additional confirmation and timing tools.
If you can open and monitor 384 charts at once—one for every symbol and timeframe—you probably don't need this scanner. For everyone else, the Integrated Dashboard Scanner lets you control the whole market from a single, clear panel.
Take command of the market with the Integrated Dashboard Scanner and reclaim hours of manual chart watching!

