SMA ReEntry

1

What is SMA Reentry

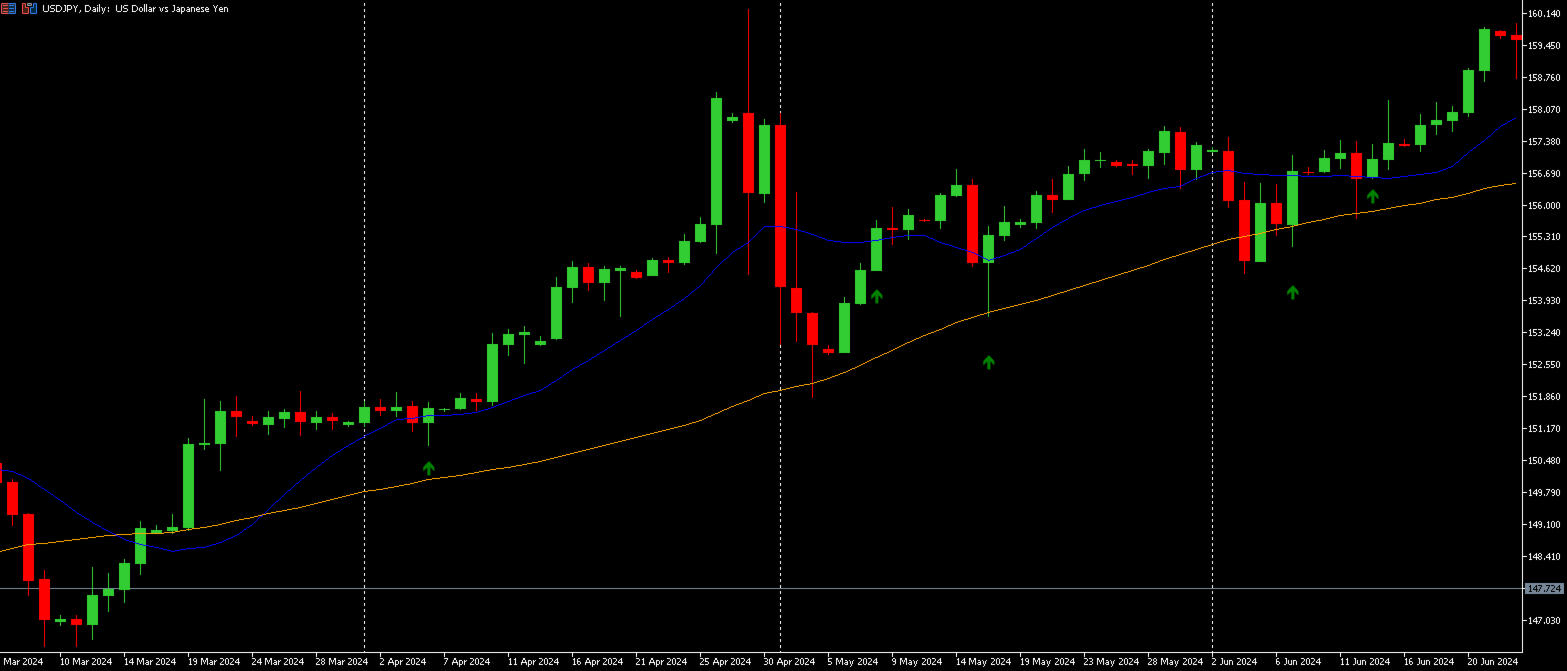
SMA Reentry is a professional indicator that signals reentry points in the direction of the trend using two simple moving averages (SMA): one fast and one slow. The indicator clearly shows when the price re-enters above or below the fast moving average, in the presence of a trend defined by the slow SMA. It is the ideal tool for those seeking clear pullback, breakout, and trend reentry signals.

How It Works

  • Identifies the main trend through the crossover of the fast and slow SMA.

  • Highlights pullbacks and reentries, displaying an arrow each time the price returns above (or below) the fast SMA, confirming the trend.

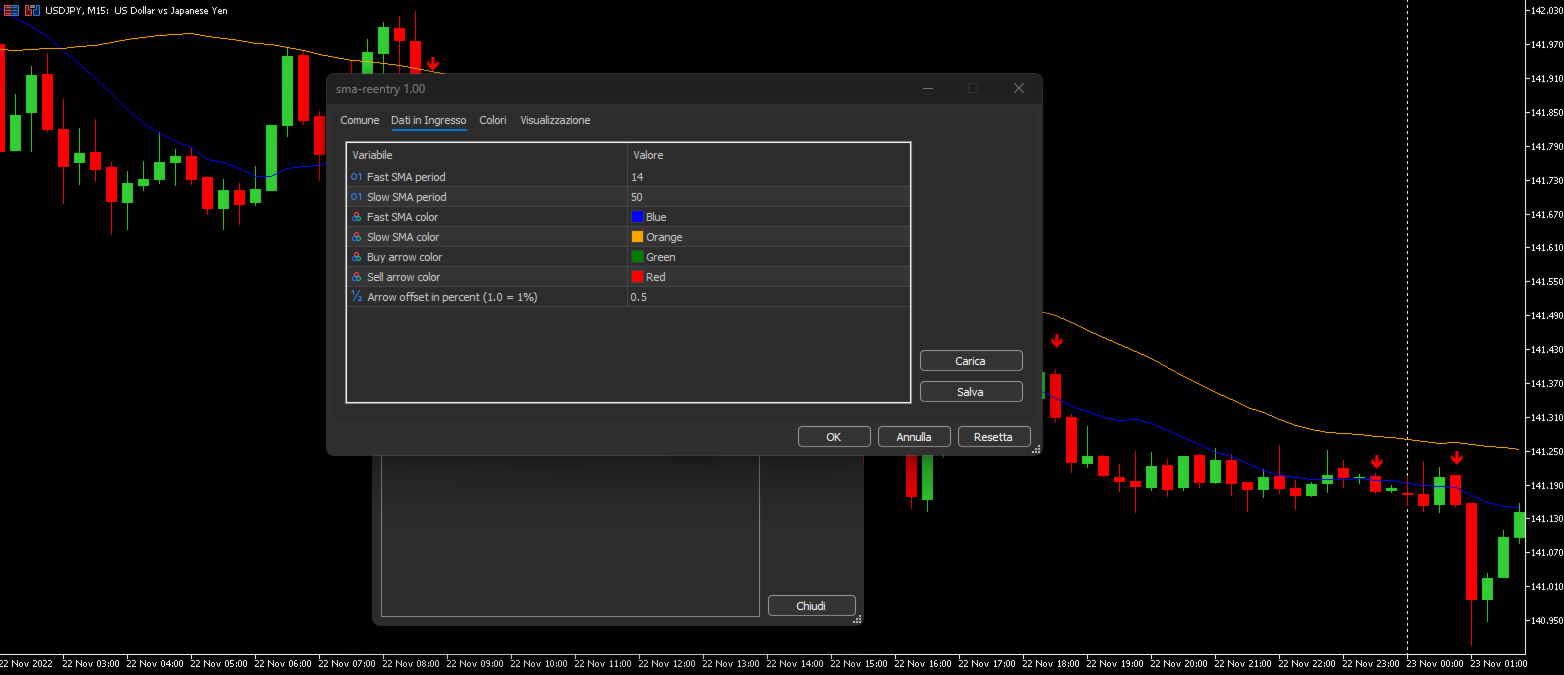
  • Offers customizable inputs for periods, line and arrow colors, and arrow distance from price.

  • Displays both the fast and slow SMA directly on the chart, making visual analysis easier.

Ideal For

  • Traders who use trend following or want to optimize their entry after a pullback.

  • Breakout and reentry strategies.

  • Identifying key points where the price resumes the trend after a correction.

  • Both discretionary and systematic traders.

Main Features

  • Clear trend-following entry signals.

  • Easy and fully customizable configuration.

  • Visualization of both moving averages directly on the chart.

  • Intuitive arrows showing reentry signals.

  • Works on all timeframes and any financial instrument.

Recommended Combination

Enhance your strategy by combining “SMA Reentry” with this recommended indicator:
Candlestick Pattern Analyzer: https://www.mql5.com/en/market/product/145419
Discover the main candlestick patterns to confirm trend and pullback signals!

Keywords

trend, breakout, pullback, pulback, pullback trading, pullback signals, pullback entry, pullback strategy, pullback reentry, pullback pattern, pullback breakout, SMA, moving average, reentry, trading system, trend signals, moving average crossover, price action, MetaTrader indicators, forex strategies, reversal, candlestick, momentum, scalping, day trading, intraday trading, swing trading, support resistance, entry point, signal confirmation, candlestick pattern, automated trading, technical analysis, SMA cross, risk management, charts, entry signals, oscillator, reversal pullback, best pullback, trailing pullback, long pullback, short pullback


Recommended products
Rainbow MT5
Jamal El Alama
4 (1)
Description : Rainbow MT5 is a technical indicator based on Moving Average with period 34 and very easy to use. When price crosses above MA and MA changes color to green, then this is a signal to buy. When price crosses below MA and MA changes color to red, then this is a signal to sell. The Expert advisor ( Rainbow EA MT5 ) based on Rainbow MT5 indicator is now available here . MT4 version is available here .
FREE
Follow The Line MT5
Oliver Gideon Amofa Appiah
4.6 (35)
This indicator obeys the popular maxim that: "THE TREND IS YOUR FRIEND" It paints a GREEN line for BUY and also paints a RED line for SELL. (you can change the colors). It gives alarms and alerts of all kinds. IT DOES NOT REPAINT and can be used for all currency pairs and timeframes. Yes, as easy and simple as that. Even a newbie can use it to make great and reliable trades. NB: For best results, get my other premium indicators for more powerful and reliable signals. Get them here: https://www.m
FREE
Indicator Description 4 Hull MA Color + Envelopes is a powerful trend-following indicator for MetaTrader 5 that combines four Hull Moving Averages (HMA) with Moving Average Envelopes to clearly identify market direction, trend strength, and potential reversal or pullback zones. This indicator is designed to reduce noise, react quickly to price movement, and provide a clean visual structure for professional trading.   Key Features   4 Hull Moving Averages (20, 50, 100, 200) Automatic color change
FREE
Are you tired of drawing trendlines every time you're analyzing charts? Or perhaps you would like more consistency in your technical analysis. Then this is for you. This indicator will draw trend lines automatically when dropped on a chart. How it works Works similar to standard deviation channel found on mt4 and mt5. It has 2 parameters: 1. Starting Bar 2. Number of bars for calculation The   starting bar   is the bar which drawing of the trend lines will begin, while the   number of bars for c
FREE
Donchian Breakout And Rsi
Mattia Impicciatore
4.5 (2)
General Description This indicator is an enhanced version of the classic Donchian Channel , upgraded with practical trading functions. In addition to the standard three lines (high, low, and middle), the system detects breakouts and displays them visually with arrows on the chart, showing only the line opposite to the current trend direction for a cleaner view. The indicator includes: Visual signals : colored arrows on breakout Automatic notifications : popup, push, and email RSI filter : to val
FREE
Multi-timeframe trend indicator based on the ADX / ADXWilder indicator with Fibonacci levels The indicator shows trend areas using ADX or ADXWilder indicator data from multiple timeframes. The impulse mode of the indicator allows you to catch the beginning of a trend, and several "Screens" with different timeframes allow you to filter out market noise. Fibonacci levels are added to the price chart, which have flexible settings. How the indicator works: if PDI is greater than NDI, then   it`s
FREE
ThreePointsChannelFree
Dimitr Trifonov
5 (1)
This is a free version of the indicator, the period between the vertical lines is always 30 bars. In the paid version the period can be set by user, so a configuration with many ThreePointsChannel indicators with different periods is possible. The principle of construction - on top of any number of bars set by the user, a channel is constructed with maximum and minimum lines so that the bars touch the maximum and minimum of the channel at exactly three points. The name of the indicator follows
FREE
DoubleRSI Signal
Florian Pierre Bonnet
DoubleRSI — Dual RSI Crossover Indicator with Signal Filters Description DoubleRSI displays two RSI lines with configurable periods on a separate window and generates buy/sell signals based on crossovers between the two RSI lines within defined price zones. How it works A buy signal is generated when the short RSI crosses above the long RSI while the long RSI is within the configured buy zone (default 50-70). A sell signal is generated when the short RSI crosses below the long RSI while the long
FREE
LT Donchian Channel
Thiago Duarte
4.86 (7)
Donchian Channel is an indicator created by Richard Donchian. It is formed by taking the highest high and the lowest low of the last specified period in candles. The area between high and low is the channel for the chosen period. Its configuration is simple. It is possible to have the average between the upper and lower lines, plus you have alerts when price hits one side. If you have any questions or find any bugs, please contact me. Enjoy!
FREE
MACD Titanium
Donovan Tjin-a-tak
MACD Titanium is a zero-lag MACD indicator for MetaTrader 5 designed to provide faster and cleaner momentum signals compared to the classic MACD. By using Zero-Lag EMA calculations, the indicator reduces signal delay and reacts more quickly to changes in market momentum while preserving the familiar MACD structure traders rely on. What Makes It Different Unlike the standard MACD, MACD Titanium: • Uses Zero-Lag EMAs to reduce lag • Responds faster to momentum shifts • Highlights crossover points
FREE
Important Lines
Terence Gronowski
4.88 (24)
This indicator displays Pivot-Lines, preday high and low, preday close and the minimum and maximum of the previous hour. You just have to put this single indicator to the chart to have all these important lines, no need to setup many single indicators. Why certain lines are important Preday high and low : These are watched by traders who trade in a daily chart. Very often, if price climbs over or falls under a preday low/high there is an acceleration in buying/selling. It is a breakout out of a
FREE
Coral Indi
Dinh Duong Luong
Coral trend is   a trend-following indicator that is widely popular among FOREX traders . It is usually used as a confluence with other indicators. It uses combinations of moving averages with complex smoothing formulas! It has two configurable parameters: Coefficient   - smoothing ratio (*) Applied price Calculation: Coral = (-0.064) * B6 + 0.672 * B5 - 2.352 * B4 + 2.744 * B3
FREE
Candle Countdown — Accurate Time to Close for MT5 Candle Countdown is a simple and precise tool that shows the remaining time until the current candle closes directly on the chart. When your entry depends on the candle close, even a few seconds matter. This indicator helps you see the exact time and make decisions without rushing or guessing. An indicator for precise control over candle closing time. The indicator displays: time remaining until candle close current server time spread Stop Level
FREE
VFI Quantum
Nikita Berdnikov
5 (1)
Introducing VFI (Volume Flow Indicator) – a trading indicator that analyzes the relationship between volume and price movement to identify key trading opportunities. The indicator displays the strength and direction of volume flow, providing clear signals about potential entry and exit points. Signals are formed based on zero line crossovers, crossovers between the VFI line and its exponential moving average (EMA), and when the indicator exits overbought and oversold zones. Attention! This stra
FREE
Tabajara V5
Flavio Javier Jarabeck
4.83 (36)
Metatrader 5 version of the famous Andre Machado's Tabajara indicator. If you don't know Andre Machado's Technical Analysis work you don't need this indicator... For those who need it and for those several friend traders who asked this porting from other platforms, here it is... FEATURES 8-period Moving Average 20-period Moving Average 50-period Moving Average 200-period Moving Average Colored candles according to the inflexion of the 20-period MA SETTINGS You can change the Period of all MA's
FREE
Dual RSI
Paul Conrad Carlson
3.5 (2)
Indicator alerts for Dual Relative strength index rsi. Large rsi preset at 14 is below 30 small rsi preset at 4 is below 10 for buy bullish signals . Large rsi preset are 14 is above 70 small rsi preset at 4 is above 90 for sell bearish signals . Includes mobile and terminal alerts. draws lines when alerts. This indicator can help identify extremes and then the tops or bottoms of those extremes .
FREE
The Dual WMA Entry System is a clean, no-nonsense indicator that plots two Weighted Moving Averages directly on your price chart and automatically detects low-momentum (sideways) market conditions. WMA1 is calculated on the open price with a slight offset and acts as a trend bias line. WMA2 is calculated on the close price and acts as a momentum confirmation line. When the distance between the two WMAs narrows, the market is entering consolidation. During these periods, candles are automatically
FREE
Mitimom
Danil Poletavkin
The indicator is based on Robert Miner's methodology described in his book "High probability trading strategies" and displays signals along with momentum of 2 timeframes. A Stochastic oscillator is used as a momentum indicator. The settings speak for themselves period_1 is the current timeframe, 'current' period_2 is indicated - the senior timeframe is 4 or 5 times larger than the current one. For example, if the current one is 5 minutes, then the older one will be 20 minutes The rest of the s
FREE
This indicator is a zero-lag indicator and displays  strength of trend change . True Trend  Oscillator Pro works best in combination with True Trend Moving Average Pro that displays exact trend as is. Oscillator value is exact price change in given direction of the trend. True Trend Moving Average Pro: https://www.mql5.com/en/market/product/103586 If you set PERIOD input parameter to 1 this indicator becomes a sharpshooter for binary options. Developers can use True Trend Oscillator in Exper
FREE
The CV MACD Indicator is a modern and professional momentum indicator designed to analyze trend strength, market direction and potential reversals. By combining the MACD line, signal line and histogram, the indicator helps traders identify market momentum and high-quality trading opportunities with clarity and precision. Features: Precise MACD momentum analysis Early trend reversal detection Clear histogram for market strength visualization Adjustable Fast, Slow and Signal periods Visual Buy & S
FREE
Super Trend Strategy
Minh Khoa Nguyen
4.5 (4)
The SuperTrend Strategy is a widely-used technical indicator based on the Average True Range (ATR), primarily employed as a trailing stop tool to identify prevailing market trends. The indicator is designed for ease of use while providing reliable insights into the current market trend. It operates based on two key parameters: the period and the multiplier . By default, it uses a period of 15  for the ATR calculation and a multiplier of 3 . The Average True Range (ATR) plays a crucial role in th
FREE
WaveTrend Arrow LIGHT is a clean and lightweight WaveTrend-based arrow indicator for MetaTrader 5. This free version focuses purely on visual buy & sell arrows , generated from WaveTrend WT1 and WT2 crossings, without alerts or notifications. It is designed for traders who prefer a simple, non-repainting arrow indicator and for developers who want a stable signal source for EA integration . Features: Buy & Sell arrows based on WaveTrend crossing Non-repainting signals (closed bar option) Clean a
FREE
MACD Enhanced
Nikita Berdnikov
5 (3)
Introducing the MACD  Enhanced – an advanced MACD (Moving Average Convergence Divergence) indicator that provides traders with extended capabilities for trend and momentum analysis in financial markets. The indicator uses the difference between the fast and slow exponential moving averages to determine momentum, direction, and strength of the trend, creating clear visual signals for potential entry and exit points. Attention! To achieve the best results, it is recommended to adapt the indicator
FREE
VOLUMIZED ORDER BLOCKS [Riz] - MT5 Indicator             Smart Money Order Block Detection with Volume Analysis Volumized Order Blocks is an advanced Smart Money Concepts (SMC) indicator that automatically detects institutional order blocks with integrated volume analysis. It identifies high-probability supply and demand zones where banks and institutions
FREE
HMA5
Sergey Sapozhnikov
4.3 (10)
Hull Moving Average is more sensitive to the current price activity than a traditional Moving Average. It faster responds to trend change and more shows the price movement more accurately. This is a color version of the indicator. This indicator has been developed based in the original version created by Sergey <wizardserg@mail.ru>. Suitable for all timeframes. Parameters Period - smoothing period, recommended values are 9 to 64. The larger the period, the softer the light. Method - smoothing m
FREE
Bollinger Bands B
Flavio Javier Jarabeck
4.25 (4)
John Bollinger created this indicator in 2010 as a way to read the original indicator (Bollinger Bands) in a more "technical" way, shown as an oscillator. The typical range of the Bollinger Bands %B is 0 - 0.5 - 1.0, where "0" represents the lower band, the "0.5" the middle band, and "1" the upper band. The line on the indicator represents the Closing prices. As simple as that. SETTINGS Bollinger Bands period of analysis Standard Deviation multiplier Shift Price type to be analyzed If you like
FREE
RSI abcd
Francisco Gomes Da Silva
4.33 (3)
RSI ABCD Pattern Finder: Technical Strategy 1. How the Indicator Works Combines the classic RSI with automatic detection of ABCD harmonic patterns . Key Components Standard RSI (adjustable period) Peak and Trough Markers (arrows) ABCD Patterns (green/red lines) Overbought (70) and Oversold (30) Filters 2. MT5 Setup period = 14 ; // RSI period size = 4 ; // Maximum pattern size OverBought = 70 ; // Overbought level OverSold = 30 ; // Oversold level Filter = USE_FILTER_ YES ; // Confirmation filte
FREE
MA Cross Signals
Quang Vinh Nguyen
MA Cross Marker helps traders visualize market direction with two customizable moving averages and clear crossover signals. It can display MA lines from one selected timeframe on the current chart and mark bullish or bearish crosses automatically. Designed for traders who want a lightweight, easy-to-read MA crossover tool. Key Features Display two customizable Moving Averages Automatic Buy/Sell signals on MA crossover Single timeframe MA selection (including higher timeframe display) Clean and
FREE
Stat Monitor 5
Sergei Linskii
5 (1)
Stat Monitor is a good information indicator. Benefits of the indicator: The indicator provides useful information - the current spread, the cost of one lot of the symbol, trading leverage and the recommended lot size for trading. You can use the indicator on the MetaTrader 5 trading platform of any broker. The indicator provides useful information. Version of the Stat Monitor indicator for MetaTrader 4 I wish you all good luck in trading and stable profit!
FREE
The MACD indicator in MetaTrader 5 does not look like MACD as it was designed. That is because the MetaTrader 5 version of MACD displays the MACD line as a histogram when it is traditionally displayed as a line. Additionally, the MetaTrader 5 version computes the Signal line using an SMA, while according to MACD definition it is supposed to be an EMA. The MetaTrader 5 version also does not compute a true MACD Histogram (the difference between the MACD/Signal lines). This can be confusing for peo
FREE
Buyers of this product also purchase
SuperScalp Pro
Van Minh Nguyen
4.64 (25)
SuperScalp Pro – Advanced Multi-Filter Scalping Indicator System SuperScalp Pro is an advanced scalping indicator that combines the classic Supertrend with multiple intelligent confirmation filters to help identify trading opportunities. It works efficiently across multiple timeframes from M1 to H4, with optimized performance on XAUUSD, BTCUSD, and major Forex pairs. The indicator provides clear Buy and Sell signals, along with automatically calculated entry price, stop loss, and take profit lev
Divergence Bomber
Ihor Otkydach
4.9 (89)
Each buyer of this indicator also receives the following for free: The custom utility "Bomber Utility", which automatically manages every trade, sets Stop Loss and Take Profit levels, and closes trades according to the rules of this strategy Set files for configuring the indicator for various assets Set files for configuring Bomber Utility in the following modes: "Minimum Risk", "Balanced Risk", and "Wait-and-See Strategy" A step-by-step video manual to help you quickly install, configure, and s
SignalTech MT5 is an unique fully rule based trading system for EURUSD, USDCHF, USDJPY, AUDUSD, NZDUSD, EURJPY, AUDJPY, NZDJPY, CADJPY.  All the winning trades with chart setups are published on the comments page. 2026-05 3493 Pips (Until 05-21 NY Closed) 2026-04 2243 Pips 2026-03 2165 Pips 2026-02 2937 Pips 2026-01 2624 Pips 2025-12 1174 Pips It can generate signals with Buy/Sell Arrows and Pop-Up/Sound Alerts. Each signal has clear Entry and Stop Loss levels, which should be automatically flag
Entry In The Zone and SMC Multi Timeframe is a real-time 2-in-1 market analysis tool that combines market structure analysis and a No Repaint BUY / SELL signal system into a single indicator, built on Smart Money Concepts (SMC) — a widely adopted framework used by professional traders to understand market structure. This indicator helps you see the market more clearly, make decisions based on structure rather than guesswork, and focus on high-probability zones where price is more likely to react
Gold Entry Sniper
Tahir Mehmood
5 (9)
Gold Entry Sniper – Professional Multi-Timeframe ATR Dashboard for Gold Scalping & Swing Trading Gold Entry Sniper is a cutting-edge MetaTrader 5 indicator designed to give traders precise buy/sell signals for XAUUSD and other symbols, powered by ATR Trailing Stop logic and a multi-timeframe analysis dashboard . Built for both scalpers and swing traders, it combines real-time market direction , dynamic stop levels , and professional visual dashboards to help you identify high-probability gold en
Let's be honest first. No indicator will make you profitable on its own. If someone tells you otherwise, they're selling you a dream. Every indicator that shows perfect buy/sell arrows can be made to look flawless — just zoom into the right window of history and screenshot the winners. We won't do that. SMC Intraday Formula is a tool. It reads the market structure for you, maps the highest-probability price zones, and tells you exactly what the smart money footprint looks like right now — in pl
Azimuth Pro
Ottaviano De Cicco
5 (7)
Azimuth Pro V2: Synthetic Fractal Structure and Confirmed Entries for MT5 Overview Azimuth Pro is a multi-level swing structure indicator by Merkava Labs . Four nested swing layers, swing-anchored VWAP, ABC pattern detection, three-timeframe structural filtering, and closed-bar confirmed entries — one chart, one workflow from micro-swings to macro-cycles. This is not a blind signal product. It is a structure-first workflow for traders who care about location, context, and timing. V2 Launch Offe
Power Candles MT5
Daniel Stein
5 (8)
Power Candles V3 - Self-Optimizing Strength Indicator Power Candles V3 turns currency and instrument strength into an actionable trade plan on every chart it is attached to. Instead of just coloring candles, it runs a live auto-optimization in the background and hands you the best Stop Loss, Take Profit and signal threshold for the symbol in front of you. One click adopts it for live trading - entry, Stop Loss and Take Profit rays appear on the chart at the exact prices, and alerts fire with dir
TREND CATCHER INDICATOR Trend Catcher Indicator analyzes market price movements, using a combination of the author’s proprietary and customized adaptive trend-analysis indicators.  It identifies the true market direction by filtering out short-term noise and focusing on underlying momentum strength, volatility expansion, and price structure behavior.  It also uses a combination of smoothing and trend-filtering customized indicators such as moving averages, RSI, and volatility filters.   Real ope
New Update of   Smart Trend Trading System MT5 For  2026 Market: If You Buy this Indicator you will Get my Professional Trade Manager + EA  for FREE . First of all Its worth emphasizing here that this Trading System is Non-Repainting   , Non Redrawing and Non Lagging Indicator Which makes it ideal from both manual and robot trading .  [Online course] , [manual] and [download presets] . The Smart Trend Trading System MT5 is a comprehensive trading solution tailored for new and experienced traders
FX Trend MT5 NG
Daniel Stein
5 (6)
FX Trend NG: The Next Generation Multi-Market Trend Intelligence Overview FX Trend NG is a professional multi-timeframe trend and market monitoring tool designed to give you a complete structural overview of the market in seconds. Instead of switching between dozens of charts, you instantly see which symbols are trending, where momentum is fading, and where strong alignment exists across timeframes. This tool is part of the Stein Investments ecosystem - 18+ tools plus Max, your 1-on-1 AI tradi
ARIPoint
Temirlan Kdyrkhan
1 (1)
ARIPoint is a powerful trading companion designed to generate high-probability entry signals with dynamic TP/SL/DP levels based on volatility. Built-in performance tracking shows win/loss stats, PP1/PP2 hits, and success rates all updated live. Key Features: Buy/Sell signals with adaptive volatility bands Real-time TP/SL/DP levels based on ATR Built-in MA Filter with optional ATR/StdDev volatility Performance stats panel (Success, Profit/Loss, PP1/PP2) Alerts via popup, sound, push, or email Cu
Gann Made Easy   is a professional and easy to use Forex trading system which is based on the best principles of trading using the theory of W.D. Gann. The indicator provides accurate BUY and SELL signals including Stop Loss and Take Profit levels. You can trade even on the go using PUSH notifications. PLEASE CONTACT ME AFTER PURCHASE TO GET TRADING  INSTRUCTIONS   AND GREAT EXTRA INDICATORS   FOR FREE! Probably you already   heard   about the Gann trading methods before. Usually the Gann theory
First of all Its worth emphasizing here that this Trading Tool is Non Repainting , Non Redrawing and Non Lagging Indicator , Which makes it ideal for professional trading . [Online course] ,   and   [manual] The Smart Price Action Concepts Indicator is a very powerful tool for both new and experienced traders . It packs more than 20 useful indicators into one , combining advanced trading ideas like Inner Circle Trader Analysis and Smart Money Concepts Trading Strategies . This indicator focuses
Trend Screener Pro MT5
STE S.S.COMPANY
4.85 (104)
Trend Screener Indicator --Professional Trend Trading & Market Scanning System for MetaTrader Unlock the true power of trend trading with Trend Screener Indicator — a complete multi-currency, multi-timeframe trend analysis solution powered by Fuzzy Logic,Trend Pulse Technology  and advanced market structure algorithms.   Trend Screener transforms your MetaTrader platform into a professional-grade Trend Analyzer and Market Scanner, helping you identify high-probability trend opportunities, early
KT Alpha Hunter Arrows MT5
KEENBASE SOFTWARE SOLUTIONS
Most arrow indicators give you a signal and leave you to figure out the rest. KT Alpha Hunter Arrows gives you the full trading plan. Every signal arrow prints with a full plan already drawn: entry line, stop-loss, four take-profit levels, and a live edge verdict telling you whether this symbol and time-frame is worth trading right now. An included Trade Manager EA handles the execution after you enter, so discipline stays intact when the market gets loud. Non-repaint. Closed-bar signals only. B
Market Structure Order Block Dashboard MT5 is an MT5 indicator designed for traders who want to read market structure and the main price reaction zones directly on the chart. It combines BOS, ChoCH, Order Blocks, Fair Value Gaps (FVG), Liquidity, Kill Zones, Volume Profile, and a compact dashboard for quick analysis. This indicator targets traders who use market structure, ICT and Smart Money concepts as a decision framework. It can help spot trend continuations, possible reversals, price imbala
Atomic Analyst MT5
Issam Kassas
3.94 (31)
New Update of   Atomic Analyst MT5 For  2026 Market: If You Buy this Indicator you will Get my Professional   Trade Manager + EA  for   FREE . First of all Its worth emphasizing here that this Trading Indicator is   Non-Repainting   , Non Redrawing and Non Lagging Indicator   Indicator, Which makes it ideal from both manual and robot trading.  User manual: settings, inputs and strategy . The Atomic Analyst  is a PA Price Action Indicator that uses Strength and Momentum of the price to find a bet
Introducing   Quantum Breakout PRO , the groundbreaking MQL5 Indicator that's transforming the way you trade Breakout Zones! Developed by a team of experienced traders with trading experience of over 13 years,   Quantum Breakout PRO   is designed to propel your trading journey to new heights with its innovative and dynamic breakout zone strategy. Quantum Breakout Indicator will give you signal arrows on breakout zones with 5 profit target zones and stop loss suggestion based on the breakout b
FX Levels MT5
Daniel Stein
5 (14)
FX Levels: Exceptionally Accurate Support & Resistance for All Markets Quick Overview Looking for a reliable way to pinpoint support and resistance levels across any market—currencies, indices, stocks, or commodities? FX Levels merges our traditional “Lighthouse” method with a forward-thinking dynamic approach, offering near-universal accuracy. By drawing from real-world broker experience and automated daily plus real-time updates, FX Levels helps you identify reversal points, set profit targe
FX Power MT5 NG
Daniel Stein
5 (32)
FX Power: Analyze Currency Strength for Smarter Trading Decisions Overview FX Power is your go-to tool for understanding the real strength of currencies and Gold in any market condition. By identifying strong currencies to buy and weak ones to sell, FX Power simplifies trading decisions and uncovers high-probability opportunities. Whether you’re looking to follow trends or anticipate reversals using extreme delta values, this tool adapts seamlessly to your trading style. Don’t just trade—trade
OrderFlux | Footprint Orderflow for MetaTrader 5 Version 2.0 – Real-time Bid/Ask Visualization for Active Traders OrderFlux is a footprint and orderflow indicator for MT5. It shows not only where the price has moved, but what happens inside the movement: Bid/Ask volume per price level, delta, imbalance, and volume distribution. Many charts only show you the final result of a candle. OrderFlux shows you the path to get there. This is exactly what helps when you want to read market participation i
Btmm state engine pro
Garry James Goodchild
5 (4)
BTMM State Engine Pro is a MetaTrader 5 indicator for traders who use the Beat The Market Maker approach: Asian session context, kill zone timing, level progression, peak formation detection, and a multi-pair scanner from a single chart. It combines cycle state logic with a built-in scanner dashboard so you do not need the same tool on many charts at once. What it does Draws the Asian session range; session times can follow broker server offset or be set in inputs. Tracks level progression (L
Quantum TrendPulse
Bogdan Ion Puscasu
5 (25)
Introducing Quantum TrendPulse , the ultimate trading tool that combines the power of SuperTrend , RSI , and Stochastic into one comprehensive indicator to maximize your trading potential. Designed for traders who seek precision and efficiency, this indicator helps you identify market trends, momentum shifts, and optimal entry and exit points with confidence. Key Features: SuperTrend Integration: Easily follow the prevailing market trend and ride the wave of profitability. RSI Precision: Detect
RelicusRoad Pro MT5
Relicus LLC
4.96 (24)
RelicusRoad Pro: Quantitative Market Operating System 70% OFF LIFETIME ACCESS (LIMITED TIME) - JOIN 2,000+ TRADERS Why do most traders fail even with "perfect" indicators? Because they trade Single Concepts in a vacuum. A signal without context is a gamble. To win consistently, you need CONFLUENCE . RelicusRoad Pro is not a simple arrow indicator. It is a complete Quantitative Market Ecosystem . It maps the "Fair Value Road" price travels on, distinguishing between random noise and true structur
GoldenX Entry MT5
Kareem Abbas
5 (5)
You have probably tested dozens of indicators before.  But we are not here to be “just another signals indicator.” Behind GoldenX Entry is intensive research & development focused on building sophisticated algorithms designed to adapt to the real behavior of every instrument — not generic signals recycled everywhere else. From advanced Auto Optimizer technology that automatically discovers the best settings for every timeframe, to detailed historical performance analysis and market-adaptive l
Trend Forecaster
Alexey Minkov
5 (7)
Trend Forecaster – Since 2023. The Trend Forecaster indicator utilizes a unique proprietary algorithm to determine entry points for a breakout trading strategy. The indicator identifies price clusters, analyzes price movement near levels, and provides a signal when the price breaks through a level. The Trend Forecaster indicator is suitable for all financial assets, including currencies (Forex), metals, stocks, indices, and cryptocurrencies. You can also adjust the indicator to work on any time
Reversal Master for MT5 Reversal Master for MT5 is a non‑repainting reversal indicator for MetaTrader 5. It helps you detect potential market reversal points and shows the maximum favourable price movement after each historical signal, so you can better understand how price behaved after similar situations in the past. The MT5 version keeps the familiar reversal‑signal logic of the original Reversal Master for MT4, but adds improved visualisation, historical statistics and a points summary panel
Meridian Pro
Ottaviano De Cicco
5 (2)
Meridian Pro 2.00: Professional Multi-Timeframe Trend Matrix for MT5 Meridian Pro 2.00 is a professional adaptive trend matrix for MetaTrader 5. It combines the original Meridian trend engine, a clean chart ribbon, closed-bar signal arrows, an 8-timeframe dashboard, Fuel momentum, weighted consensus, synthetic HTF processing and chart-native higher-timeframe context lines. The goal is simple: read current trend, multi-timeframe structure, strength, momentum and EA-ready state from one discipline
This dashboard shows the latest available   harmonic patterns   for the selected symbols, so you will save time and be more efficient /   MT4 version . Free Indicator:   Basic Harmonic Pattern Comparison of "Basic Harmonic Pattern" vs. "Basic Harmonic Patterns Dashboard" Indicators Feature Basic Harmonic Pattern Basic Harmonic Patterns Dashboard Functionality Detects and displays harmonic patterns on a single chart Searches multiple symbols and timeframes for harmonic patterns, displays res
More from author
Smart Volume Profile
Mattia Impicciatore
4.67 (9)
Smart Volume Profile is a professional volume profile indicator that calculates and displays in real time the distribution of volumes between two vertical lines, with buy/sell split and POC, VAH, VAL levels. Designed for both discretionary and systematic trading, it allows you to see where the market traded the most and how buying and selling pressure was distributed within the selected period. Why this indicator Full control of the analysis period thanks to two draggable VLINEs that define the
FREE
Support and Resistance MultiTime
Mattia Impicciatore
4.75 (4)
Overview This indicator monitors three types of support and resistance levels derived from previous periods: Daily (yesterday’s high and low), Weekly (last week), and Monthly (last month). It visually maps key price levels where reactions are more likely, making it valuable for identifying potential reversals as well as significant breakouts . Features Automatically draws: High/Low of yesterday (Daily) High/Low of the previous week (Weekly) High/Low of the previous month (Monthly) Each level has
FREE
Bollinger RSI ReEntry
Mattia Impicciatore
5 (3)
Expert Advisor Version If you prefer automated trading instead of manual signals, you can find the Expert Advisor version of this indicator here: https://www.mql5.com/en/market/product/148222 This indicator computes price reentry moments after a candle has pierced outside the Bollinger Bands , combining that signal with an RSI confirmation to reduce false positives. A Buy ReEntry signal is detected when price had moved below the lower band and then returns inside, with the optional confirmati
FREE
Download ready-to-use set files for Bollinger RSI ReEntry EA: https://c.mql5.com/31/1515/bollinger-rsi-Ea-Sets.zip Introduction Bollinger RSI ReEntry EA is an Expert Advisor for MetaTrader that combines Bollinger Bands and RSI to detect high-probability entry points. The strategy is designed to identify market re-entries after volatility spikes, with confirmation filters to increase signal reliability. Key Features Bollinger Bands Strategy : detects breakouts and re-entries at the bands for acc
Donchian Breakout And Rsi
Mattia Impicciatore
4.5 (2)
General Description This indicator is an enhanced version of the classic Donchian Channel , upgraded with practical trading functions. In addition to the standard three lines (high, low, and middle), the system detects breakouts and displays them visually with arrows on the chart, showing only the line opposite to the current trend direction for a cleaner view. The indicator includes: Visual signals : colored arrows on breakout Automatic notifications : popup, push, and email RSI filter : to val
FREE
Market Phase Analyzer
Mattia Impicciatore
4 (3)
General Description Clear indicators and simple rules to read the three key phases of the market. This indicator identifies in real time an accumulation phase based on the Asian session, detects any liquidity sweeps during the manipulation phase, and confirms the directional phase during distribution. It displays green arrows for the bullish phase and red arrows for the bearish phase, draws the Asia box with customizable color and border, and optionally shows the daily open line for quick intra
FREE
Opening range
Mattia Impicciatore
Opening‑Range Sessions (GMT‑Aware) is a lightweight indicator that automatically draws the opening range — high, low, and a color‑filled box — for the main FX liquidity windows: Sydney, Tokyo, London and New York . The indicator detects your broker‑server time‑zone on the fly, so every session starts at the correct local moment, no matter where the server (or the trader) is located. Key features Automatic Time‑Zone Detection – Uses the server’s GMT offset; no manual time adjustment required when
FREE
Bollinger RSI ReEntry MT4
Mattia Impicciatore
5 (2)
Description (MT4) This indicator detects price reentry moments after a candle has pierced outside the Bollinger Bands, combining that signal with an optional RSI confirmation to reduce false positives. A Buy ReEntry signal is generated when price has moved below the lower band and then returns inside, optionally confirmed by the RSI just exiting an oversold condition. A Sell ReEntry signal is generated when price has moved above the upper band and then reenters, optionally confirmed by the RSI
FREE
Expert Advisor Version If you prefer automated trading instead of manual signals, you can find the Expert Advisor version of this indicator here: https://www.mql5.com/en/market/product/148310 False Breakout Detector is an indicator designed to identify situations where the price temporarily breaks a recent support or resistance level but quickly returns to the previous range. These false breakouts can be useful for discretionary analysis or contrarian trading strategies. Main Features: Automat
FREE
Advanced Economic Calendar Indicator This indicator displays all upcoming economic events directly on the chart, highlighting relevant news for the selected pair or instrument. It allows traders to anticipate high-volatility moments and plan their strategies with accuracy. Main Features Display of future events up to 5 days ahead (customizable). Filtering by news impact level (high, medium, low). Option to show vertical event lines and numbered markers for quick identification. Fully customizabl
FREE
False Breakout MT4
Mattia Impicciatore
False Breakout MT4 is an indicator designed to spot cases where price briefly breaks a recent support or resistance level and then quickly returns to the prior range. These false breakouts are valuable for discretionary analysis or contrarian trading approaches, providing visual cues without making predictive or automatic decisions. Main Features: Automatic detection of false breakouts around recent highs and lows (e.g., extended daily levels over two days). Clear visual representation with arro
FREE
Description Market Phase Analyzer is an advanced indicator designed to identify the three main market phases: Accumulation , Manipulation , and Distribution . Through automatic session analysis, the indicator draws the Asia Box , detects sweep moves above or below key levels, and confirms reversals with the ATR filter to reduce false signals. Main Features Highlights the Asian session range with a customizable box. Automatic detection of bullish or bearish sweeps. Optional ATR filter for signal
FREE
SR PrevPeriods MT4 Overview SR PrevPeriods automatically plots the previous day’s, previous week’s, and previous month’s high and low directly on your MetaTrader 4 chart in real time. It’s a lightweight indicator designed to highlight historical support and resistance zones, which often align with price reaction areas, breakouts, and rebalancing points. What it does It draws horizontal lines at key previous levels and, if desired, text labels showing the exact value. The lines update automatic
FREE
ATR crossover histogram
Mattia Impicciatore
5 (1)
ATR Volatility Histogram for MT5 – Technical Volatility Analysis This indicator calculates and displays the difference between a fast ATR and a slow ATR as a histogram, allowing you to visualize changes in market volatility in real time. Calculation Volatility Difference = Fast ATR - Slow ATR Interpretation Positive values (green bars) indicate rising volatility and can confirm breakout momentum. Negative values (red bars) indicate falling volatility, potential consolidation, or loss of moment
FREE
SMA ReEntry MT4
Mattia Impicciatore
5 (1)
Description SMA Reentry is an indicator for MetaTrader 4 designed to identify reentry points within the main trend. It uses two Simple Moving Averages: a fast one to capture short-term movements and a slow one to filter the overall market direction. A buy signal occurs when the fast SMA is above the slow SMA and the price moves back above the fast SMA after being below it on the previous candle. A sell signal occurs when the fast SMA is below the slow SMA and the price moves back below it after
FREE
Description Spread History is a simple yet essential indicator that displays the historical spread, candle by candle, in a separate window alongside its moving average. With a real‑time line and overlaid text on the main chart, you can easily monitor the spread applied by your broker at every market phase. Purpose Show the actual spread provided by the broker for each candle Calculate and display the spread’s moving average over a configurable period Overlay the current spread value and its av
FREE
Fair Value Gap Zone
Mattia Impicciatore
General Description The Fair Gap Value Indicator identifies and highlights “fair value gaps” on the MetaTrader 5 chart. A fair gap occurs when a price void forms between the low of one bar and the high of another, separated by an intermediate bar. The indicator draws colored rectangles (bullish and bearish) to emphasize these areas, providing clear visual support for price-action strategies. Key Features Bullish Gap Detection : highlights gaps between a bar’s low and the high of two bars prior w
FREE
General Description This indicator calculates in real time the Pearson correlation coefficient between multiple financial instruments. It displays a dynamic correlation matrix that shows the strength and direction of relationships among currencies, indices, stocks, and commodities. Main Parameters SymbolsList : list of instruments to compare (comma separated) BarsToAnalyze : number of historical bars used for calculation TimeFrame : timeframe for correlation analysis Correlation Interpretation
FREE
Body Ratio Indicator for MT5 – Candle Strength and Compression Analyzer The Body Ratio Indicator is a technical tool for analyzing candlestick structure and identifying market conditions based on the ratio between the candle’s body (open-close) and its total range (high-low). This simple yet powerful calculation helps traders detect strong momentum candles, indecision candles, and range compression phases, which often precede major breakouts. Each candlestick is categorized in real time: Weak c
FREE
Description: NR4 & NR7 Inside Bar Highlighter is an indicator that automatically detects price compression patterns based on a combination of NR4 or NR7 with an Inside Bar. The NR4 (Narrow Range 4) pattern identifies the candle with the smallest range among the last 4 bars, while NR7 considers the last 7. When this narrow-range condition occurs alongside an Inside Bar (a candle completely contained within the previous one), it often signals a low-volatility phase that may precede a strong breako
FREE
Description Candlestick Pattern Analyzer is an advanced tool for both discretionary and systematic traders, designed to automatically identify major Japanese candlestick patterns and deliver a detailed statistical analysis of their historical performance. This indicator is perfect for those who want to verify the real-world effectiveness of patterns and use them alongside confirmation filters (e.g., trend, key levels, volume) and a well‑defined risk‑management strategy. Key Features Automatic
Candlestick Pattern Analyzer for MT4 Description Candlestick Pattern Analyzer is an advanced tool for both discretionary and systematic traders, built to automatically detect major Japanese candlestick patterns and deliver a detailed statistical breakdown of their historical performance. This indicator is perfect for those who want to objectively verify the real-world effectiveness of patterns and combine them with confirmation filters (e.g., trend, key levels, volume) and a well-defined risk m
Description: NR4 & NR7 Inside Bar Highlighter for MetaTrader 4 is an indicator that automatically detects price compression patterns based on the combination of NR4 or NR7 with an Inside Bar . How it works: The NR4 (Narrow Range 4) pattern identifies the candle with the smallest range among the last 4 bars, while NR7 considers the last 7. When this narrow-range condition occurs alongside an Inside Bar (a candle completely contained within the previous one), it often signals a low-volatility ph
FREE
Short Description: A powerful tool to measure trend efficiency and filter market noise. Toggle between a sleek line chart or a color-coded histogram with threshold alerts. Key Features: Dual Plot Styles: Line (RSI-like) or colored histogram (Trend/Neutral/Range). Configurable Thresholds: Set your own upper (trend) and lower (range) levels. Multi-Mode Visualization: Clear visual cues—green for strong trends, gray for consolidation, red for ranging markets. Flexible Period: Adjustable calculation
FREE
Simple Range Filter
Mattia Impicciatore
Simple Range Filter is an indicator designed to highlight candles with high or low volatility . It calculates the average range (High - Low) over a defined number of candles and dynamically adjusts the thresholds based on market conditions. Main Features: Dynamic calculation of average range Visual highlighting of bars with above or below-average range Configurable parameters for colors and calculation period Real-time updates (tick-by-tick) Use Cases: Helps identify periods of low volatility (
FREE
Description Volatility ATR Crossover Histogram is an indicator for MetaTrader 4 that measures the expansion and contraction of volatility by comparing a fast ATR with a slow ATR. The result is displayed in a colored histogram in a separate window. Green bars indicate an increasing volatility phase, while red bars indicate decreasing volatility. It is designed as a universal filter for entry timing, trade management, and market regime detection. How it works The indicator calculates two ATRs w
FREE
Overview Performance Indicator shows a heatmap of percentage returns for a list of symbols over configurable time intervals. It is used to visually compare relative strength and weakness , without giving any guarantee of results. Configuration SymbolsList: comma-separated symbols; must match exactly the names in the terminal. BaseTF: base timeframe for calculations. UpdateSeconds: interval in seconds for automatic refresh. CapPercent: normalization value for color intensity. PeriodsList: stri
FREE
What is Bias Finder The Bias Finder (with Export) is an advanced indicator designed to detect and analyze market statistical biases, providing a clear visualization of recurring tendencies. This tool is especially useful for both discretionary and systematic traders who want to integrate quantitative analysis into their trading strategies. Analysis Modes The indicator calculates and displays price bias according to different time logics: Hourly Bias : statistical analysis hour by hour. Weekday B
Bias Seasonal Pattern Analyzer for MT5 – Real-Time Seasonal Bias Analysis Bias Finder is an advanced tool for seasonal market analysis, designed to clearly display average profits generated during different time-based segments: Hourly Bias – shows the most profitable hours of the day Weekday Bias – reveals the best-performing day of the week for each symbol Day‑of‑Month Bias – analyzes behavior at the start and end of each month Monthly Bias – ideal for long-term seasonal or monthly trend analy
False Breakout EA MT5
Mattia Impicciatore
Download ready-to-use set files for False Breakout EA: https://c.mql5.com/31/1514/False-Breakout-EA.zip False Breakout EA is an Expert Advisor designed to detect and exploit false breakouts on key support and resistance levels. The system uses daily candle analysis to identify re-entries after false breakouts, with an optional RSI confirmation filter to increase signal reliability. Trading logic Automatic detection of false breakouts on support and resistance. Optional RSI confirmation to filt
Filter:
James Erasmus
3179
James Erasmus 2025.11.05 16:20 
 

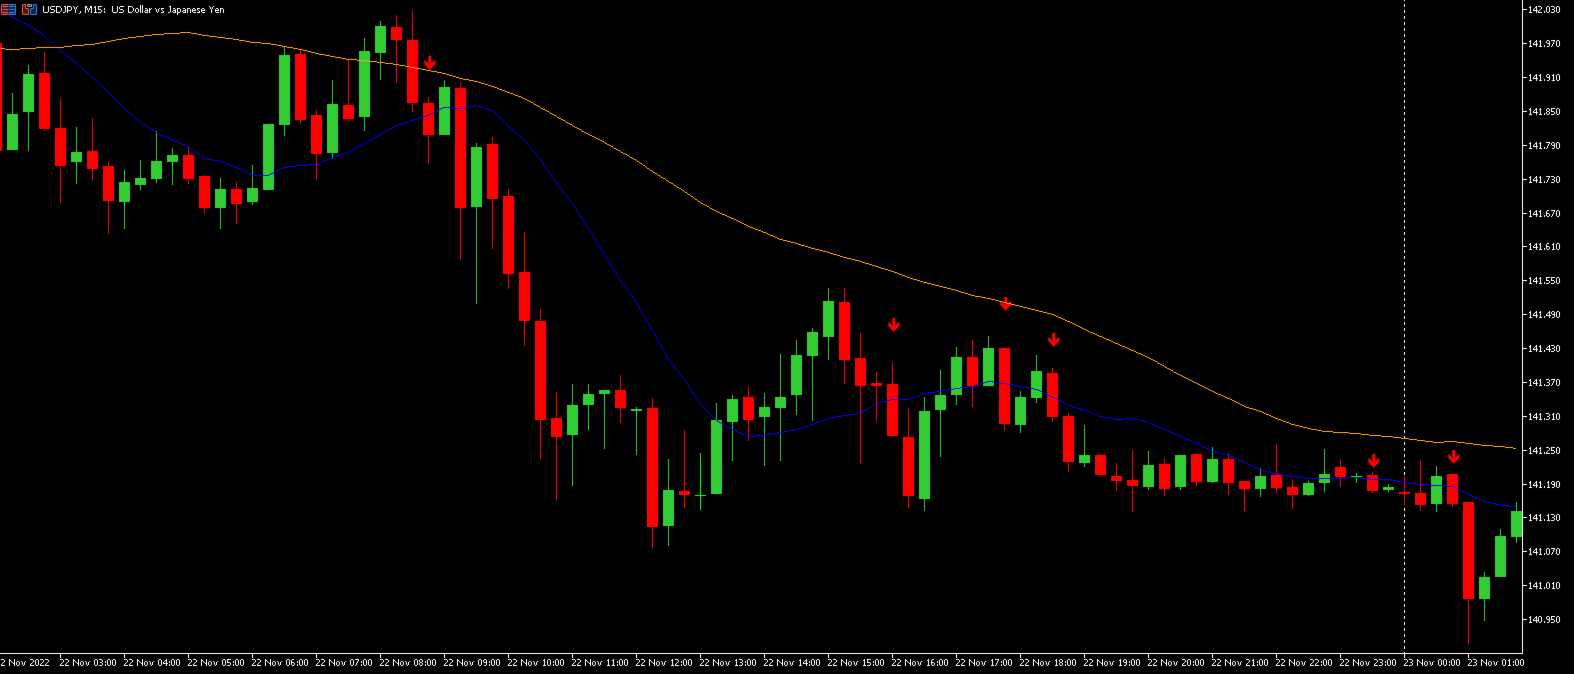
Indicator does not update in real time. Shows past arrows, but future bars will not show arrows unless trader updates chart, change tf or refresh. I am not certain about repaint. will test further. will update review once developer makes necessary changes.

Reply to review