Technische Indikatoren für den MetaTrader 5 - 8

Azimuth wurde für strukturorientierte Trader entwickelt, die eine vollständige Marktzyklusanalyse in einer professionellen Suite suchen.
Während die meisten ZigZag-Indikatoren nur große Swings anzeigen, zeigt Azimuth 4 verschachtelte Swing-Ebenen gleichzeitig (L1/L2/L3/L4) — für frühe Zykluseinstiege, späte Zykluswarnungen und vollständigen strukturellen Kontext. Kombiniert mit Swing-verankertem VWAP (keine willkürlichen täglichen Resets), MTF-ZigZag-Swings und automatisierter ABC-Mustererkenn
FREE

Allgemeine Beschreibung Dieser Indikator ist eine erweiterte Version des klassischen Donchian-Kanals , ergänzt um praxisorientierte Handelsfunktionen.
Neben den drei Standardlinien (oberes Band, unteres Band und Mittellinie) erkennt das System Breakouts und zeigt diese visuell mit Pfeilen im Chart an. Dabei wird nur die Linie angezeigt, die der aktuellen Trendrichtung entgegengesetzt ist , um die Darstellung klarer zu gestalten. Der Indikator beinhaltet: Visuelle Signale : farbige Pfeile bei Bre
FREE

Ichimoku Trend Alert ist der Ichimoku Kinko Hyo Indikator mit Alerts und Signalfiltern.
Ichimoku Trend Alert Funktionen: Optionale Überprüfung von Ichimoku-Wolke, Tenkan sen (Umkehrlinie), Kijun sen (Basislinie), Senkou-Spanne A, Senkou-Spanne B und Chikou-Spanne relativ zum Preis und mehr. Popup-, E-Mail- und Telefon-Benachrichtigungen für ausgewählte Symbole und Zeitrahmen.
Es gibt 9 klassische Ichimoku-Trendfilter, die Sie in den Einstellungen aktivieren/deaktivieren können : Price/Cloud Or
FREE

Entwickelt von smart2trader.com Der Pin Bar Color-Indikator erkennt und malt automatisch Pin Bar-Muster auf dem Chart in anpassbaren Farben und bietet flexible Einstellungen zur Identifizierung von Handelsmöglichkeiten. Darüber hinaus können Sie mit unserem Pin Bar-Indikator Pin-Bar-Musterformationen in Echtzeit überwachen und werden immer in den letzten 30 Sekunden vor dem Schließen der Kerze benachrichtigt.
Über das Pin Bar-Muster
Das Pin-Bar-Muster wird in der technischen Analyse häufig verw
FREE
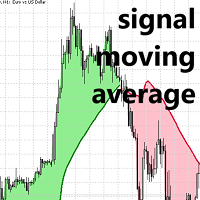
Signal Moving Average Lux Algo für MT5
Entdecken Sie einen einzigartigen gleitenden Durchschnitt-Indikator, der speziell für die Signallinien-Nutzung in gleitenden Durchschnitt-Crossover-Systemen entwickelt wurde. Dieses fortschrittliche Tool zeichnet sich dadurch aus, dass es in schwankenden Märkten vom Preis abweicht und in Trendmärkten einen Standard-Gleitenden Durchschnitt genau abbildet. Diese Eigenschaft hilft Händlern, unnötiges Rauschen und potenzielles Overtrading aufgrund von Marktsc
FREE

Volume Footprint Analysis ist ein präzisionsgefertigter, volumenbasierter Indikator, der das rohe Marktvolumen in ein intuitives, farbcodiertes Signalsystem umwandelt. Dieses Tool, das auf Konzepten der Volume Spread Analysis (VSA) und Smart Money-Prinzipien basiert, macht Schluss mit dem Rätselraten bei der Interpretation des Volumens und liefert Händlern klare, umsetzbare Erkenntnisse darüber, wann sie kaufen oder verkaufen sollten - auf jedem Zeitrahmen und für jedes Handelsinstrument. MT4-Ve

Trend Trading ist ein Indikator, der so weit wie möglich von den Markttrends profitiert, indem er Pullbacks und Breakouts zeitlich festlegt. Sie findet Handelsmöglichkeiten, indem sie analysiert, was der Preis während etablierter Trends tut. [ Installationsanleitung | Update-Anleitung | Fehlerbehebung | FAQ | Alle Produkte ]
Handeln Sie mit Zuversicht und Effizienz an den Finanzmärkten Profitieren Sie von etablierten Trends, ohne ins Wanken zu geraten Profitable Pullbacks, Ausbrüche und vorze
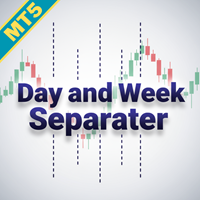
Optimieren Sie Ihre Handelsanalyse mit dem Day and Week Separator MT5, einem intuitiven Tool, das anpassbare Tages- und Wochentrennlinien zeichnet, ideal für Trader, die mit Zeitunterschieden zwischen Brokern zu kämpfen haben. In Handelsgemeinschaften wie Forex Factory und Reddit’s r/Forex wird dieses Tool für seine Einfachheit und Effektivität geschätzt, da es die häufige Herausforderung löst, Chart-Zeitrahmen mit lokalen oder marktspezifischen Zeiten abzustimmen, wie es in Diskussionen auf Pla
FREE
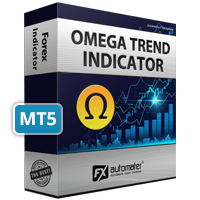
Der Omega-Trend-Indikator ist ein fortschrittliches Instrument, das speziell entwickelt wurde, um Markttrends frühzeitig zu erkennen und sie effizient zu verfolgen. Der Indikator zeichnet zwei Linien. Die Haupttrendlinie (dicker) stellt die mutmaßliche untere oder obere Volatilitätsgrenze des aktuellen Markttrends dar. Ein Bruch der Haupttrendlinie deutet auf eine mögliche Umkehr oder Verschiebung der Trendbewegung hin. Die Trendlinie zeigt auch den besten Punkt für die Platzierung einer Stop-Lo
FREE
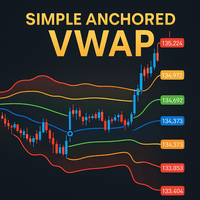
Simple Anchored VWAP ist ein leichtgewichtiges und dennoch leistungsstarkes Tool für Händler, die präzise volumengewichtete Niveaus ohne Komplexität wünschen.
Mit diesem Indikator können Sie VWAP von einem beliebigen Punkt auf dem Chart aus verankern und sofort sehen, wie der Preis um institutionelle Volumenzonen herum reagiert. MT4-Version - https://www.mql5.com/en/market/product/155320
Beitreten und Markttiefe lernen - https://www.mql5.com/en/channels/suvashishfx Mithilfe von VWAP-Bändern und
FREE

Interpretation des Delta Volume Score Indikators: 1. Das Metrik-Panel (Aggressive Score System) Das Panel in der oberen rechten Ecke ist das „Gehirn“ des Indikators. Es fasst den Kampf zwischen Käufern und Verkäufern zusammen. Buyer Score: Repräsentiert das kumulierte Volumen der Marktkaufaufträge (Aggression). Seller Score: Repräsentiert das kumulierte Volumen der Marktverkaufsaufträge (Aggression). Aggressive Score: Dies ist der Nettosaldo (Delta). Wenn er positiv und grün ist, haben die Käufe
FREE

VM Breakout BB: Wahrscheinlichkeitsbasierter Breakout-Indikator mit Bollinger-Bändern VM Breakout BB ist ein Breakout-Erkennungsindikator, der Bollinger-Bänder mit statistischer Wahrscheinlichkeitsanalyse (Z-Score und die kumulative Verteilungsfunktion der Normalverteilung, CDF) kombiniert und intelligente Bestätigungsfilter wie RSI, ADX und Volume SMA verwendet. Der Indikator soll Signale mit klarer statistischer Grundlage liefern, Rauschen reduzieren und Breakouts bestätigen, die eine höhere E
FREE

Einführung
Der Bounce-Zone-Indikator ist ein hochmodernes technisches Instrument, das nicht nachzeichnet, sondern dazu dient, Schlüsselbereiche auf dem Kurschart zu identifizieren, in denen die Marktstimmung wahrscheinlich eine bedeutende Kursumkehr verursachen wird. Mithilfe fortschrittlicher Algorithmen und der Analyse historischer Kursdaten zeigt dieser Indikator potenzielle Bounce-Zonen auf. In Kombination mit anderen Einstiegssignalen kann dieser Indikator Devisenhändlern helfen, die best
FREE
** Alle Symbole x Alle Zeitrahmen scannen nur durch Drücken der Scanner-Taste ** Nach 18 Jahren Erfahrung an den Märkten und in der Programmierung ist der Winner-Indikator fertig. Ich würde gerne mit Ihnen teilen! *** Kontaktieren Sie mich, um Ihnen den "Trend Finder Indikator " kostenlos zu schicken, eine Anleitung zu erhalten und Sie in die "M1 Signal Scanner Gruppe" aufzunehmen, damit Sie Ihre Erfahrungen mit anderen Nutzern teilen oder sehen können. Einführung: M1 Signal Scanner ist ein Ind

Vorteile und Verwendung des Volume Bubble Tools Dieses Tool (eines meiner Favoriten von Algo Alpha, von Tradingview) bietet eine fortschrittliche Methode der Volumenanalyse, die über traditionelle Histogramme hinausgeht. Es nutzt die statistische Normalisierung (Z-Score) von Daten mit niedrigerem Zeitrahmen, um statistisch signifikante Volumenereignisse zu identifizieren und zu klassifizieren und die Dynamik zwischen "Smart Money" (institutionellen) und "Retail"-Teilnehmern zu visualisieren. Wic

Um Zugang zur MT4-Version zu erhalten, klicken Sie bitte auf https://www.mql5.com/en/market/product/130055 - Dies ist die exakte Umsetzung von TradingView: "Ut Alart Bot Indikator". - Für weitere Änderungen, die Sie benötigen, können Sie eine Nachricht im privaten Chat senden. Hier ist der Quellcode eines einfachen Expert Advisors, der auf den Signalen von Ut Bot Indicator basiert. #property copyright "This EA is only education purpose only use it ur own risk" #property link " https://site
FREE

Die Kenntnis der Niveaus des Vortages oder der Vorwoche ist eine sehr wichtige Information für Ihren Handel.
Mit diesem Indikator können Sie Vortag Hoch/Tief Hoch/Tief der Vorwoche
Congifuration Hoch & Tief für: Vortag, Woche Linienstil, Farbe Etikettenposition, Größe, Farbe Wenn Sie Fragen oder Kommentare haben, senden Sie mir eine direkte Nachricht hier https://www.mql5.com/en/users/mvonline
FREE

- Real Preis ist 200$ - 50% Rabatt (Es ist 99$ jetzt) - Es ist für 4 Käufe aktiviert. Kontaktieren Sie mich für zusätzliche Bonus (Gann Trend Indikator), Anleitung oder Fragen! - Nicht nachgemalt, keine Verzögerung - Ich verkaufe nur meine Produkte in Elif Kaya Profil, alle anderen Websites sind gestohlenen alten Versionen, also keine neuen Updates oder Unterstützung. - Lifetime Update kostenlos Gann Gold EA MT5 Einführung Die Theorien von W.D. Gann zur technischen Analyse faszinieren Trader se

NUR FÜR CRASH 500!! MT5
*Dies ist ein glattes Heiken-Ashi-Setup, das für den CRASH 500 in Kombination mit anderen Indikatoren verwendet werden soll. *Sie sind herzlich eingeladen, es auch auf anderen Märkten zu testen. *Ich werde auch andere Indikatoren veröffentlichen, die beim Handel mit dem Crash 500 Markt helfen. *Sie können diesen Indikator verwenden, um die Preise zu glätten, wenn Sie Probleme mit dem Lesen der Charts haben. * Bitte beachten Sie, dass Heiken Ashi nicht die tatsächliche Pr
FREE

Dieser Indikator ermöglicht die Anzeige von Renko-Charts im Indikatorfenster. Renko-Charts zeigen nur Kursbewegungen an, die größer als die angegebene Boxgröße sind. Dies hilft, Rauschen zu eliminieren und ermöglicht es, sich auf die wichtigsten Trends zu konzentrieren.
Die Zeit spielt hier keine Rolle. Es werden nur Preisbewegungen berücksichtigt. Aus diesem Grund ist der Renko-Chart nicht mit dem Hauptchart synchronisiert, an den er angehängt ist. Der Indikator arbeitet in zwei Modi: CLOSE -
FREE
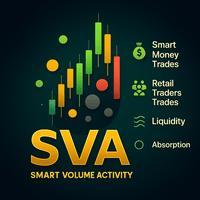
Smart Volume Activity [SVA] ist ein fortschrittlicher analytischer Indikator, der für MetaTrader-Plattformen entwickelt wurde. Er zeigt auf, wie institutionelle (Smart Money) und private Händler agieren, indem er das Volumenverhalten über mehrere Zeitrahmen hinweg analysiert. Im Gegensatz zu gewöhnlichen Volumen-Tools passt sich SVA automatisch an jeden Chart-Zeitrahmen an und hebt Zonen der Absorption hervor - Momente, in denen große Marktteilnehmer Liquidität aus schwächeren Händen absorbieren

Eine ICT-Fair-Value-Lücke ist ein Handelskonzept, das Marktungleichgewichte auf der Grundlage einer Drei-Kerzen-Sequenz identifiziert. Die mittlere Kerze hat einen großen Körper, während die benachbarten Kerzen obere und untere Dochte haben, die sich nicht mit der mittleren Kerze überschneiden. Diese Formation deutet auf ein Ungleichgewicht hin, bei dem die Kauf- und Verkaufskräfte nicht ausgeglichen sind. Einstellungen Mindestgröße des FVG (Pips) -> FVGs, die kleiner als die angegebenen Pips s
FREE

VISUAL ATR CANDLESTICK SCANNER PRO - Erweiterte Mustererkennung Der Visual ATR Candlestick Scanner Pro ist ein Indikator, der entwickelt wurde, um gängige Kerzenmuster automatisch zu identifizieren und zu filtern, wodurch eine klarere Sicht auf potenzielle Marktumkehrungen oder -fortsetzungen geboten wird. I. Hauptmerkmale und Funktionalität 1. Automatisierte Kerzenmustererkennung Der Indikator erkennt automatisch über 25 professionelle Kerzenmuster, die in klare Gruppen eingeteilt sind: Starke

Der KT HalfTrend ist ein trendbasierter Indikator auf Basis von gleitenden Durchschnitten, der Zonen auf dem Chart einzeichnet. Er erkennt Trendwechsel, indem er bullische und bärische Ungültigkeitszonen darstellt. Zusätzlich zeigt er die Stärke von Kauf- und Verkaufssignalen mit Pfeilen direkt im Hauptchart an. Wenn kein Trend vorliegt, ist der Indikator flach – dies deutet auf Akkumulation, Preisverlagerung oder Verteilungszonen hin. Bei Vorhandensein eines Trends neigt sich der Indikator ents
Wir präsentieren Ihnen einen revolutionären Indikator, der die Spielregeln in der Welt des Trendhandels ändert. Der Indikator wurde entwickelt, um die Leistung zu überdenken und Ihr Handelserlebnis auf eine beispiellose Höhe zu heben. Unser Indikator verfügt über eine einzigartige Kombination fortschrittlicher Funktionen, die ihn von der Konkurrenz unterscheiden. Die fortschrittliche Technologie von "Real Pricing Factors" bietet selbst unter den schwierigsten und volatilsten Marktbedingungen unü

Wir stellen vor Quantum Breakout PRO , der bahnbrechende MQL5-Indikator, der die Art und Weise, wie Sie mit Breakout-Zonen handeln, verändert! Entwickelt von einem Team erfahrener Händler mit über 13 Jahren Handelserfahrung, Quantum Breakout PRO ist darauf ausgelegt, Ihre Handelsreise mit seiner innovativen und dynamischen Breakout-Zone-Strategie auf ein neues Niveau zu heben.
Der Quantum Breakout Indicator zeigt Ihnen Signalpfeile auf Breakout-Zonen mit 5 Gewinnzielzonen u
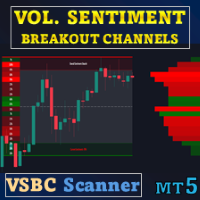
Sonderangebot : ALL TOOLS , nur $35 pro Stück! Neue Tools kosten $30 während der ersten Woche oder für die ersten 3 Käufe ! Trading Tools Channel on MQL5 : Treten Sie meinem MQL5-Kanal bei, um die neuesten Neuigkeiten von mir zu erhalten Volume Sentiment Breakout Channels ist ein Indikator, der Ausbruchsbereiche anhand des Volumensentiments innerhalb dynamischer Preiskanäle visualisiert. Anstatt einen Ausbruch nur als ein rein technisches Preisereignis zu betrachten, konzentriert

Das Forex Master Pattern ist eine alternative Form der technischen Analyse, die einen Rahmen bietet, der Ihnen hilft, die verborgenen Kursmuster zu finden und zu verfolgen, die die wahren Absichten der Finanzmärkte offenbaren. Dieser Algorithmus hier leistet gute Arbeit bei der Erkennung der Phase 1 des Forex Master Pattern-Zyklus, die der Kontraktionspunkt (oder Wert) ist.
In Phase 2 wird ein höherer Zeitrahmen aktiviert (auch Expansion genannt), in dem der Preis über und unter dem in Phase 1
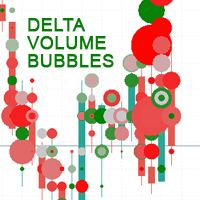
Delta Volume Bubbles ist ein fortschrittlicher Indikator für MetaTrader 5, der den Kauf- und Verkaufsdruck auf dem Markt klar und intuitiv anzeigt. Durch farbige und dynamische Blasen zeigt er die Differenz zwischen Kauf- und Verkaufsvolumen (Delta Volume) in Echtzeit an und hilft dem Händler, Bereiche mit starkem Ungleichgewicht zwischen Angebot und Nachfrage zu identifizieren. Der Indikator stellt eine visuelle Form des Auftragsflusses dar und vereinfacht die volumetrische Analyse auch für die
FREE

Dieser Indikator ist speziell für den Boom 1000 Index entwickelt worden. Der Indikator enthält optimierte Trendfilter, um Kaufspitzen in einem Aufwärtstrend zu erkennen. Der Indikator fügt außerdem ein Raster-Kaufsignal hinzu, um einen Teil des Verlustes des ersten Kaufsignals wieder aufzuholen. Der Indikator liefert auch Ausstiegssignale für verzögerte Spikes, die beim Risikomanagement helfen können, analysiert Signale für historische Daten und zeigt den Prozentsatz der guten Signale an, die d
FREE

Neural-Link Engine: Leistungsstarke Musterprojektion für MetaTrader 5 Die Neural-Link Engine ist ein fortschrittlicher technischer Indikator, der für die MetaTrader 5-Plattform entwickelt wurde und die Erkennung historischer Muster nutzt, um zukünftige Kursbewegungen zu prognostizieren. Im Gegensatz zu herkömmlichen nachlaufenden Indikatoren verwendet dieses System einen von K-Nearest Neighbors (k-NN) inspirierten Ansatz, um mathematische Ähnlichkeiten in der Marktstruktur zu erkennen und einen
FREE

Die SuperTrend-Strategie ist ein weit verbreiteter technischer Indikator, der auf der Average True Range (ATR) basiert und in erster Linie als Trailing-Stop-Instrument zur Erkennung vorherrschender Markttrends eingesetzt wird. Der Indikator ist so konzipiert, dass er einfach zu handhaben ist und gleichzeitig einen zuverlässigen Einblick in den aktuellen Markttrend bietet. Er funktioniert auf der Grundlage von zwei Schlüsselparametern: der Periode und dem Multiplikator . Standardmäßig wird für di
FREE

Die Anchored VWAP Bands sind ein hochpräzises Werkzeug, das es ermöglicht, den volumengewichteten Durchschnittspreis (VWAP) von jedem beliebigen Punkt im Chart aus zu berechnen. Dies geschieht über eine dynamische Point-and-Click-Verankerungslogik . Der Vorteil: Präzisionsverankerung (Click-Point Detection) Im Gegensatz zu Standard-VWAPs erkennt dieser Indikator exakt, an welcher Stelle der Kerze (Candle) Sie klicken, um die Basis für die Preisberechnung festzulegen: Klick auf das obere Ende (HI
FREE
ICONIC REVERSAL PATTERN - Die Konfluenz-Engine Ein professioneller Umkehr-Indikator, der nicht nur Muster erkennt, sondern die Qualität eines Setups mit einem intelligenten 0-100 Konfidenz-Score bewertet. Hören Sie auf zu raten, fangen Sie an zu bewerten. Übersicht Haben Sie genug von Indikatoren, die Sie mit hunderten von schwachen und oft falschen Signalen bombardieren? Der ICONIC REVERSAL PATTERN wurde entwickelt, um dieses Problem an der Wurzel zu packen. Er basiert auf einem einzigen Prinz
FREE

Der Indikator zeichnet Angebots- und Nachfragezonen. Der Zeitrahmen der Zonen kann unabhängig vom Zeitrahmen des Charts festgelegt werden. So ist es beispielsweise möglich, M5-Zonen auf einem H4-Chart festzulegen. Die Bedeutung der Zonen kann mit dem Parameter Zonenstärke angepasst werden. Nachfragezonen werden angezeigt, wenn mindestens eine Kerze im Bereich der Zone vollständig oberhalb der Zone liegt. Ebenso werden Angebotszonen angezeigt, wenn mindestens eine Kerze innerhalb der Zone vollstä
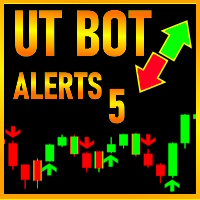
Der gute alte UT BOT wurde von 'QuantNomad ' aus dem TradingView-Skript konvertiert, ursprünglich von 'Yo_adriiiiaan ' und 'HPotter ' - Sie können also darauf wetten, dass dies ein leistungsfähiges Tool ist. Wenn Sie es kennen, wissen Sie es. Dies ist das Beste vom Besten, während es wirklich einfach gehalten ist.
Hauptfunktion: Trendidentifikation mit Trendwechselpunkten , die durch EMA(Quelle) und ATR gebildet werden -Quelle ist der CLOSE PRICE mit der Option, stattdessen den HEIKEN ASHI-Cha

Der Indikator ist für die einfache Konstruktion von synthetischen Charts auf der Grundlage von Daten verschiedener Finanzinstrumente konzipiert. Er ist sowohl für den Arbitrage- und Paarhandel als auch für Analysezwecke nützlich. Sein Hauptvorteil ist die Einfachheit und Klarheit. Jedes Diagramm wird in Form einer gemeinsamen mathematischen Formel dargestellt. Wenn Sie beispielsweise den Spread (Unterschied) zwischen EURUSD und GBPUSD mit den Koeffizienten 4 und 3 darstellen möchten, geben Sie d

Der Weis Wave Scouter Basic ist die essenzielle Version unseres renommierten Indikators für MetaTrader 5, entwickelt für Trader, die die Konzepte der Wyckoff-Methode und der VSA-Analyse (Volume Spread Analysis) auf zugängliche und effiziente Weise erkunden möchten. Basierend auf der Analyse von Volumenwellen ermöglicht dieser vereinfachte Indikator eine klare Erkennung von Marktbewegungen, wobei der Schwerpunkt auf den Prinzipien Aufwand vs Ergebnis sowie Angebot und Nachfrage liegt, wie von Ric
FREE

Entdecken Sie die "Agulhadas"-Strategie Diese Strategie ist inspiriert von beliebten Konzepten des brasilianischen Marktes und kombiniert fünf technische Indikatoren, um potenzielle Ein- und Ausstiegspunkte basierend auf Trend, Marktkraft und Momentum zu identifizieren. Einer der verwendeten Indikatoren ist der berühmte Didi-Index, entwickelt von Odair Aguiar, bekannt für die Darstellung von gleitenden Durchschnittskreuzungen. Hier Aktien-Scanner herunterladen Verwendete Indikatoren Didi-Index A
FREE
Der Pin Bar Tracker ist ein Indikator, der entwickelt wurde, um Muster von Pin Bars in Devisencharts, Gold und Bitcoin in jeder Zeitspanne zu finden. Er enthält ein Tool, das automatisch das Risiko-Ertrags-Verhältnis, die Losgröße und die möglichen Stop-Loss- und Take-Profit-Punkte berechnet. Eigenschaften: - Funktioniert in jeder Zeitspanne - Berechnet Losgrößen automatisch - Zeigt Stop-Loss - und Take-Profit-Niveaus an - Sendet eine Benachrichtigung wenn ein Pin Bar erkannt wird.
FREE

Modified oscillator MACD. A classic indicator that combines a trend indicator with an oscillator to detect entry points. Has a multi-timeframe panel and 3 types of notifications
Benefits:
Works on all instruments and timeseries Trend indicator with oscillator for inputs Multi-period panel on all timeframes Pluggable arrows when signals appear Three types of notifications: push, email, alert
MT4 version -> HERE / Our news -> HERE
How the indicator works:
AW Classic MACD - Indicator o
FREE

Ein Indikator für die Erkennung von FVGS
Ich hoffe, dies hilft Ihnen skalpieren und generieren Geld für sich
HINWEIS BESSER:
Trading ist riskant und Sie können alle Ihre Mittel zu verlieren, verwenden Sie das Geld, das Sie bereit sind zu verlieren
HINWEIS BESSER:
Trading ist riskant und Sie können alle Ihre Mittel zu verlieren, verwenden Sie das Geld, das Sie bereit sind zu verlieren
HINWEIS BESSER:
Trading ist riskant und Sie können alle Ihre Mittel zu verlieren, verwenden Sie das Geld
FREE

OBV MACD
Berechnung des MACD auf der Grundlage von OBV-Daten Merkmale
3 Ausgaben: MACD & Signal & Histogramm 4 farbige Histogramme Glättungsfaktor Option zum Ein- und Ausblenden von MACD- und Signallinien Beschreibung
Unter den wenigen Indikatoren, die für die Arbeit mit Volumendaten entwickelt wurden, ist OBV (On Balance Volume) der einfachste, aber informativste. Seine Logik ist einfach: Wenn der Schlusskurs über dem vorherigen Schlusskurs liegt, wird das heutige Volumen zum vorherigen OBV add
FREE
Hallo Leute, das ist The Rangers Fx Es ist uns gelungen, einen Indikator zum Erkennen von Spitzen beim Boom 1000-Index, Boom 500-Index und Boom 300-Index zu erstellen. Tatsächlich gilt dieser Indikator für alle verfügbaren Booms und die anderen, die noch in der Zukunft kommen. So verwenden Sie diesen Indikator Als Erstes müssen Sie Ihren Zeitrahmen auf den Zeitrahmen M1/M5 umstellen. Dieser Indikator sendet Ihnen eine Benachrichtigung darüber, wann Sie Ihre Kaufgeschäfte tätigen und wann Sie Ihr

Der Multi Pairs Forex Indicator ist ein fortschrittliches Handelsinstrument , das es Händlern ermöglicht, die Performance mehrerer Währungspaare in Echtzeit auf einem einzigen Chart zu verfolgen und zu analysieren. Der Multi Pairs Forex Indicator konsolidiert die Daten verschiedener Devisenpaare und bietet so einen Überblick über die Marktbedingungen verschiedener Währungen und hilft Ihnen, Zeit zu sparen. Nützlich für verschiedene Handelsstile, einschließlich Scalping, Day Trading und Swing Tr

Candle Counter ist ein Indikator, der die Anzahl der Kerzen ab der ersten Kerze des Tages druckt. Die erste Kerze des Tages ist die Nummer 1 und jede neue Kerze wird in dieser Zählung um 1 erhöht.
Eingabeparameter Wählen Sie aus gerade, ungerade oder alle Entfernung von Kerze zum Drucken der Zahl Schriftgröße des Textes Schriftfarbe des Textes
Wenn Sie noch Fragen haben, kontaktieren Sie mich bitte per Direktnachricht: https://www.mql5.com/de/users/robsjunqueira/
FREE

Multicurrency und Multitimeframe Modifikation des Indikators Bollinger Bands. Auf dem Dashboard können Sie Ausbrüche und Berührungen der Bollinger Bänder sehen. In den Parametern können Sie alle gewünschten Währungen und Zeitrahmen angeben. Der Indikator kann auch Benachrichtigungen senden, wenn der Preis die Bollinger Bänder berührt, wenn sich die aktuelle Volatilität ändert (steigt oder fällt) und wenn der Preis alle Bänder berührt. Wenn Sie auf eine Zelle mit einer Periode klicken, werden di

Smart Money Struktur- & Präzisionshandelsindikator (MT5) Der Smart Money Structure & Precision Trading Indicator ist ein leistungsstarker Smart Money Concepts (SMC) Indikator für MetaTrader 5, der Händlern hilft, mit institutioneller Logik hochwahrscheinliche Einstiegsmöglichkeiten zu identifizieren . Dieser Indikator erkennt automatisch die Marktstruktur in Echtzeit , hebt die wichtigsten Liquiditätsniveaus hervor und liefert klare, sich nicht wiederholende Signale , damit Sie mit Zuversicht un
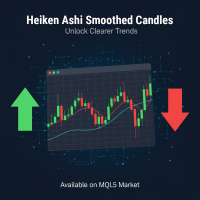
Heiken Ashi Smoothed Indikator für MT5 Fortgeschrittener Heiken Ashi mit Glättungsfilter. Reduziert Rauschen, falsche Signale und erkennt Trends früh. Ideal für Forex, Indizes und Krypto (H1-D1). Funktionsweise und Glättung Der traditionelle Heiken Ashi berechnet Kerzen durch Mittelung von Open, Close, High und Low aus vorherigen Perioden, was bereits den Einfluss kleiner Schwankungen reduziert. Der Heiken Ashi Smoothed geht jedoch weiter und wendet einen zusätzlichen Glättungsfilter auf die "ra
FREE

Das Hydra Multi Trend Dashboard ist ein leistungsstarkes Markt-Scanning-Tool für MetaTrader 4 und MetaTrader 5. Es überwacht bis zu 25 Währungspaare oder Vermögenswerte gleichzeitig über alle 9 Standard-Zeitrahmen (M1 bis monatlich). Mithilfe einer speziellen Trendformel filtert das Dashboard Marktgeräusche heraus und liefert klare, visuelle Bullish- oder Bearish-Signale, die es Händlern ermöglichen, Trendausrichtungen auf einen Blick zu erkennen, ohne die Charts zu wechseln. Einrichtung & Anle
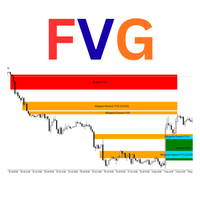
Luta FVG Pro - Professioneller Fair Value Gap (FVG) Indikator
Erkennt institutionelle Fair Value Gaps auf dem H4-Zeitrahmen auf die gleiche Weise wie ICT/SMC-Händler.
Merkmale: - Bullish & Bearish FVG-Erkennung in Echtzeit - Automatische Mitigation-Verfolgung - Umgekehrte FVG-Signale (sehr leistungsfähige Umkehr-Setups) - "GOOD" FVG Markierung (Lücken ≥ 2× Mindestgröße - höhere Wahrscheinlichkeit) - Saubere Rechtecke mit intelligenten Beschriftungen (Bullish FVG / Mitigated / Inverted) - Über
FREE

MA3 Trend MT5 - ist der gute Trendindikator auf drei MAs . Vorteile des Indikators: Der Indikator erzeugt Signale mit hoher Genauigkeit.
Das bestätigte Signal des Indikators verschwindet nicht und wird nicht neu gezeichnet.
Sie können auf der MetaTrader 5 Handelsplattform eines beliebigen Brokers handeln.
Sie können mit beliebigen Vermögenswerten handeln (Währungen, Metalle, Kryptowährungen, Aktien, Indizes usw.).
Sie können auf beliebigen Zeitrahmen handeln (M5-M15 Scalping und Daytrading /
FREE
Warum funktionieren technische Indikatoren nicht?
Viele Händler verlieren Geld wegen nachlaufender Indikatorüberkreuzungen und falscher Ausbrüche. Indikatoren sind Rückspiegel. Sie sind alle nur hübsche mathematische Gleichungen von VERGANGENEN Daten. Würden Sie vorwärts fahren, während Sie in Ihren Rückspiegel starren? Auf keinen Fall. Der "Heilige Gral" unter den Indikatoren existiert nicht. Price Action Decoding: Wie intelligentes Geld WIRKLICH handelt?
Der Markt interessiert sich nicht für

Ich empfehle Ihnen, den Blog des Produkts (Handbuch) von Anfang bis Ende zu lesen , damit von Anfang an klar ist, was der Indikator bietet . Dieser Multi-Zeitrahmen- und Multisymbol-Indikator identifiziert doppelte oder dreifache Top/Bottom-Formationen oder einen folgenden Ausbruch aus der Nackenlinie (bestätigtes Top/Bottom). Er bietet RSI-, Pin-Bar-, Engulfing-, Tweezer-, Morning/Evening Star- sowie Divergenz-Filteroptionen, die es ermöglichen, nur die stärksten Setups herauszufiltern. Der In

Crypto_Forex-Indikator „Glattes Trendhistogramm“ für MT5, kein Neuzeichnen.
- Der Indikator „Glattes Trendhistogramm“ ist viel effizienter als jedes Standardkreuz von gleitenden Durchschnitten. - Er ist besonders auf die Erkennung großer Trends ausgerichtet. - Der Indikator hat 2 Farben: Rot für einen bärischen Abwärtstrend und Grün für einen bullischen Aufwärtstrend (Farben können in den Einstellungen geändert werden). - Mit Alarmen für Mobilgeräte und PCs. - Es ist eine großartige Idee, dies

Der Order Block Indikator für MT5 ist ein leistungsstarkes Tool für Trader, die mit Smart Money Konzepten und institutionellen Handelsstrategien arbeiten. Er erkennt automatisch die wichtigsten Orderblöcke auf dem Chart und hilft, hochwahrscheinliche Umkehr- und Fortsetzungszonen zu identifizieren.
Hauptmerkmale: • Automatische Erkennung von Orderblöcken – Markiert starke Kauf- und Verkaufszonen basierend auf Preisbewegung und Volumen. • Multi-Timeframe-Unterstützung – Analysie
FREE

Indikator-Leitfaden: Wichtige Kursniveaus & Strukturverschiebungen 1. Beschreibung Der Indikator ist ein technisches Analyseinstrument für die MetaTrader 5 Plattform. Er wurde entwickelt, um bestimmte Kursbewegungen automatisch zu erkennen und die entsprechenden Kurszonen auf der Grundlage der vorangegangenen Kursbewegung hervorzuheben. Dies ermöglicht eine Visualisierung der wichtigsten Kursbereiche gemäß der internen Logik des Indikators. 2. Visuelle Elemente und ihre Identifizierung Der Indik
FREE
Sigma Indikator wird von Sigma Expert Advisor für die Darstellung der Zonen verwendet, aber jetzt ist es für Mitglieder verfügbar, um ihre Strategien auf Sigma Angebot und Nachfrage Ebenen anzuwenden.
Anweisungen:
1- Ändern Sie nicht Zeitrahmen stattdessen laufen mehrere Paare mit verschiedenen Zeitrahmen mit Sigma Indikator 2- Für exness: Suche nach kleinerer Zone = True
Für andere Broker: Keep it False
3- Maximale Zonengröße = 0
4- Minimale Zonengröße = 0
5 - Back candles = 300

Vorstellung von Koala FVG für MT5: Ihr professioneller Fair Value Gap (FVG) Pattern Indikator. Koala FVG: Ihr Weg zu präzisem Trading auf MT5 Entdecken Sie die Kraft des Fair Value Gap (FVG) Patterns mit Koala FVG – einem hochmodernen Indikator, entwickelt für MetaTrader 5. Für eine begrenzte Zeit haben Sie kostenlosen Zugang zu diesem professionellen Tool, bevor es zu einem Premium-Indikator wird. Hauptmerkmale: FVG Pattern Erkennung: Koala FVG identifiziert intelligent qualifizierte FVG Patter
FREE

Mehrwährungs- und Mehrzeitrahmen-Indikator Inside Bar (IB). In den Parametern können Sie alle gewünschten Währungen und Zeitrahmen angeben. Das Panel zeigt das zuletzt gefundene Inside Bar (und Mother Bar) Muster, die aktuelle Preisposition und den Durchbruch der Levels der Mother und Inside Bars an. Sie können die Größe und Farbe der Balken und des Textes in den Zellen einstellen. Der Indikator kann auch Benachrichtigungen senden, wenn Niveaus durchbrochen werden. Das Dashboard hebt Double Ins

Ein professionelles Werkzeug für den Handel - der Divergenzindikator zwischen dem RSI und dem Kurs, der es Ihnen ermöglicht, rechtzeitig ein Signal über eine Trendumkehr zu erhalten oder Kursrücksetzer abzufangen (abhängig von den Einstellungen). Die Einstellungen des Indikators erlauben es Ihnen, die Stärke der Divergenz aufgrund des Winkels der RSI-Spitzen und der prozentualen Preisveränderung anzupassen, was eine Feinabstimmung der Signalstärke ermöglicht. Der Code des Indikators ist optimie
FREE

Dies ist ein Indikator für Handelssitzungen , der alle Niveaus (Open-High-Low-Close) für vier Sitzungen anzeigen kann . Der Indikator kann auch Sitzungsniveaus vorhersagen. Die Sessions können mit Linien oder Rechtecken (leer oder gefüllt) gezeichnet werden, die Linien können bis zur nächsten Session verlängert werden. Sie können jede Session einfach durch Drücken von Hotkeys (standardmäßig '1', '2', '3', '4') aus- und einblenden. Sie können ASR-Zeilen (Average Session Range) anzeigen (Standard
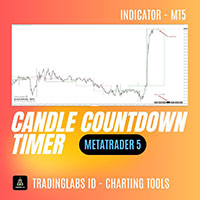
Candle Timer Countdown (CTC) - Minimalistischer & präziser Kerzen-Timer Candle Timer Countdown (CTC) ist ein leichtgewichtiger und nicht aufdringlicher MetaTrader-Indikator, der die verbleibende Zeit der aktuellen Kerze in Ihrem Chart anzeigt. Dieses Tool wurde mit Blick auf Einfachheit und Klarheit entwickelt und hilft Händlern, sich über Kerzenabschlüsse im Klaren zu sein, ohne den Chart zu überladen. Hauptmerkmale: Kerzen-Countdown in Echtzeit
Sie wissen immer, wie viele Sekunden bis zur Schl
FREE
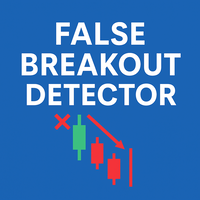
Expert Advisor Version Wenn Sie automatisierten Handel anstelle von manuellen Signalen bevorzugen, finden Sie die Expert Advisor-Version dieses Indikators hier: https://www.mql5.com/en/market/product/148310
False Breakout Detector ist ein Indikator zur Erkennung von Situationen, in denen der Preis kurzzeitig ein kürzliches Unterstützungs- oder Widerstandsniveau durchbricht und dann schnell wieder in die vorherige Spanne zurückkehrt. Solche falschen Ausbrüche sind nützlich für diskretionäre Ana
FREE

NeoBull Predictive Ranges ist ein umfassendes technisches Analysesystem für den MetaTrader 5. Der Indikator kombiniert fortschrittliche Volatilitätsberechnungen mit einer volumenbasierten Trendanalyse. Das Ziel dieses Systems ist es, Tradern präzise Informationen über die Marktstruktur und den Orderflow zu liefern, ohne das Chartbild zu überladen. Dieses professionelle Werkzeug wird der Community kostenlos zur Verfügung gestellt. Konzept und Hintergrund Die strategische Grundlage und die Kombina
FREE

Dies ist eine Ableitung des "TTM Squeeze"-Volatilitätsindikators von John Carter, der in seinem Buch "Mastering the Trade" (Kapitel 11) beschrieben wird.
Der graue Punkt auf der Mittellinie zeigt, dass der Markt gerade in einen Squeeze eingetreten ist (die Bollinger Bänder befinden sich im Keltner-Kanal). Dies bedeutet, dass die Volatilität gering ist und der Markt sich auf eine explosive Bewegung (nach oben oder unten) vorbereitet. Ein blauer Punkt bedeutet "Squeeze Release".
Mr. Carter emp
FREE

AW Super Trend – Dies ist einer der beliebtesten klassischen Trendindikatoren. Es hat eine einfache Einstellung, ermöglicht es Ihnen, nicht nur mit dem Trend zu arbeiten, sondern zeigt auch das Stop-Loss-Level an, das von diesem Indikator berechnet wird. Vorteile:
Instrumente: Währungspaare , Aktien, Rohstoffe, Indizes, Kryptowährungen. Zeitrahmen: М15 und höher. Handelszeit: Rund um die Uhr. Zeigt die Richtung des aktuellen Trends an. Berechnet den Stop-Loss. Es kann bei der Arbeit mi
FREE
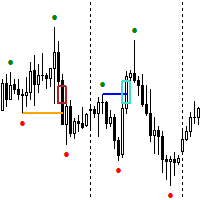
YouTube-Kanal: https: //www.youtube.com/@trenddaytrader FREE EA für GOLD , Anticipation finden Sie hier: https://www.mql5.com/en/market/product/123143
Den Expert Advisor für diesen Indikator finden Sie hier: https: //www.mql5.com/en/market/product/115476 Der Break of Structure (BoS)- und Change of Character-Indikator mit Fair Value Gap (FVG)-Filter ist ein spezielles Tool, das entwickelt wurde, um Handelsstrategien zu verbessern, indem es hochwahrscheinliche Handelsgelegenheiten auf Kurschart
FREE
REVERSAL POWER PRO
Der EINZIGE Indikator, der Ihnen zeigt, wo die Märkte umkehren werden - BEVOR sie sich bewegen
WILLKOMMEN AUF DER NÄCHSTEN STUFE DER HANDELSPRÄZISION
Haben Sie es satt zu raten, wohin der Markt drehen wird ? Verpassen Sie den Einstieg, weil Sie nicht wissen, wo Unterstützung/Widerstand WIRKLICH ist ? Werden Sie bei "falschen" Niveaus ausgestoppt ? Fragen Sie sich, ob Ihr Bias richtig ist, bevor Sie einsteigen?
Was wäre, wenn Sie Folgendes hätten : Kristallklare Angebots-/
FREE

Line Profit Indikator der visuellen Gewinnlinie in der Einzahlungswährung. Funktioniert nur, wenn auf dem Markt offene Positionen für das Symbol vorhanden sind, auf dem der Indikator installiert ist. Sie können die Linie mit der Maus verschieben oder die automatische Verfolgung des Gebotspreises aktivieren. Beschreibung der Anzeigeeinstellungen: colotLine - Linienfarbe WidthLine - Linienbreite colotText - Textfarbe FontSize - die Höhe des Textes Anker - eine Ankermethode für Text FollowBid - F
FREE
Der MetaTrader Market ist eine einzigartige Plattform für den Verkauf von Robotern und technischen Indikatoren.
Das Merkblatt für Nutzer der MQL5.community informiert Sie über weitere Möglichkeiten: nur bei uns können Trader Handelssignale kopieren, Programme bei Freiberuflern bestellen, Zahlungen über das Handelssystem automatisch tätigen sowie das MQL5 Cloud Network nutzen.
Sie verpassen Handelsmöglichkeiten:
- Freie Handelsapplikationen
- Über 8.000 Signale zum Kopieren
- Wirtschaftsnachrichten für die Lage an den Finanzmärkte
Registrierung
Einloggen
Wenn Sie kein Benutzerkonto haben, registrieren Sie sich
Erlauben Sie die Verwendung von Cookies, um sich auf der Website MQL5.com anzumelden.
Bitte aktivieren Sie die notwendige Einstellung in Ihrem Browser, da Sie sich sonst nicht einloggen können.