Indicadores técnicos para MetaTrader 5 - 8
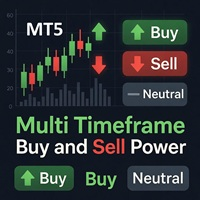
Multi Timeframe Poder de Compra y Venta
El indicador Multi Timeframe Buy and Sell Power para MetaTrader 5 es una herramienta versátil diseñada para proporcionar a los operadores una representación visual clara de la presión del mercado a través de nueve marcos de tiempo estándar, de M1 a MN1. Al agregar los porcentajes de fuerza de compra y venta derivados de la reciente acción del precio y el volumen de ticks, ayuda a identificar posibles tendencias, retrocesos y condiciones neutrales en tiem
FREE

tendencia,análisis de tendencia,señales,alertas,panel de trading,panel visual,contexto de mercado,scalping,intradía,day trading,swing trading,sin repaint,sin repintado,gestión de riesgo,riesgo beneficio,soporte resistencia,zonas de oferta demanda,presión de compra venta,forex,cripto,multitimeframe
QuantumTrade Panel es un indicador avanzado para MetaTrader 5 diseñado para proporcionar un contexto completo del mercado en tiempo real, reuniendo en un solo panel visual información esencial como t
FREE

OBV MACD
Cálculo del MACD basado en datos OBV Características
3 salidas: MACD & Señal & Histograma 4 Histogramas coloreados Factor de suavizado Opción mostrar/ocultar líneas MACD & Señal Descripción
Entre los pocos indicadores desarrollados para trabajar con datos de volumen, el OBV (On Balance Volume) es el más sencillo y a la vez el más informativo. Su lógica es sencilla: cuando el precio de cierre está por encima del cierre anterior, el volumen de hoy se suma al OBV anterior; por el contrario
FREE

Phoenix Auto Fibonacci Monitor (MT5)
Herramienta profesional de inteligencia Fibonacci y análisis de oscilaciones para MetaTrader 5. Detecta automáticamente las oscilaciones dominantes del mercado y ofrece información avanzada sobre los retrocesos de Fibonacci a través de un panel visual en tiempo real.
Descripción general
Phoenix Auto Fibonacci Monitor identifica automáticamente las principales oscilaciones del mercado utilizando pivotes de marcos temporales superiores y validación ATR, y lu
FREE

Order Flow Lite es una utilidad de análisis técnico diseñada para visualizar el Flujo de Órdenes sintético, los Gráficos de Huella y el Análisis de Ticks utilizando datos estándar del broker. Ayuda a los operadores a analizar la lógica Delta y el perfil de volumen basándose en la acción reciente de los precios. Características principales: Huella sintética: Visualiza los datos de volumen de las 3 velas cerradas más recientes, ofreciendo una visión clara del sentimiento inmediato del mercado. De
FREE

Descripción general Este indicador es una versión mejorada del Canal Donchian clásico, ampliada con funciones prácticas para el trading real.
Además de las tres líneas estándar (máxima, mínima y central), el sistema detecta rupturas y las muestra visualmente con flechas en el gráfico, mostrando solo la línea opuesta a la dirección de la tendencia actual para una lectura más clara. El indicador incluye: Señales visuales : flechas de colores en las rupturas Notificaciones automáticas : ventana eme
FREE
El Indicador de Tendencia Omega es una herramienta avanzada que ha sido diseñada específicamente para detectar las tendencias del mercado con antelación, y seguirlas con eficacia. El indicador traza dos líneas. La línea de tendencia principal (más gruesa) representa los supuestos límites inferior o superior de volatilidad de la tendencia actual del mercado. Una ruptura en la Línea de Tendencia principal indica una posible inversión o cambio en el movimiento de la tendencia. La línea de tendencia
FREE

Este es el Delta de Volumen Acumulado (CVD) , es un indicador que calcula los volúmenes largos y cortos trazándolo entonces como una línea en el gráfico, la forma más eficiente de utilizar este indicador es mediante la comparación de la línea CVD con el gráfico actual y mirando a la divergencia entre los dos de ellos, de modo que usted puede identificar fake-outs y liquidty barridos. por ejemplo en la imagen que pongo a continuación se puede ver que el precio ha hecho un mínimo más bajo, pero el
FREE

Beneficios y Uso de la Herramienta de Burbuja de Volumen Esta herramienta, (una de mis favoritas de Algo Alpha, de Tradingview) proporciona un método avanzado de análisis de volumen yendo más allá de los histogramas tradicionales. Aprovecha la normalización estadística (Z-score) en los datos de menor marco temporal para identificar y clasificar los eventos de volumen estadísticamente significativos, visualizando la dinámica entre el "Dinero Inteligente" (institucional) y los participantes "Minor

El precio medio ponderado por volumen es similar a un promedio móvil, excepto que el volumen se incluye para ponderar el precio medio durante un período.
El precio medio ponderado por volumen [VWAP] es una media ponderada dinámica diseñada para reflejar con más precisión el precio medio real de una seguridad en un determinado período. Matemáticamente, el VWAP es la suma del dinero (es decir, Volumen x Precio) transitado dividido por el volumen total en cualquier horizonte de tiempo, normalmen
FREE
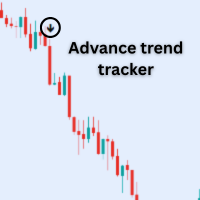
Características : 1. Flechas de compra= cuando se inicia la tendencia alcista. 2.Flechas de venta = cuando se inicia la tendencia a la baja 3.Sistema de Alerta= cuando la señal aparece entonces el propio Mt5 Pop up a alert Box. 4. Puede obtener notificaciones en su teléfono en tiempo real a través de la aplicación Mt5.
Nota: este indicador funcionará en el mercado de tendencia. Así que trate de negociar mercado volátil.
Mejor Par: Sólo operar en la sesión de Nueva York NASDAQ (US100) S&P ( US5
FREE

Modificación multidivisa y multitemporal del Oscilador Estocástico. Puede especificar las monedas y plazos que desee en los parámetros. El panel muestra los valores actuales y las intersecciones de las líneas - Señal y Principal (cruce estocástico). Además, el indicador puede enviar notificaciones cuando se cruzan niveles de sobrecompra y sobreventa. Al hacer clic en una celda con un punto, se abrirá este símbolo y punto. Este es el escáner MTF. De manera similar al medidor de fortaleza de la m

Una brecha de valor razonable TIC es un concepto de negociación que identifica los desequilibrios del mercado basándose en una secuencia de tres velas. La vela central tiene un cuerpo grande, mientras que las velas adyacentes tienen mechas superiores e inferiores que no se solapan con la vela central. Esta formación sugiere que existe un desequilibrio en el que los poderes de compra y venta no son iguales. Ajustes Tamaño mínimo de FVG (pips) -> No se dibujarán FVGs inferiores a los pips indicad
FREE
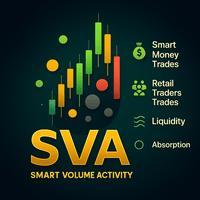
Smart Volume Activity [SVA ] es un indicador analítico avanzado diseñado para las plataformas MetaTrader. Revela cómo operan los operadores institucionales (Smart Money) y minoristas analizando el comportamiento del volumen en múltiples marcos temporales . A diferencia de las herramientas de volumen ordinarias, SVA se adapta automáticamente a cualquier marco temporal del gráfico y destaca las zonas de absorción , momentos en los que los grandes participantes del mercado absorben liquidez de las

Detector de barridos de liquidez institucional y caza de stops El FAKEOUT MATRIX PRO es una herramienta analítica de nivel profesional diseñada para identificar los momentos exactos en los que los operadores institucionales "atrapan" a los operadores minoristas. Mediante el seguimiento de los extremos de la sesión y la detección de barridos de liquidez de alta probabilidad, este indicador proporciona la ventaja técnica necesaria para negociar retrocesos con precisión. La lógica institucional Las
FREE

VISUAL ATR CANDLESTICK SCANNER PRO - Reconocimiento de Patrones Mejorado El Visual ATR Candlestick Scanner Pro es un indicador diseñado para identificar y filtrar automáticamente patrones de velas comunes, proporcionando una visión más clara de posibles reversiones o continuaciones del mercado. I. Características Clave y Funcionalidad 1. Reconocimiento Automatizado de Patrones de Velas El indicador reconoce automáticamente más de 25 patrones de velas profesionales, clasificados en grupos claros

Cybertrade Auto Fibonacci retracción y proyección - MT5
Auto Fibonacci es un indicador que traza automáticamente el retroceso y la proyección de Fibonacci en función del número de barras que seleccione en la configuración del indicador. Puede personalizar nueve niveles diferentes de retracción y tres niveles de proyección. Funciona en periodos más largos que el periodo visible en el gráfico. Todos los valores están disponibles en forma de buffers para simplificar posibles automatizaciones. Este
FREE

KT HalfTrend es un indicador de tendencia basado en medias móviles que dibuja zonas en el gráfico. Detecta un cambio de tendencia marcando zonas de invalidación alcista y bajista. También muestra la fuerza de compra y venta mediante flechas en el gráfico principal. Cuando no hay una tendencia clara, el indicador se muestra plano, lo cual puede indicar acumulación, distribución o consolidación temporal. Si existe una tendencia, el indicador tendrá una pendiente en esa dirección. Cuanto más inclin

Antes: $69 Ahora: $49 Blahtech VWAP - Precio medio ponderado por volumen (VWAP) es la relación entre el precio y el volumen total. Proporciona un precio medio en un intervalo de tiempo especificado. Enlaces [ Instalar | Actualizar | Documentación ] Características destacadas
Línea VWAP configurable Sesiones, intervalos, anclado o continuo Línea de liquidación del día anterior Bandas de desviación estándar Alertas al cierre de barra o en tiempo real Volúmenes automáticos de Broker o Tick Uso de

El Forex Master Pattern es una forma alternativa de análisis técnico que proporciona un marco que le ayudará a encontrar y seguir el patrón de precios oculto que revela las verdaderas intenciones de los mercados financieros. Este algoritmo aquí hace un buen trabajo detectando la Fase 1 del ciclo del Forex Master Pattern, que es el punto de contracción (o Valor).
En la Fase 2 obtenemos una activación del marco temporal superior (también llamada Expansión), que es donde el precio oscila por enci

Marca de agua centralizada
Agrega una marca de agua centrada con el nombre del activo y el período elegido.
Es posible anular el tipo de fuente, el tamaño de fuente, el color de fuente y el carácter separador.
La marca de agua se coloca detrás de las velas, sin perturbar la visualización.
Tiene centrado automático si se cambia el tamaño de la ventana.
Espero que este indicador te ayude, buen trading ;)
FREE

AW Super Trend: este es uno de los indicadores de tendencia clásicos más populares. Tiene una configuración simple, le permite trabajar no solo con la tendencia, sino que también muestra el nivel de stop loss, que se calcula mediante este indicador. Beneficios:
Instrumentos: Pares de divisas , acciones, materias primas, índices, criptomonedas. Marco de tiempo: М15 y superior. Horario de negociación: todo el día. Muestra la dirección de la tendencia actual. Calcula el stop loss. Se puede util
FREE

Position Size Calculator PRO MT5 (v2.20) Position Size Calculator PRO es una herramienta profesional de gestión de riesgos para MetaTrader 5 que calcula el tamaño de lote recomendado en función de su riesgo por operación, la distancia del Stop Loss y las especificaciones del símbolo (valor del tick, tamaño del tick, volumen mín/máx/paso, margen). Sin operaciones comerciales: este indicador no abre ni cierra órdenes y no gestiona posiciones. Es una herramienta de apoyo a la decisión para estandar

Indicador fantasma de superposición Renko Visión general El indicador superpuesto Ghost Renko muestra ladrillos Renko directamente en el gráfico de precios principal como una superposición semitransparente.
A diferencia de los gráficos Renko tradicionales que requieren una ventana sin conexión separada, este indicador permite a los operadores ver la acción del precio de las velas estándar y la estructura Renko simultáneamente en el mismo gráfico. La superposición ayuda a identificar la dirección
FREE
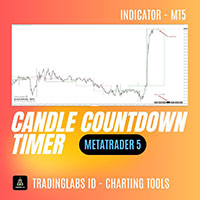
Cuenta atrás con temporizador para velas (CTC) - Temporizador para velas minimalista y preciso Candle Timer Countdown (CTC) es un indicador de MetaTrader ligero y no intrusivo que muestra el tiempo restante de la vela actual en su gráfico. Diseñado con la simplicidad y la claridad en mente, esta herramienta ayuda a los operadores a mantenerse al tanto de los cierres de las velas sin saturar el gráfico. Características principales: Cuenta atrás de velas en tiempo real
Sepa siempre cuántos segundo
FREE

MA3 Trend MT5 - es el buen indicador de tendencia en tres MAs . Ventajas del indicador: El indicador produce señales con alta precisión.
La señal confirmada del indicador no desaparece y no se vuelve a dibujar.
Puede operar en la plataforma comercial MetaTrader 5 de cualquier broker.
Puede operar con cualquier activo (divisas, metales, criptodivisas, acciones, índices, etc.).
Puede operar en cualquier marco temporal (M5-M15 scalping y day trading / M30-H1 medium-term trading / H4-D1 long-ter
FREE

Comprender los niveles del día o de la semana anterior es una información muy importante para sus operaciones.
Este indicador permite extraer Máximo/Mínimo del día anterior Máximo/Mínimo de la semana anterior
Congifuración Máximo y mínimo para: Día anterior, semana Estilo de línea, color Posición de la etiqueta, tamaño, color Cualquier pregunta o comentario, envíeme un mensaje directo aquí https://www.mql5.com/en/users/mvonline
FREE

El indicador dibuja zonas de oferta y demanda. El marco temporal de la zona puede establecerse independientemente del marco temporal del gráfico. Por ejemplo, es posible establecer zonas M5 en un gráfico H4. La importancia de las zonas puede ajustarse utilizando el parámetro de fuerza de la zona. Las zonas de demanda se muestran si al menos una vela en el rango de la zona está completamente por encima de la zona. Del mismo modo, las zonas de oferta se muestran si al menos una vela dentro de la z
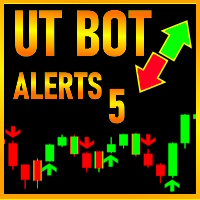
El viejo UT BOT convertido del script TradingView por 'QuantNomad ', inicialmente por 'Yo_adriiiiaan '. y 'HPotter ' - así que usted puede apostar que esta es una herramienta poderosa. Si usted sabe, usted sabe. Esta es la parte superior de la línea, mientras que mantenerlo muy simple.
Función principal: identificación de tendencia con puntos de cambio de tendencia , creados por EMA(fuente) y ATR -La fuente es el PRECIO DE CIERRE con la opción de utilizar el gráfico HEIKEN ASHI en su lugar, pa

El indicador está diseñado para construir fácilmente gráficos sintéticos basados en datos de diversos instrumentos financieros. Será útil tanto para operaciones de arbitraje y de pares, como para fines de análisis. Su principal ventaja es la sencillez y claridad. Cada gráfico se presenta como una fórmula matemática común. Por ejemplo, si desea trazar el spread (diferencia) entre EURUSD y GBPUSD con coeficientes 4 y 3, entonces establezca la siguiente fórmula: EURUSD * 4 - GBPUSD * 3 El gráfico r

Ichimoku Trend Alert es el indicador Ichimoku Kinko Hyo con Alertas y filtros de señal.
Características de Ichimoku Trend Alert: Comprobación opcional de la nube Ichimoku, Tenkan sen(Línea de Conversión), Kijun sen(Línea Base), Senkou span A, Senkou span B, y Chikou span relativo al precio, y más. Alertas emergentes, por correo electrónico y por teléfono para los símbolos y plazos seleccionados.
Hay 9 filtros de tendencia Ichimoku clásicos que puede activar/desactivar en la configuración : Ord
FREE

Special offer : ALL TOOLS , just $35 each! New tools will be $30 for the first week or the first 3 purchases ! Trading Tools Channel on MQL5 : Join my MQL5 channel to update the latest news from me ¡Descubre el poder del concepto de Inversion Fair Value Gap (IFVG) de ICT con el Inversion Fair Value Gaps Indicator ! Esta herramienta de última generación lleva los Fair Value Gaps (FVG) al siguiente nivel al identificar y mostrar zonas de FVG invertidas, que son áreas clave de soporte

Hola chicos, soy The Rangers Fx. Logramos crear un indicador para detectar picos en el índice Boom 1000, el índice Boom 500 y el índice Boom 300; de hecho, estas palabras indicadoras se refieren a todos los Booms que están disponibles y los otros que aún están por llegar en el futuro. Cómo utilizar este indicador En primer lugar, debe cambiar su marco de tiempo al marco de tiempo M1/M5. Este indicador le enviará una alerta sobre cuándo realizar sus operaciones de compra y cuándo salir/cerrar sus

Este es un derivado del indicador de volatilidad "TTM Squeeze" de John Carter, como se discute en su libro "Mastering the Trade" (capítulo 11).
El punto gris en la línea media muestra que el mercado acaba de entrar en un squeeze (las Bandas de Bollinger están dentro del Canal de Keltner). Esto significa baja volatilidad, el mercado se prepara para un movimiento explosivo (hacia arriba o hacia abajo). El punto azul significa "Squeeze release".
Mr.Carter sugiere esperar hasta el primer punto a
FREE

Para acceder a la versión MT4, haga clic en https://www.mql5.com/en/market/product/130055 - Esta es la conversión exacta de TradingView: "Ut Alart Bot Indicador". - Usted puede mensaje en el chat privado para otros cambios que necesita. Aquí está el código fuente de un simple Asesor Experto que opera sobre la base de señales de Ut Bot Indicador . #property copyright "This EA is only education purpose only use it ur own risk" #property link " https://sites.google.com/view/automationfx/home
FREE

Permíteme presentarte el Golden Sniper Indicator , una poderosa herramienta de MQL5 meticulosamente diseñada para traders que buscan mejorar su experiencia de trading. Desarrollado por un equipo de traders experimentados con más de 6 años de experiencia , este indicador ofrece un método confiable para identificar oportunidades de trading con una precisión notable. Características clave : Alertas y flechas de señal : El Golden Sniper Indicator proporciona alertas oportunas y flechas visuales de

Modificación multidivisa y multitemporal del indicador Bandas de Bollinger. En el tablero puedes ver rupturas y toques de las Bandas de Bollinger. En los parámetros puede especificar las monedas y plazos que desee. El indicador también puede enviar notificaciones cuando el precio toca las Bandas de Bollinger, cuando la volatilidad actual cambia (se expande o cae) y cuando el precio toca todas las bandas. Al hacer clic en una celda con un punto, se abrirá este símbolo y punto. Este es el escáner

Oscilador Precio Volumen Tendencia (PVT) Descripción: El Oscilador PVT es un indicador de volumen que sirve como alternativa al Volumen en Balance (OBV) estándar. Mientras que los indicadores de volumen ordinarios pueden ser ruidosos y difíciles de leer, esta herramienta convierte el flujo de volumen en un Oscilador de Histograma claro, similar a un MACD, pero para Volumen. Está diseñado para detectar las primeras Reversiones de Tendencia y Divergencias analizando la diferencia entre una media m
FREE
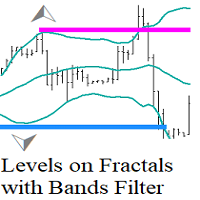
Levels on Fractals with Bands Filter son niveles basados en fractales filtrados con el indicador de Bandas de Bollinger.
Los Niveles sobre Fractales con Filtro de Bandas de Bollinger es una herramienta de análisis técnico que utiliza una combinación de fractales y el indicador de Bandas de Bollinger para identificar niveles de soporte y resistencia.
Cómo utilizarlo.
Cuando un fractal se forma detrás de la banda exterior de Bollinger (ruptura de volatilidad) indica que el precio ha alcanzado
FREE

Una herramienta profesional para el trading: el indicador de divergencia entre el RSI y el precio, que permite recibir a tiempo una señal sobre un cambio de tendencia o captar movimientos de retroceso del precio (en función de la configuración). La configuración del indicador le permite ajustar la fuerza de la divergencia debido al ángulo de los picos del RSI y el cambio porcentual en el precio, lo que hace posible afinar la fuerza de la señal. El código del indicador está optimizado y se prueb
FREE

El Hydra Multi Trend Dashboard es una poderosa herramienta de escaneo de mercado diseñada para MetaTrader 4 y MetaTrader 5. Monitoriza hasta 25 pares de divisas o activos simultáneamente en los 9 marcos temporales estándar (de M1 a Mensual). Utilizando una Fórmula de Tendencia Especial patentada, el panel filtra el ruido del mercado y proporciona señales claras y visuales alcistas o bajistas, permitiendo a los operadores identificar las alineaciones de tendencia de un vistazo sin cambiar de grá

Indicador para negociación manual y análisis técnico de Forex.
Consiste en un indicador de tendencia con el nivel de apertura del día de negociación y un indicador de flecha para determinar los puntos de entrada.
El indicador no cambia de color; funciona cuando se cierra la vela.
Contiene varios tipos de alertas para flechas de señal.
Puede configurarse para funcionar en cualquier gráfico, instrumento comercial o período de tiempo.
La estrategia de trabajo se basa en la búsqueda de movimientos

Este indicador de marco de tiempo múltiple y símbolo múltiple identifica formaciones superiores / inferiores dobles o triples o una ruptura del escote siguiente (superior / inferior confirmada). Ofrece filtros RSI, pin bar, envolvente, pinzas, estrella matutina / vespertina, así como opciones de filtro de divergencia que permiten filtrar solo las configuraciones más fuertes. El indicador también se puede utilizar en modo de gráfico único. Lea más sobre esta opción en el producto blog . Comb

NOTA: Activar Pattern Scan
Este indicador identifica Swing Points, Break of Structure (BoS), Change of Character (CHoCH), patrones de contracción y expansión que se trazan en los gráficos. También viene con alertas y notificaciones móviles para que no se pierda ninguna operación. Se puede utilizar en todos los instrumentos de negociación y en todos los plazos. La característica de no repintar lo hace particularmente útil en backtesting y en el desarrollo de modelos de trading rentables. La prof
FREE
Sigma Indicador es utilizado por Sigma Expert advisor para el trazado de las zonas, pero ahora está disponible para los miembros a aplicar sus stratagies en Sigma niveles de oferta y demanda.
Instrucciones:
1- No cambie los marcos de tiempo en lugar de ejecutar varios pares con diferentes marcos de tiempo con el indicador sigma 2- Para exness : Buscar zona más pequeña = True
Para otros brokers mantenerlo False
3- Tamaño máximo de la zona = 0
4- Tamaño mínimo de la zona = 0
5 - Back candle

Este indicador permite mostrar gráficos Renko en la ventana del indicador. Los gráficos Renko muestran sólo los movimientos de precios que son mayores que el tamaño de caja especificado. Ayuda a eliminar el ruido y permite centrarse en las tendencias principales.
El tiempo no es un factor aquí. Sólo se tienen en cuenta los movimientos de los precios. Por eso el gráfico Renko no está sincronizado con el gráfico principal al que está vinculado. El indicador funciona en dos modos: CLOSE - sólo los
FREE

Modificación multidivisa y multitemporal del indicador ZigZag. Muestra la dirección actual del mercado, la altura del último movimiento, el número de barras de este movimiento y la ruptura del punto anterior del ZigZag (línea horizontal). Este es el escáner MTF.
Puede especifcar las monedas y plazos que desee en los parámetros. Además, el panel puede enviar notificaciones cuando el ZigZag cambia de dirección o cuando se produce un avance en el punto anterior. Al hacer clic en una celda con un

Indicador multidivisa y multitemporal Inside Bar (IB). En los parámetros, puede especificar las monedas y plazos que desee. El panel muestra el último patrón de barra interior (y barra madre) encontrado, la posición actual del precio y la ruptura de los niveles de las barras madre e interior. Puede establecer el tamaño y el color de las barras y el texto de las celdas. El indicador también puede enviar notificaciones cuando se superan los niveles. Al hacer clic en una celda con un punto, se abr

Este es un indicador de sesiones de negociación que puede mostrar todos los niveles (Apertura-Alto-Bajo-Cierre) durante cuatro sesiones. El indicador también puede predecir los niveles de sesión. Las sesiones se pueden dibujar con líneas o rectángulos (vacíos o rellenos), las líneas se pueden extender a la siguiente sesión. Puede ocultar/mostrar fácilmente cada sesión presionando las teclas de acceso rápido (de forma predeterminada, '1', '2', '3', '4').
Puede ver líneas ASR (rango de sesión

Este indicador está diseñado específicamente para el índice boom 1000. El indicador contiene filtros de tendencia optimizados para apuntar a los picos de compra en una tendencia alcista. El indicador también añade una señal de compra de cuadrícula para recuperar parte de la pérdida de la primera señal de compra. El indicador también proporciona señales de salida para los picos retrasados que pueden ayudar con la gestión de riesgos. También analiza las señales de los datos históricos y muestra e
FREE
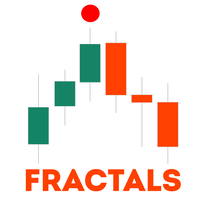
Este indicador está diseñado para mostrar fractales en el gráfico de precios, ayudando a los traders a identificar extremos locales importantes. Los fractales representan puntos especiales en el gráfico que corresponden a la definición clásica: se forma un máximo local si la vela central es más alta que las dos adyacentes a ambos lados, y un mínimo local si la vela central es más baja que las dos adyacentes. Otros productos -> AQUÍ Principales características y ventajas : Visualización flexible
FREE

Canal de regresión lineal Pro La herramienta definitiva para el análisis estadístico de tendencias. Identifica automáticamente el "Valor Justo" de los extremos de precio y volatilidad. Visión general Linear Regression Channel Pro es un indicador de nivel profesional que dibuja y actualiza automáticamente el Canal de Regresión Lineal para la tendencia actual del mercado. A diferencia de los indicadores estándar que se curvan como las Bandas de Bollinger, esta herramienta dibuja canales lineales p
FREE

Candle Counter es un indicador que imprime el número de velas de la primera vela del día. La primera vela del día será la número 1 y cada nueva vela se incrementará en 1 en este recuento.
Parámetros de entrada Elija entre pares, impares o todos Distancia de la vela para imprimir el número Tamaño de fuente de texto Color de fuente de texto
Si aún tiene preguntas, comuníquese conmigo por mensaje directo: https://www.mql5.com/es/users/robsjunqueira/
FREE
El indicador Candle_Timer_and_Spread muestra en un gráfico el tiempo hasta el final de la vela y el porcentaje de cambio de precio junto con el diferencial de los símbolos seleccionados.
El cronómetro del tiempo hasta el final de la vela en el período de tiempo actual y el cambio de precio como porcentaje con respecto al precio de apertura del día se encuentra por defecto en la esquina superior derecha del gráfico. El panel muestra el diferencial y el cambio porcentual del precio actual en rel
FREE

¡COMPRE EL INDICADOR Y OBTENGA UN NUEVO EA EXCLUSIVO GRATIS COMO BONO! INDICADOR FLECHAS ITALO es el mejor indicador de reversión jamás creado, ¿y por qué? El uso de zonas extremas de inversión en el mercado para mostrar las flechas y los números de Fibonacci para la toma de beneficios, también con un panel que muestra toda la información acerca de las señales en el gráfico, el indicador funciona en todos los plazos y los activos, indicador construido después de 8 años de experiencia en forex y
Oferta especial : ALL TOOLS , ¡solo $35 cada uno! Nuevas herramientas costarán $30 durante la primera semana o para las primeras 3 compras ! Canal de Trading Tools en MQL5 : únete a mi canal de MQL5 para recibir mis últimas novedades Zone Shift es una herramienta de identificación de tendencias que utiliza bandas basadas en EMA/HMA para detectar cambios de tendencia y mostrar niveles clave de reacción. Muestra la dirección de la tendencia mediante los colores de las velas y marca l
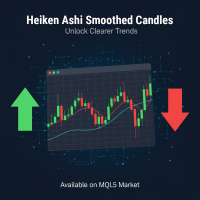
Heiken Ashi Smoothed Indicator para MT5 El Heiken Ashi Smoothed Indicator es una versión avanzada y optimizada del clásico indicador Heiken Ashi, diseñado específicamente para la plataforma MetaTrader 5 (MT5). Este indicador transforma los datos de precios crudos en velas suavizadas que filtran el ruido del mercado, facilitando la identificación precisa de tendencias y reduciendo las señales falsas. Ideal para traders que buscan claridad en entornos volátiles, este herramienta combina la esencia
FREE

El indicador ICT NewYork Open Killzone está diseñado para operadores que siguen los conceptos de Smart Money (SMC) , los modelos de trading ICT y las estrategias basadas en liquidez en el mercado Forex . Esta herramienta marca la zona de cierre de New York Open Killzone , que abarca de 11:00 a 14:00 GMT , un momento crítico en el que el volumen institucional suele provocar movimientos importantes. El indicador destaca rangos de sesión , rangos de creadores de m
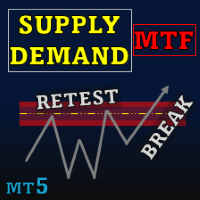
Special offer : ALL TOOLS , just $35 each! New tools will be $30 for the first week or the first 3 purchases ! Trading Tools Channel on MQL5 : Join my MQL5 channel to update the latest news from me Supply Demand Retest and Break Multi Timeframe , esta herramienta traza zonas de oferta y demanda basadas en velas de fuerte momentum, permitiéndole identificar estas zonas en múltiples marcos de tiempo utilizando la función timeframe selector . Con etiquetas de retest y break, junto

Se trata de un simple localizador de bloques de orden. Busca la existencia de bloques de orden sólo en los extremos. Si desea multi criterios de localización de bloques de orden comprobar mi otro indicador que es más potente aquí Estos bloques de orden son bloques de orden de ICT sin ningún buttering.
El indicador puede ser una herramienta útil para detectar reversiones, continuaciones. También puede utilizar el indicador como confluencia con sus otras herramientas
FREE

Verve AI Reversal Pro Indicator Pro es el compañero de trading definitivo para quienes exigen precisión milimétrica y una comprensión sin igual de la dinámica del mercado. Aprovechando el poder de la inteligencia artificial de última generación, esta herramienta sofisticada analiza continuamente la acción del precio, el volumen y la volatilidad para localizar puntos de reversión de alta probabilidad antes de que se manifiesten por completo. Al combinar sin esfuerzo algoritmos de aprendizaje aut

KT OBV Divergence muestra las divergencias regulares y ocultas que se forman entre el precio y el oscilador OBV (On Balance Volume).
Características
Las divergencias no simétricas se descartan para mayor precisión y menos desorden visual. Admite estrategias de trading para reversión de tendencia y continuación de tendencia. Totalmente compatible y listo para integrarse en un Asesor Experto (EA). Se puede utilizar tanto para entradas como para salidas. Incluye todas las alertas disponibles en Me

El indicador traza un canal de tendencia utilizando la técnica de Gilbert Raff. El eje del canal es una regresión de primer orden. Las líneas superior e inferior muestran la distancia máxima a la que la línea Close se ha alejado de la línea del eje. Por lo tanto, las líneas superior e inferior pueden considerarse líneas de resistencia y soporte, respectivamente. Una versión similar del indicador para el terminal MT4
Por regla general, la mayoría de los movimientos del precio se producen dentro
FREE
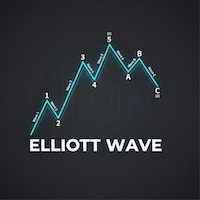
Teoría de Ondas de Elliott Automatizada 1. Conteo automático de ondas y reducción del sesgo (Objetividad) Normalmente, el conteo de Ondas de Elliott implica mucha "imaginación" u opinión personal. Este indicador ayuda al: Encontrar Ondas de Impulso (1-2-3-4-5): Utiliza reglas estrictas (ej. la onda 3 no puede ser la más corta, la onda 4 no debe solaparse con la 1) para mostrar la estructura de precios teóricamente correcta. Encontrar Ondas Correctivas (A-B-C): Ayuda a detectar retrocesos para en

Presentamos Koala FVG para MT5: su indicador profesional de patrones Fair Value Gap (FVG). Koala FVG: Su camino hacia una operativa precisa en MT5 Desbloquee el potencial del patrón Fair Value Gap (FVG) con Koala FVG, un indicador de vanguardia diseñado para MetaTrader 5. Por tiempo limitado, acceda a esta herramienta profesional de forma gratuita antes de que se convierta en un indicador premium. Principales características: Detección de patrones FVG: Koala FVG identifica de manera inteligente
FREE

Desarrollado por smart2trader.com Smart Super Trend es un indicador avanzado de identificación de tendencias diseñado para detectar movimientos alcistas y bajistas del mercado con gran precisión. El indicador Super Trend de Smart utiliza algoritmos adaptativos combinados con filtros de volatilidad , proporcionando señales más limpias y alineadas con la dinámica real de los precios. Además, cuenta con un sistema de monitorización inteligente que le notifica en tiempo real cada vez que se produce
FREE

Esta es la versión suavizada de Heiken Ashi, donde puedes elegir en qué tipo de suavidad quieres basar tu estrategia. Usted puede elegir entre EMA o MA, en el período que desee. Y puedes elegir colores.
Definición:
La técnica Heikin-Ashi promedia los datos de precios para crear un gráfico de velas japonesas que filtra el ruido del mercado. Los gráficos Heikin-Ashi, desarrollados por Munehisa Homma en el siglo XVIII, comparten algunas características con los gráficos de velas estándar, pero dif
FREE

Velocity Renko Heatmap es un indicador de ventana independiente que convierte series de precios estándar basadas en el tiempo en bloques de estilo Renko y los colorea según la velocidad de impulso. Cada bloque representa un tamaño de caja Renko fijo, mientras que la intensidad del color refleja la rapidez con la que se formó el bloque en relación con el tiempo de formación medio reciente. El movimiento lento aparece atenuado/neutro, el movimiento rápido se vuelve más saturado, lo que permite una
FREE

Este panel descubre y muestra las zonas de Oferta y Demanda en el gráfico, tanto en modo scalping como a largo plazo, dependiendo de su estrategia de trading para los símbolos seleccionados. Además, el modo de escáner del tablero le ayuda a comprobar todos los símbolos deseados de un vistazo y no perder ninguna posición adecuada / Versión MT4
Indicador gratuito: Basic Supply Demand
Características Le permite ver las oportunidades de negociación en múltiples pares de divisas ,

VM Breakout BB: Indicador de rompimientos basado en probabilidad con Bandas de Bollinger VM Breakout BB es un indicador de detección de rompimientos que combina Bandas de Bollinger con análisis estadístico de probabilidad (Z-score y la función acumulada de la distribución normal, CDF) y filtros de confirmación inteligentes como RSI, ADX y Volume SMA. El indicador busca ofrecer señales con una base estadística clara, reducir ruido y confirmar rompimientos con mayor probabilidad de éxito. Lógica d
FREE
El Mercado MetaTrader es la única tienda donde se puede descargar la versión demo de un robot comercial y ponerla a prueba, e incluso optimizarla según los datos históricos.
Lea la descripción y los comentarios de los compradores sobre el producto que le interese, descárguelo directamente al terminal y compruebe cómo testar el robot comercial antes de la compra. Sólo con nosotros podrá hacerse una idea sobre el programa, sin pagar por ello.
Está perdiendo oportunidades comerciales:
- Aplicaciones de trading gratuitas
- 8 000+ señales para copiar
- Noticias económicas para analizar los mercados financieros
Registro
Entrada
Si no tiene cuenta de usuario, regístrese
Para iniciar sesión y usar el sitio web MQL5.com es necesario permitir el uso de Сookies.
Por favor, active este ajuste en su navegador, de lo contrario, no podrá iniciar sesión.