YouTubeにあるマーケットチュートリアルビデオをご覧ください
ロボットや指標を購入する
仮想ホスティングで
EAを実行
EAを実行
ロボットや指標を購入前にテストする
マーケットで収入を得る
販売のためにプロダクトをプレゼンテーションする方法
MetaTrader 5のためのテクニカル指標 - 8

OBV MACD
Calculating MACD based on OBV data Features
3 outputs: MACD & Signal & Histogram 4 Colored Histogram Smoothing factor show/hide option for MACD & Signal lines Description
Among the few indicators developed for working with volume data, OBV (On Balance Volume) is the simplest yet most informative one. Its logic is straightforward: when the closing price is above the previous close, today's volume is added to the previous OBV; conversely, when the closing price is below the previous close
FREE

The Volume Delta Indicator is a technical analysis tool that combines volume analysis with price action to identify potential trading opportunities. This indicator analyzes the difference between buying and selling pressure through candle structure analysis. Key Features Volume Delta Calculation : Measures buy/sell volume difference using candle structure analysis EMA Smoothing : Applies exponential moving average to smooth volume data Breakout Detection : Identifies price breakouts with volume
FREE

Linear Regression Channel Pro The ultimate tool for statistical trend analysis. Automatically identifies the "Fair Value" of price and volatility extremes. Overview Linear Regression Channel Pro is a professional-grade indicator that automatically draws and updates the Linear Regression Channel for the current market trend. Unlike standard indicators that curve like Bollinger Bands, this tool draws precise straight-line channels based on the "Least Squares" mathematical method. It is designed fo
FREE

Koala FVGをMT5にご紹介します。プロフェッショナルなFair Value Gap(FVG)パターンインジケーターです。 Koala FVG: MT5で精密トレードへの道 Fair Value Gap(FVG)パターンの可能性を解き放つKoala FVG。これはMetaTrader 5向けに設計された最先端のインジケーターです。期間限定で、このプロフェッショナルツールに無料でアクセスできます。プレミアムインジケーターに移行する前にお試しください。 主な特徴: FVGパターンの検出: Koala FVGは、カスタマイズ可能な最小および最大サイズの基準に基づいて、資格のあるFVGパターンを知的に識別します。 ビジュアル表現: FVGゾーンを示すダイナミックな四角形を含む、クリアなグラフィカルディスプレイで視覚的な明瞭さを体験してください。三本のラインがFVGレベルをハイライトし、精密な分析が可能です。 矢印エントリーシグナル: トレードの機会を見逃さないでください。Koala FVGはエントリーポイントの明確な矢印シグナルを提供し、情報を元に意思決定できるようサポートします。 K
FREE

ほとんどの「即時RSIダイバージェンス」シグナルは間違っています RSIダイバージェンスのインジケーターを使用したことがある方は、恐らくこうした経験をしたことがあるでしょう。
リアルタイムでダイバージェンスが表示され、一瞬は正しいように見えますが、
数本のローソク足が経過すると消えてしまいます。
後でチャートを確認すると、過去のシグナルが最初に見たものと一致しなくなっています。 これはユーザーの操作ミスではありません。
論理的な問題です。 確認されていない高値や安値に基づくダイバージェンスは、本質的に不安定です。 過去の履歴を書き換えないRSIダイバージェンスインジケーターを探している場合は、
この説明をぜひ最後までお読みください。 ———————————————————— インジケーター概要 このインジケーターは、RSIダイバージェンスを特定するために設計されており、即時の推測ではなく、確認済みの市場構造に基づいています。 価格とRSIの間の強気・弱気のダイバージェンスを自動的に検出し、RSIウィンドウ内に明確に表示します。 主な特徴: RSIダイバージェンス構造の自動検出 RSIウ
FREE

98%の精度を誇るトレードシグナル 正確なエントリー、明確なエグジット | マルチタイムフレーム | 全市場対応
3つの簡単なステップで仕組みを確認 1️⃣ エントリー(買い/売りルール) シグナル発動:2本の線(X)がカラーゾーン(赤:買い、青:売り)の外側を横切る。
確認:価格ローソク足がクロスゾーンにタッチ(クロスゾーン中、またはクロスゾーンから1~5本以内)
代替エントリー(ノータッチ):
売りシグナル(青ゾーン):価格がクロスゾーンを上抜ける(ノータッチ)。
買いシグナル(赤ゾーン):価格がクロスゾーンを下抜ける(ノータッチ)。
2️⃣ エグジット(利益確定) 決済シグナル:黄色の線が現在のゾーンの外側をカーブ → エグジット。
3️⃣ リスク管理 ロットサイズ:口座残高1,000ドルあたり0.01ロット。
取引の分散:主要通貨ペア(例:USDJPY、EURGBP、GOLD)に分散投資。
このインジケーターがトレーダーに人気の理由 98% の精度 – 流動性と移動平均線クロスに基づく信頼性の高いシグナル。 あらゆる通貨ペア、コモディティ、時間足(1

The indicator is stable on noise fluctuations in price and quickly reacts to the trend. It is based on an algorithm from a system of hyperbolic functions that allows you to aggressively smooth the flat with minimal lag on the trend. It can be applied directly to the price chart, to itself, or to other indicators in order to eliminate false signals. The main purpose of the indicator is to smooth out small sawtooth price movements as much as possible. The higher the Hyperbolic parameter, the stron
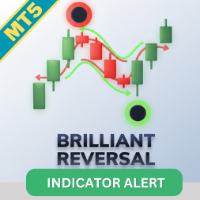
取引戦略を向上させる Brilliant Reversal Indicator MT5 は、非パラメトリックカーネル回帰を活用した最先端のインジケーターで、スムーズで適応性の高いトレンド分析を提供します。Nadaraya-Watson推定器に着想を得たこのツールは、価格データにガウスカーネル平滑化を適用し、市場のボラティリティに適応するダイナミックなエンベロープを作成しますが、伝統的な移動平均の過度のラグはありません。TradingViewなどのプラットフォームで広く称賛され、世界中のトレーダーから反転の検出精度で評価されているNadaraya Watson Envelopeは、2022年以来人気急上昇で、Bollinger Bandsの優れた代替品です。非再描画モードはリアルタイムの信頼性のあるシグナルを保証し、再描画オプションは詳細分析のためのウルトラスムーズなビジュアルを提供します。 トレーダーは、Brilliant Reversal Indicatorをトレンドの強さ、オーバーバイ/オーバーソールド状態、潜在的な反転ポイントを驚くべき精度で強調する能力で愛しています。基礎的な価

The official release price is $65 only for the first 10 copies, the next price is $125 Gold Scalper System is a multifunctional trading system that combines a breakout strategy for key liquidity levels with confirmation and a built-in Smart DOM Pro module for market depth analysis. The system identifies zones of limit order accumulation, tracks activity at support and resistance levels, and generates signals at the moment of their breako

The Gann Box (or Gann Square) is a market analysis method based on the "Mathematical formula for market predictions" article by W.D. Gann. This indicator can plot three models of Squares: 90, 52(104), 144. There are six variants of grids and two variants of arcs. You can plot multiple squares on one chart simultaneously.
Parameters Square — selection of a Gann square model: 90 — square of 90 (or square of nine); 52 (104) — square of 52 (or 104); 144 — universal square of 144; 144 (full) — "fu
エキスパートアドバイザーバージョン 手動シグナルではなく自動売買を好む場合は、こちらから本インジケーターのエキスパートアドバイザー版をご利用いただけます: https://www.mql5.com/en/market/product/148310
False Breakout Detector は、価格が直近のサポートまたはレジスタンスレベルを一時的に超えた後、すぐに元の範囲内に戻る状況を自動的に検出するインジケーターです。このような フェイクブレイクアウト は、逆張り戦略や裁量的なテクニカル分析に役立つ可能性があります。 主な機能: 過去N本のローソク足に対する フェイクブレイクアウトの自動検出 矢印、ライン、背景色 による視覚的なシグナル表示 ポップアップ通知およびプッシュ通知 によるリアルタイムアラート機能 パラメーターのカスタマイズ :分析するローソク足の本数、許容ピップ数、矢印の表示距離、カラー設定など 軽量かつ高速 なコード設計で、バックテストや実取引に最適化 互換性: タイムフレーム :M1 ~ H4 対応資産 :FX、株価指数、株式、商品など このインジケーターは、
FREE

MT5用のMarket Structure Break Outを紹介します – プロフェッショナルなMSBおよびUnbroken Zoneインジケーター。 MT4バージョンも利用可能です。こちらをご覧ください: https ://www .mql5 .com /en /market /product /109958 このインジケーターは継続的に更新されています。 私たちは、マーケット構造に基づいた非常に正確なエントリーおよびエグジットポイントを提供することに尽力しています。現在バージョン1.1に達しており、今ご参加いただければ以下の最新の変更が含まれます: 買いと売りのターゲット: 買いと売りのポジションに対して最適な利益確定レベルに関する明確な情報を取得できます。 最新のMSB方向: 最も最近のMarket Structure Breakoutの方向を表示して、より良い意思決定をサポートします。 改良されたビジュアルモード: ライト、ダーク、またはカスタムテーマに合わせてチャートをカスタマイズできます。 ライブテストの切り替え: 新しいオンスクリーンボタンで、ライブ

Azimuthは、完全な市場サイクル分析を一つのプロフェッショナルスイートで求める構造重視のトレーダーのために作られました。
ほとんどのZigZagインジケーターが主要なスイングのみを表示する中、Azimuthは4つのネストされたスイングレベル(L1/L2/L3/L4)を同時に表示します — 早期サイクルエントリー、後期サイクル警告、完全な構造的コンテキストを提供。スイングアンカーVWAP(任意の日次リセットではなく)、MTF ZigZagスイング、自動ABCパターン検出と組み合わせることで、チャートホッピングなしで機関レベルの構造分析が可能です。
主要機能
4レベルZigZagシステム - レベル1-4同時レンダリング(マイナーからマクロスイング) - カスタマイズ可能な期間(デフォルト:9/36/144/576 — フィボナッチ整列) - 即座のパターン認識のためのカラーコード可視化
スイングアンカーVWAP - 主要なスイング高値/安値にアンカーされたAVWAP L3 - デイリーVWAP参照ライン(機関ベンチマーク) - 方向性ロジック(上昇トレンドでサポート、下降
FREE
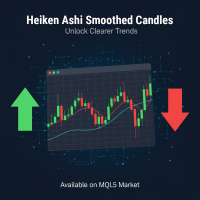
Heiken Ashi Smoothed インジケーター (MT5用) ノイズ除去+スムージング機能付きHeiken Ashi。偽シグナルを削減し、トレンドを早期発見。Forex・指数・暗号資産に最適 (H1-D1推奨)。 仕組みとスムージング方法 従来のHeiken Ashiは、過去の始値・終値・高値・安値を平均化してローソク足を計算し、小さな変動の影響をすでに軽減しています。しかし、 Heiken Ashi Smoothed は「生の」価格(raw)に追加のスムージングフィルターを適用してこのアプローチを向上させます。直接価格ではなく、移動平均(EMAまたはSMA、設定可能)を使用して入力データを処理し、より安定した流動的なトレンドを表すローソク足を生成します。 このスムージングプロセスは2段階で行われます: 基本Heiken Ashi計算 :価格を平均化して初期ローソク足を形成。強気ローソク(通常緑または白)は上昇トレンド、弱気(赤または黒)は下降トレンドを示します。 再帰的スムージング :結果に移動平均を適用し、異常なピークを除去して価格運動のより線形な表現を作成。一時的なボラ
FREE

Smart Money Breakout Channels Indicator
The Smart Money Breakout Channels indicator is a powerful technical analysis tool designed to identify potential breakout opportunities in financial markets by detecting consolidation channels based on price volatility. Built for MetaTrader 5 (MT5), it overlays dynamic channels on the price chart, highlighting areas of low volatility that often precede significant price movements. This indicator is inspired by smart money concepts, focusing on institution
FREE

This indicator displays Pivot-Lines, preday high and low, preday close and the minimum and maximum of the previous hour. You just have to put this single indicator to the chart to have all these important lines, no need to setup many single indicators.
Why certain lines are important Preday high and low : These are watched by traders who trade in a daily chart. Very often, if price climbs over or falls under a preday low/high there is an acceleration in buying/selling. It is a breakout out of a
FREE

This indicator displays the wave structure of the market in the form several wave levels nested in each other. For each of these levels an automatic preliminary (draft) marking of waves in Elliott's style (123..., ABC... etc.) is created. This markup is completely automatic and absolutely univocal. The indicator is especially useful for beginner wave analysts, because among all the possible versions for wave marking, it allows you to immediately take the most adequate version as a ba
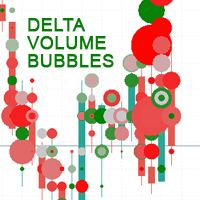
Delta Volume Bubbles is an advanced MetaTrader 5 indicator designed to visually display buy and sell pressure through dynamic, colored bubbles plotted directly on the price chart.
It calculates the net volume delta (difference between buy and sell volume) and represents it as bubbles of different sizes and colors giving traders a clear, intuitive picture of order flow activity. This indicator provides a visual form of order flow analysis , allowing traders to interpret market pressure even with
FREE
Candle_Timer_and_Spread インジケーターは、選択したシンボルのスプレッドとともに、ローソク足の終了までの時間と価格変化の割合を 1 つのチャートに表示します。
現在の時間枠のローソク足の終わりまでの時間と、その日の始値に対するパーセンテージでの価格変化のタイマーは、デフォルトでチャートの右上隅に表示されます。 パネルには、選択したシンボルのその日の始値に対する現在の価格のスプレッドと変化率が表示されます。パネルはデフォルトで左上隅に配置されます。
入力設定: Candle_Time_Lable_Settings - ローソク足の終わりまでの時間と現在のシンボルの価格の変化に関するタイマーのタイプの設定。 Font_Size - フォント サイズ。 X_offset - 横軸に沿ってシフトします。 Y_offset - 縦軸に沿ってシフトします。 Text_color - フォントの色。 Multi_Symbol_Settings - マルチシンボル パネルの設定。 Symbols_to_work - パネルに表示するシンボルをカンマで区切って手動で入力します
FREE

Trend Entry Indicator Your Trading will Be easier with this indicator!!! This Indicator is Developed To make our trading life easier. Get an Arrow for Entry with Take Profit and Slop Loss marks on chart. - Indicator is Based on trend, because thats what we all want we want to follow the trend "it's our friend". - Based on Levels, price action and oscillators. - It works on all currency pairs, all indices, metals and stock. - it works on all pairs/indexes on Deriv including Boom and Crash. - Tim

Institutional Liquidity Sweep & Stop Hunt Detector The FAKEOUT MATRIX PRO is a professional-grade analytical tool designed to identify the exact moments when institutional players "trap" retail traders. By monitoring session extremes and detecting high-probability Liquidity Sweeps, this indicator provides the technical edge needed to trade reversals with precision. The Institutional Logic Large financial institutions require significant liquidity to fill their orders. They often find this liquid
FREE
特別オファー : ALL TOOLS 、各 $35 ! 新しいツール は、 最初の1週間 または 最初の3件の購入 まで $30 です! MQL5 の Trading Tools チャンネル :最新情報を受け取るために私の MQL5 チャンネルに参加してください Zone Shift は、EMA/HMA ベースのバンドを用いてトレンド転換を検出し、重要な反応レベルを表示するトレンド識別ツールです。ローソク足の色でトレンド方向を示し、視覚的なキューで重要なリテストをマークしてモメンタムの把握を助けます。 MT5 版はこちら: Zone Shift MT5 Scanner MT4 版はこちら: Zone Shift MT4 Scanner その他の製品: All P roducts 主な機能 1) 動的 EMA-HMA バンド 3 本線のチャネルを構築します:中心線は EMA と HMA の平均、上限・下限はローソク足の平均レンジに基づき拡張。市場のボラティリティに適応し、現在の作動ゾーンを反映します。 2) トレンド検出(バンド越えロジック) 安値が上限バ

Benefits and Usage of the Volume Bubble Tool This tool, (one of my favorites by Algo Alpha, from Tradingview) provides an advanced method of volume analysis by moving beyond traditional histograms. It leverages statistical normalization (Z-score) on lower-timeframe data to identify and classify statistically significant volume events, visualizing the dynamic between "Smart Money" (institutional) and "Retail" participants. Core Benefits Intuitive On-Chart Visualization: By plotting volume as bub
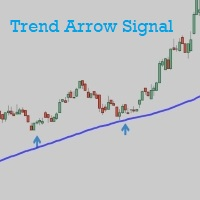
Trend Arrow Signal gives buy/sell signals and alerts with up and down arrow at potential reversal of a pullback or a trend continuation pattern. As the name indicated, this is an indicator which gives signals based on trend => It works best in trend market with the principle is to ride on the trend not trade against the trend. The main trend is determined by EMA 50 and can be changed manually to suit your preference. Trend arrow signal can work on all time frames. It gives signal at close of th
FREE

A professional tool for trading - the divergence indicator between the RSI and the price, which allows you to receive a signal about a trend reversal in a timely manner or catch price pullback movements (depending on the settings). The indicator settings allow you to adjust the strength of the divergence due to the angle of the RSI peaks and the percentage change in price, which makes it possible to fine-tune the signal strength. The indicator code is optimized and is tested very quickly as par
FREE

This indicator finds and displays the Double Bottom and Double Top technical analysis patterns. Signals (displays a message on the screen) if the shape was formed recently. Often after the appearance of these patterns, the trend reverses or a correction occurs. In order not to search for them yourself, or not to miss their appearance, it is enough to add an indicator to the chart. The indicator can be used on different timeframes and currency pairs, there are settings for a better search on a c
FREE

This is Heiken Ashi smoothed version, where you can choose on what type smoothness you want to make your strategy base. You can choose between EMA or MA, on the period you want. And you can choose colors.
Definition:
The Heikin-Ashi technique averages price data to create a Japanese candlestick chart that filters out market noise. Heikin-Ashi charts, developed by Munehisa Homma in the 1700s, share some characteristics with standard candlestick charts but differ based on the values used to cre
FREE
Smart Volume Activity [SVA] is an advanced analytical indicator designed for MetaTrader platforms. It reveals how institutional (Smart Money) and retail traders operate by analyzing volume behavior across multiple timeframes . Unlike ordinary volume tools, SVA automatically adapts to any chart timeframe and highlights zones of absorption — moments when large market participants absorb liquidity from weaker hands. By detecting abnormal volume spikes far beyond typical market noise, it distinguish

VISUAL ATR CANDLESTICK SCANNER PRO - 強化されたパターン認識 Visual ATR Candlestick Scanner Proは、一般的なローソク足パターンを自動的に識別・フィルタリングし、潜在的な市場の反転または継続をより明確に表示するように設計されたインジケーターです。 I. 主要な機能と動作 1. ローソク足パターンの自動認識 このインジケーターは、25以上のプロフェッショナルなローソク足パターンを自動的に認識し、明確なグループに分類します。 強力な強気グループ (Strong Bullish Group): 強気抱き線 (Bullish Engulfing)、三羽の白鴉 (Three White Soldiers)、明けの明星 (Morning Star)、強気キッカー (Bullish Kicker) など。 強力な弱気グループ (Strong Bearish Group): 弱気抱き線 (Bearish Engulfing)、三羽の黒鴉 (Three Black Crows)、宵の明星 (Evening Star)、弱気キッカー (

KT HalfTrend は、移動平均線に基づくトレンド指標であり、チャート上にゾーンを描画します。トレンドの変化を示すために、強気および弱気の無効化ゾーンを視覚的に表示します。 また、メインチャート上に矢印を用いて売買の強さを示します。トレンドがない場合、インジケーターはフラットになります。これは蓄積、価格の一時停滞、または分配ゾーンであることを示唆します。トレンドがある場合、傾きがその方向に現れます。 傾きが急であるほど、トレンドシグナルはより強力です。強い上昇トレンドは青色で、強い下降トレンドは赤色で示されることがあります。
機能
非常に使いやすく、視覚的にも優れたインジケーターです。 すべての通貨ペアと時間枠で効果的に使用できます。 積極的なエントリーと慎重なエントリーの両方に対応しています。 移動平均、パラボリックSAR、色設定などをカスタマイズ可能です。
活用方法 一般的に、価格がインジケーターの傾きを上回り、HalfTrendが青に変わると買いの条件が整います。 価格ローソク足の下に青い上向き矢印が表示され、強気のシグナルを示します。ストップロスはインジケーターの下に

The SuperTrend Strategy is a widely-used technical indicator based on the Average True Range (ATR), primarily employed as a trailing stop tool to identify prevailing market trends. The indicator is designed for ease of use while providing reliable insights into the current market trend. It operates based on two key parameters: the period and the multiplier . By default, it uses a period of 15 for the ATR calculation and a multiplier of 3 . The Average True Range (ATR) plays a crucial role in th
FREE

MACD Intraday Trend PROは、1960年代にGeraldAppelによって作成された元のMACDを応用して開発されたインジケーターです。
長年の取引を通じて、MACDのパラメーターをフィボナッチの比率で変更することにより、トレンドの動きの連続性をより適切に表現できることが観察され、価格トレンドの開始と終了をより効率的に検出できるようになりました。
価格トレンドの検出が効率的であるため、トップとボトムの相違を非常に明確に識別し、取引機会をより有効に活用することもできます。
特徴 インディケータMACD日中トレンドPROは、任意の通貨ペア、任意の時間枠、および練行足チャートで機能します。 5つのモードを選択することにより、トレンド検出速度を設定することができます。 最速 速い 正常 スロー 最も遅い
資力 6つの構成可能なアラートがあります。 MACDがシグナルラインを引き戻す MACDが信号線を横切る MACDがレベル0を超える 信号線がレベル0を超えています MACDはトレンドカラーを変更します 信号線変更トレンドカラー アラートごとに、以下を構成できま
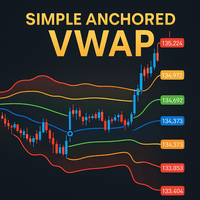
Simple Anchored VWAP is a lightweight yet powerful tool designed for traders who want precise volume-weighted levels without complexity.
This indicator lets you anchor VWAP from any point on the chart and instantly see how price reacts around institutional volume zones. MT4 Version - https://www.mql5.com/en/market/product/155320
Join To Learn Market Depth - https://www.mql5.com/en/channels/suvashishfx Using VWAP bands and dynamic levels, the tool helps you understand where real buying and s
FREE

Ichimoku Trend Alert is the Ichimoku Kinko Hyo indicator with Alerts and signal filters.
Ichimoku Trend Alert features: Optional check of Ichimoku cloud, Tenkan sen(Conversion Line), Kijun sen(Base Line), Senkou span A, Senkou span B, and Chikou span relative to price, and more. Popup, email, and phone notification alerts for selected symbols and timeframes.
There are 9 classic Ichimoku trend filters you can enable/disable in settings: Price/Cloud Order: Checks the price position relative to
FREE
Day and Week Separator MT5で取引分析を効率化しましょう。カスタマイズ可能な日次および週次の分離線をプロットする直感的なツールで、ブローカーのタイムゾーンの違いに直面するトレーダーにとって最適です。Forex FactoryやRedditのr/Forexなどの取引コミュニティでそのシンプルさと効果が高く評価されており、InvestopediaやTradingViewなどのプラットフォームでの議論で強調されている、チャートの時間枠をローカルまたは市場特有の時間に合わせるという一般的な課題に対応します。トレーダーはそのチャートの明確さを向上させる能力を称賛し、セッションベースの分析が改善され、取引セッションを明確にマークすることで取引計画が最大20%向上したと報告しています。特に、大きなタイムゾーンのずれがある地域(例:ヨーロッパのブローカーを使うアジア太平洋地域のトレーダー)に有効です。利点には、日次および週次の市場移行の正確な視覚化、ローカルまたは戦略的な時間に合わせたカスタマイズ可能な時間オフセット、あらゆる取引セットアップにシームレスに統合される軽量設計が含
FREE

The Price Action Finder indicator is an indicator of entry points, which is designed to search and display patterns of the Price Action system on a price chart. The indicator is equipped with a system of trend filters, as well as a system of alerts and push notifications. Manual (Be sure to read before purchasing) | Version for MT4 Advantages
1. Patterns: Pin bar, Outside bar, Inside bar, PPR, Power bar, Hanging man, Inverted hammer 2. Pattern filtering system. Removes countertrend patterns from

The indicator looks for consolidation (flat) in the market at a certain time, builds a box-channel and marks levels indented from it for a breakdawn. After crossing one of the levels, the indicator marks the zone for take profit and calculates the corresponding profit or loss in the direction of this entry on the panel. Thus, the indicator, adjusting to the market, finds a flat area of the market, with the beginning of a trend movement to enter it. Version for MT4: https://www.mql5.com/en/market
FREE

フェニックス・トレンド強度メーター (MT5)
MetaTrader 5 向け市場環境とトレンド強度分析ツール。ADX、RSI、方向性指数を単一パネルに統合し、市場状況をリアルタイムで分類します。
目的
多くのトレーダーが失敗するのは、エントリーポイントが悪いからではなく、間違った市場環境に誤った戦略を適用するためです。フェニックス・トレンド強度計は、市場がレンジ相場か、トレンド形成中か、強いトレンドか、あるいは消耗リスク領域に入りつつあるかをトレーダーが瞬時に判断するのを支援します。
本指標は、トレンド強度をADXで、方向性バイアスをDIで、モメンタムバランスをRSIで分析します。これらを視覚的なメーターに統合し、明確なテキストベースの相場状態分類(レンジ、慎重なロング/ショート、強いロング/ショート、リスク/延長)を表示します。パネルは新しいバーで更新され、オプションで相場状態変化や消耗アラートを含みます。
インストール
MQL5マーケットからダウンロードし、任意のチャートに添付してください。パネルは事前最適化されたデフォルト値で即座に表示されます。
要件
Meta
FREE

This is a simple order block locator. Searched for the existence of order blocks only at extremums. If you want multi criteria order block location check my other indicator which is more powerful here These order blocks are ICT order blocks without any buttering.
The indicator can be a useful tool for detecting reversals, continuations. You can also use the indicator as confluence with your other tools
FREE

概要 このインジケーターは、クラシックな ドンチャンチャネル を強化したバージョンで、実践的なトレード機能を追加しています。
標準の3本線(上限、下限、中央線)に加え、 ブレイクアウト を検出し、チャート上に矢印で視覚的に表示します。また、チャートを見やすくするために、 現在のトレンド方向と逆側のラインのみを表示 します。 インジケーターの機能: 視覚的シグナル :ブレイクアウト時にカラフルな矢印を表示 自動通知 :ポップアップ、プッシュ通知、Eメール RSIフィルター :市場の相対的な強弱に基づいてシグナルを検証 カスタマイズ可能 :色、ラインの太さ、矢印コード、RSI閾値など 動作原理 ドンチャンチャネルは次のように計算します: 上限線 :直近N本のクローズ済みローソク足の最高値 下限線 :直近N本のクローズ済みローソク足の最安値 中央線 :最高値と最安値の平均値 上方ブレイクアウト は終値が上限線を超えたときに発生し、 下方ブレイクアウト は終値が下限線を下回ったときに発生します。 インジケーターは以下を行います: 3本のドンチャンラインを描画 方向転換後の最初のブレイクアウト
FREE

Good old UT BOT converted from TradingView script by ' QuantNomad ', initially by ' Yo_adriiiiaan ' and ' HPotter ' - so you can bet this is powerful tool. If you know, you know. This is top of the line, while keeping it really simple.
Main function: trend identification with trend switch points , created by EMA(source) and ATR -source is CLOSE PRICE with option to use HEIKEN ASHI chart instead, for this you need "Heiken Ashi" indicator - its available as free download by MetaQuotes
One of th
The Omega Trend Indicator is an advanced tool that has been specifically designed to detect market trends early, and follow them efficiently. The indicator draws two lines. The main (thicker) Trend Line represents the presumed lower or upper volatility limits of the current market trend. A break in the main Trend Line indicates a potential reversal or shift in the movement of the trend. The Trend Line also indicates the best point to place a stop loss order. In Omega Trend Indicator, the Trend L
FREE
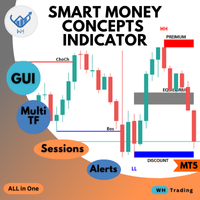
Welcome to the ultimate Smart Money Concepts indicator ,, this indicator is All-in-One package the only thing you need to empower
all the Smart Money Concepts in one place with interactive advanced gui panel with all the features and customization you need. MT4 Version : WH SMC Indicator MT4 *This Price For Limited Number of Copies.
Features: Main Section: User-Friendly Panel (GUI): Designed for traders of all experience levels, the indicator integrates seamlessly into your MT5 platform

Cybertrade Auto Fibonacci retraction and projection - MT5
Auto Fibonacci is an indicator that automatically plots the Fibonacci retracement and projection based on the number of bars you select in the indicator setting. You can customize nine different levels of retraction and three levels of projection. It works on periods longer than the period visible on the chart. All values are available in the form of buffers to simplify possible automations. This indicator is the same one we use in ou
FREE
REVERSAL POWER PRO
The ONLY Indicator That Shows You Where Markets WILL Reverse - BEFORE They Move
WELCOME TO THE NEXT LEVEL OF TRADING PRECISION
Tired of guessing where the market will turn? Missing entries because you don't know where support/resistance REALLY is? Getting stopped out at "fake" levels? Wondering if your bias is correct before entering?
What if you had: Crystal-clear Supply/Demand Zones that markets RESPECT Daily Bias Engine telling you market directio
FREE
ICONIC Reversal Engine Quality over quantity. Trade only the reversals that matter. The Problem: Noise, Overload, False Signals Most indicators flood charts with arrows but ignore context.
A hammer in a strong downtrend is irrelevant. An engulfing without volume is a trap.
Result: analysis paralysis, missed moves, costly errors. The Solution: Your Analytical Co-Pilot The ICONIC Reversal Engine is not “just another arrow.” It explains why a setup matters.
Every signal is stress-tested through a
FREE

This indicator is specifically designed for boom 1000 index. The indicator contains optimised trend filters to target buy spikes in an uptrend. The indicator also add a grid buy signal to recover some loss of the first buy signal. The indicator also provides exit signals for delayed spikes which can help with risk management .Also it analyses signals for historical data and displays percentage of good signals provided by the indicator. KEY FEATURES Non-lagging indicator. Non-repaint. Enable/d
FREE

Special offer : ALL TOOLS , just $35 each! New tools will be $30 for the first week or the first 3 purchases ! Trading Tools Channel on MQL5 : Join my MQL5 channel to update the latest news from me ICTの 反転フェアバリューギャップ (IFVG) の概念を活用した Inversion Fair Value Gaps Indicator でその力を解放しましょう!この最新ツールは、フェアバリューギャップ (FVG) を次のレベルに引き上げ、反転したFVGゾーンを特定して表示します。これらは、価格修正後に形成される重要なサポートおよびレジスタンスエリアです。スキャルパー、スイングトレーダー、長期投資家のいずれであっても、IFVGインジケーターはリアルタイムでの意思決定にとって貴重な洞察を提供します。 MT4バージョンはこちら: Inversion Fair Val

ご紹介いたします、 Golden Sniper Indicator は、トレーダーのトレード体験を向上させるために精巧に作成された強力な MQL5 ツールです。6年以上の経験を持つトレーダーチームによって開発され、このインジケーターは非常に高い精度でトレード機会を特定するための信頼性のある方法を提供します。 主な特徴 : アラートとシグナル矢印 :Golden Sniper Indicator はタイムリーなアラートと視覚的なシグナル矢印を提供し、トレンド反転を特定するのに役立ちます。 リスク管理 :Risk-Reward Ratio(RRR)に基づいて適切な利益確定とストップロスのレベルを示します。 適応性 :初心者からプロのトレーダーまで、このインジケーターはスイングトレードやスキャルピングなどさまざまなトレードスタイルに適応します。 カスタマイズ可能な設定 :インジケーターを自分の好みに合わせて調整できます。 おすすめ : タイムフレーム :Golden Sniper Indicator はすべてのタイムフレームで優れたパフォーマンスを発揮します。スキャルピングにはM5とM15

Price Volume Trend (PVT) Oscillator Description: The PVT Oscillator is a volume indicator that serves as an alternative to the standard On-Balance Volume (OBV). While ordinary volume indicators can be noisy and hard to read, this tool converts volume flow into a clear Histogram Oscillator, similar to a MACD, but for Volume. It is designed to detect first Trend Reversals and Divergences by analyzing the difference between a Fast and Slow PVT moving average. Why is this better than standard OBV?
FREE

Multicurrency and multitimeframe modification of the indicator Bollinger Bands. On the dashboard you can see breakouts and touches of the Bollinger Bands. In the parameters you can specify any desired currencies and timeframes. The indicator can also send notifications when the price touches the Bollinger Bands, when the current volatility changes (expands or falls), and when the price touches all the bands. By clicking on a cell with a period, this symbol and period will be opened. This is MTF
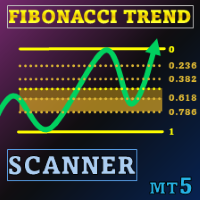
スペシャルオファー : ALL TOOLS 、1つあたり $35 のみ! New tools will be $30 for the first week or the first 3 purchases ! Trading Tools Channel on MQL5 : Join my MQL5 channel to update the latest news from me ボラティリティの高いトレード環境では、パワフルで直感的な分析ツールがあれば、チャンスを素早く捉えることができます。Fibonacci Trend Scanner は従来のFibonacciインジケーター機能とSuperTrendを統合しただけでなく、通貨ペアのスキャン、マルチタイムフレームのモニタリング、そしてトレンドが強気から弱気へ(またはその逆)転換する際にインテリジェントアラートを出す機能など、機能を拡張しています。 See more MT4 version at: Fibonacci Trend MT4 Scanner See more products at: A

Projective SR – リアルタイム予測のサポートとレジスタンス Projective SR は、チャート上の 重要なサポートとレジスタンスのポイント を自動的に検出し、それらを 斜めかつ動的に未来へ投影する 高度なインジケーターであり、価格が反応する可能性のあるゾーンを予測します。 固定レベルのみを表示する従来のインジケーターとは異なり、 Projective SR は価格の幾何学を分析し 、最も関連性の高い ピボット を特定し、市場の動きに適応する 傾斜したライン を描画します。 これらのラインは リアルタイムで更新され 、新しいローソク足が形成されるにつれて価格構造がどのように進化するかを示します。 技術的特徴 (Gijutsu-teki Tokuchō) ローソク足の構造に基づいた ピボット (高値と安値)の 自動検出 。 リアルタイム計算 を使用した 正確な幾何学的投影 (バー数に基づく計算ではない)。 将来の動きを予測する 投影されたサポートおよびレジスタンスライン 。 柔軟な設定: ピボットの感度、投影の長さ、色、太さ、ラベル。 安定モード: 新しい確認済みピボッ
FREE

The Hydra Multi Trend Dashboard is a powerful market scanning tool designed for MetaTrader 4 and MetaTrader 5. It monitors up to 25 currency pairs or assets simultaneously across all 9 standard timeframes (M1 to Monthly). Using a proprietary Special Trend Formula , the dashboard filters out market noise and provides clear, visual Bullish or Bearish signals, allowing traders to identify trend alignments at a glance without switching charts. Setup & Guide:
Download MT4 Version here. Exclusivel

Indicator for manual trading and technical analysis for Forex.
It consists of a trend indicator with the opening level of the trading day and a arrow indicator for determining entry points.
The indicator does not recolor; it works when the candle closes.
Contains several types of alerts for signal arrows.
Can be configured to work on any chart, trading instrument or time frame.
The work strategy is based on searching for price movements along the trend.
To make " Buy " transactions: The tre
hello,
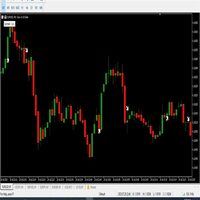
king binary sureshot mt5 binary indicator,
1 minute candle
1 minute expire
Alright. This indicator works on MT5 and is very easy to use. When you receive a signal from it, you wait for that candle with the signal to close and you enter your trade at the beginning of the next new candle. A red arrow means sell and a green arrow means buy. All arrows comes with a long dotted like for easy identification of trade signal. Are you okay with that?
FREE
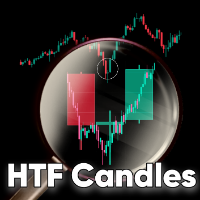
HTF Candles is an indicator which plots the outline of the higher time-frame candles on the lower candle. The indicator gives you the option to choose whether or not to view live current HTF candle, with no lag or repainting. Features No objects drawn on chart: The indicator does not plot any lines or rectangle objects on the chart, it simply draws the htf candles. This keeps your chart simple and clean. MTF Selection: The indicator allows you to choose all the different higher time-frames for e

I recommend you to read the product's blog (manual) from start to end so that it is clear from the beginning what the indicactor offers. This multi time frame and multi symbol indicator identifies double or triple top/bottom formations or a following neckline breakout (confirmed top/bottom). It offers RSI, pin bar, engulfing, tweezer, morning/evening star filters as well divergence filter options which makes it possible to filter out only the strongest setups. The indicator can also be used

Trendline Targets Dashboard MT5 Trendline Targets Dashboard MT5 は、MetaTrader 5 用のインジケーターで、完全なビジュアル・トレードプランを表示します。 シグナル 、 エントリー価格(Entry) 、 ストップロス(Stop Loss) 、および 利確目標(Take Profits) を、リスク比率 R に基づいて自動的に計算します。 このツールは注文を出すものではありません。トレードの分析と視覚的管理を目的としたツールであり、自動売買ロボット(EA)ではありません。 リリース記念特典: 購入者全員に、私の MQL5 プロフィールにあるお好きな インジケーターを1つ無料でプレゼント します。 ※ 注意: Market Structure Order Block Dashboard MT5 は特典対象外です。 特典を受け取るには、購入後に MQL5 メッセージ機能でご希望の製品名をお送りください。 主な機能 ネオンエフェクト付きトレンドライン(強気/弱気) ローソク足確定時のトレンド反転による BUY/SELL

Peak Trough Analysis is the great tool to detect peaks and troughs in your chart. Peak Trough Analysis tool can use three different peaks and troughs detection algorithm. The three algorithm include the orignal Fractals Indicator by Bill Williams, the Modified Fractals indicator and ZigZag indicator. You can use this peak and trough analysis tool to detect the price pattern made up from Equilibrium Fractal-Wave process. For further usage, there are good guide line on how to use this peak trough
FREE
正確で、時機を得た市場の記入項目のためのスマートな助手。 価格がレベルに達すると、インジケータのビープ音とアラートが鳴ります。 サポートレベルと抵抗レベルを手動で設定するか、アルゴリズムに委ねることができます。 価格がレベルに達する瞬間に、キャンドルパターンが追加的にマークされています。 独特な蝋燭パターンは故障および反動のレベルの古典的なパターンそしてパターンの共生である。 証券取引所での収益性の高い取引の場合、ほとんどの場合、注文は十分ではなく、トレーダーは重要なレベルに近づいたときに価格がどのように動作するかを個人的に見て分析する必要があります。 私はすべてのトレーダーが取引日の初めに重要な目標を設定し、価格がそれらに達した瞬間を逃した状況に遭遇したと思います。 その結果、エントリの瞬間が見逃され、私たちは私たちの計画に完全に従って価格の動きを見て追加の否定的な感情を得ます。 しかし、あなたはそこにいません、そして利益はありません。 喜びと快適さとの貿易! これ以上の終わりに日のためのモニターを見つめていません。 あなたにとって重要であり、あなたのビジネス、他の仕事について行く、
FREE

Position Size Calculator PRO MT5 (v2.1) Position Size Calculator PRO は、MetaTrader 5 用の リスク管理 インジケーターです。1回のトレードで許容するリスク、 Stop Loss までの距離、そして銘柄の仕様(tick value、tick size、最小/最大/ステップ数量、証拠金)に基づいて、最適な ポジションサイズ(lot size) を自動計算します。 本製品は 注文を発注しません 。またポジション管理も行いません。エントリー前の計算ミスを減らし、資金管理(money management)を標準化するための 意思決定サポートツール です。 チャート上に表示される内容 リスク設定に基づく推奨ロットサイズ(lot size) Entry / Stop Loss / Take Profit の水準と pips/points での距離 推定リスク(口座通貨と%)および SL 到達時の想定損失 Take Profit と想定利益、Risk/Reward(R:R)比 必要証拠金と証拠金維持率(ブローカー提供

Sigma Indicator is used by Sigma Expert advisor for plotting the zones but now its available for members to apply their stratagies on Sigma supply and demand levels.
Instructions:
1- Donot Change time frames instead run several pairs with different time frames with sigma indicator 2- For exness : Search for smaller zone = True
For other brokers keep it False
3- Maximum zone size = 0
4- Minimum zone size = 0
5 - Back candles = 300

Multicurrency and multitimeframe modification of the ZigZag indicator. Displays the current direction of the market, the height of the last movement, the number of bars in this movement and the breaking of the previous point of the ZigZag (horizontal line). This is MTF Scanner, you can actually see the supply and demand levels.
You can specify any desired currencies and timeframes in the parameters. Also, the panel can send notifications when the ZigZag changes direction or when there was a br

Multicurrency and multi-timeframe indicator Inside Bar (IB). In the parameters, you can specify any desired currencies and timeframes. The panel displays the last found Inside Bar (and Mother Bar) pattern, the current price position and the breakout of the levels of the Mother and Inside Bars. You can set the size and color for bars and text in the cells. The indicator can also send notifications when levels are broken. The dashboard highlights Double Inside Bar in a special color. By clicking

フェニックス・サポート&レジスタンス検出ツール (MT5)
MetaTrader 5向けプロフェッショナルな支持線・抵抗線検出ツール。上位時間足から最も強力なS&Rレベルを自動検出。視覚的なダッシュボードを通じて包括的な強度分析を表示します。
概要
フェニックス サポート&レジスタンス検出ツールは、上位時間足ピボット分析(デフォルトH4、カスタマイズ可能)を用いて、最も強力な3つのサポート・レジスタンスレベルを特定します。システムはテスト回数、コンソリデーションバー数、現在価格への近接度でレベルをランク付けし、S1、S2、S3、R1、R2、R3を示す見やすい6列ダッシュボードを通じて詳細な指標を表示します。
各レベルには5つの主要指標が表示されます:現在の価格、強さ分類(テスト回数に基づく「強い」「中程度」「弱い」)、距離分類(「近い」「中程度」「遠い」)、コンソリデーションバー数、極性ステータス。極性検出システムは、価格がレベルを突破した際にレジスタンスレベルがサポートに反転するタイミング(逆も同様)を特定します。
インジケーターはチャート上に水平価格ラインを描画し、自動価
FREE

This indicator searches for candlestick patterns. Its operation principle is based on Candlestick Charting Explained: Timeless Techniques for Trading Stocks and Futures by Gregory L. Morris. If a pattern is detected, the indicator displays a message at a bar closure. If you trade using the MetaTrader 4 terminal, then you can download the full analogue of the " Candle Pattern Finder for MT4 " indicator
It recognizes the following patterns: Bullish/Bearish (possible settings in brackets) : Hammer

This is an indicator of trading sessions that can display all levels (Open-High-Low-Close) for four sessions . The indicator can also predict session levels. Sessions can be drawn with lines or rectangles (empty or filled), lines can be extended to the next session. You can easily hide/show each session by pressing hotkeys (by default '1', '2', '3', '4'). You can see ASR (Average Session Range) lines (default hotkey 'A'). This is similar to the ADR calculation, only it is calculated based on

MA3 Trend MT5 - is the good trend indicator on three MAs . Benefits of the indicator: The indicator produces signals with high accuracy.
The confirmed signal of the indicator does not disappear and is not redrawn.
You can trade on the MetaTrader 5 trading platform of any broker.
You can trade any assets (currencies, metals, cryptocurrencies, stocks, indices etc.).
You can trade on any timeframes (M5-M15 scalping and day trading / M30-H1 medium-term trading / H4-D1 long-term trading). Indi
FREE

Indicador gratuito para Metatrader 5 que muestra en pantalla una caja rectangular para cada una de las sesiones de mercado "Londres, New York y Tokio". Se puede establecer la zona horaria de forma automática o mediante un valor de offset. Parámetros de configuración para cada una de las sesiones. Visible / No visible Hora Inicial Hora Final Caja sólida o transparente. Estilo del borde de la caja. Grosor del borde de la caja. Color.
FREE
MetaTraderマーケットはMetaTraderプラットフォームのためのアプリを購入するための便利で安全な場所を提供します。エキスパートアドバイザーとインディケータをストラテジーテスターの中でテストするためにターミナルから無料のデモバージョンをダウンロードしてください。
パフォーマンスをモニターするためにいろいろなモードでアプリをテストし、MQL5.community支払いシステムを使ってお望みのプロダクトの支払いをしてください。
取引の機会を逃しています。
- 無料取引アプリ
- 8千を超えるシグナルをコピー
- 金融ニュースで金融マーケットを探索
新規登録
ログイン