Conheça o Mercado MQL5 no YouTube, assista aos vídeos tutoriais
Como comprar um robô de negociação ou indicador?
Execute seu EA na
hospedagem virtual
hospedagem virtual
Teste indicadores/robôs de negociação antes de comprá-los
Quer ganhar dinheiro no Mercado?
Como apresentar um produto para o consumidor final?
Indicadores Técnicos para MetaTrader 5 - 8
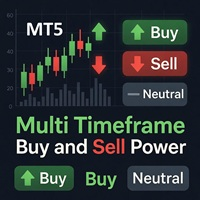
Multi Timeframe Buy and Sell Power
The Multi Timeframe Buy and Sell Power indicator for MetaTrader 5 is a versatile tool designed to provide traders with a clear visual representation of market pressure across nine standard timeframes, from M1 to MN1. By aggregating buy and sell strength percentages derived from recent price action and tick volume, it helps identify potential trends, reversals, and neutral conditions in real-time. The indicator displays this information in a compact dashboard
FREE

tendência,análise de tendência,sinais,alertas,painel de trading,painel visual,contexto de mercado,scalping,intraday,day trade,swing trade,não repinta,sem repintura,gestão de risco,risco retorno,suporte resistência,zonas de oferta demanda,pressão de compra venda,forex,cripto,multi timeframe
QuantumTrade Panel – Descrição Completa O QuantumTrade Panel é um indicador avançado para MetaTrader 5 desenvolvido para fornecer contexto completo de mercado em tempo real , reunindo em um único painel info
FREE

OBV MACD
Calculating MACD based on OBV data Features
3 outputs: MACD & Signal & Histogram 4 Colored Histogram Smoothing factor show/hide option for MACD & Signal lines Description
Among the few indicators developed for working with volume data, OBV (On Balance Volume) is the simplest yet most informative one. Its logic is straightforward: when the closing price is above the previous close, today's volume is added to the previous OBV; conversely, when the closing price is below the previous close
FREE

Phoenix Auto Fibonacci Monitor (MT5)
Ferramenta profissional de inteligência Fibonacci e análise de oscilações para MetaTrader 5. Detecta automaticamente as oscilações dominantes do mercado e fornece informações avançadas sobre a retração de Fibonacci através de um painel visual em tempo real.
Visão geral
O Phoenix Auto Fibonacci Monitor identifica automaticamente as principais oscilações do mercado usando pivôs de intervalos de tempo mais altos e validação ATR, e então traça níveis inteligen
FREE

Order Flow Lite is a technical analysis utility designed to visualize synthetic Order Flow, Footprint Charts, and Tick Analysis using standard broker data. It assists traders in analyzing Delta logic and Volume Profiling based on recent price action. Key Features: Synthetic Footprint: Visualizes volume data for the most recent 3 closed candles, offering a clear view of immediate market sentiment. Tick Delta: Displays basic Buy/Sell delta visualization to identify potential reversals. Volume Pro
FREE

Descrição geral Este indicador é uma versão aprimorada do Canal Donchian clássico, enriquecida com funções práticas para o trading real.
Além das três linhas padrão (máxima, mínima e linha do meio), o sistema detecta breakouts e os mostra visualmente com setas no gráfico, exibindo apenas a linha oposta à direção da tendência atual para uma leitura mais limpa. O indicador inclui: Sinais visuais : setas coloridas nos breakouts Notificações automáticas : alerta pop-up, push e e-mail Filtro RSI : pa
FREE
The Omega Trend Indicator is an advanced tool that has been specifically designed to detect market trends early, and follow them efficiently. The indicator draws two lines. The main (thicker) Trend Line represents the presumed lower or upper volatility limits of the current market trend. A break in the main Trend Line indicates a potential reversal or shift in the movement of the trend. The Trend Line also indicates the best point to place a stop loss order. In Omega Trend Indicator, the Trend L
FREE

This is the Cumulative Volume Delta (CVD) , it's an indicator that calculates the long and short volumes plotting it then as a line on the chart, the most efficient way to use this indicator is by comparing the CVD line to the current chart and looking at the Divergence beetween the two of them, so that you can identify fake-outs and liquidty sweeps. for example in the picture that i put below you can see that the price has made a lower low but the CVD didn't, that means the volumes didn't suppo
FREE

Benefits and Usage of the Volume Bubble Tool This tool, (one of my favorites by Algo Alpha, from Tradingview) provides an advanced method of volume analysis by moving beyond traditional histograms. It leverages statistical normalization (Z-score) on lower-timeframe data to identify and classify statistically significant volume events, visualizing the dynamic between "Smart Money" (institutional) and "Retail" participants. Core Benefits Intuitive On-Chart Visualization: By plotting volume as bub

O Preço médio ponderado por volume é semelhante a uma média móvel, exceto que o volume é incluído para ponderar o preço médio durante um período.
O preço médio ponderado por volume [VWAP] é uma média ponderada dinâmica projetada para refletir com mais precisão o preço médio verdadeiro de uma segurança em um determinado período. Matematicamente, o VWAP é o somatório do dinheiro (ou seja, Volume x Preço) transacionado dividido pelo volume total em qualquer horizonte de tempo, normalmente do merca
FREE
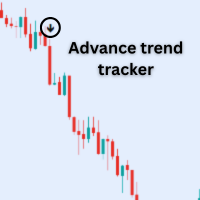
Features: 1. Buy arrows= when Up trend start. 2.Sell arrows = when Down trend start 3.Alert System= when Signal appear then Mt5 itself Pop up a alert Box. 4. You can get notifications on your phone real time through Mt5 app.
Note: this indicator will work on trending market. So try to trade volatile market.
Best Pair: Only trade in New York session NASDAQ (US100) S&P ( US500) Dow Jones (US30)
Note : Don't Trade Forex pair.
FREE

Modificação multimoeda e multitimeframe do Oscilador Estocástico. Você pode especificar quaisquer moedas e prazos desejados nos parâmetros. O painel exibe os valores atuais e as interseções das linhas — Sinal e Principal (cruzamento estocástico). Além disso, o indicador pode enviar notificações ao cruzar os níveis de sobrecompra e sobrevenda. Ao clicar em uma célula com ponto final, este símbolo e ponto final serão abertos. Este é o scanner MTF. Semelhante ao Medidor de Força da Moeda, o Painel

An ICT fair value gap is a trading concept that identifies market imbalances based on a three-candle sequence. The middle candle has a large body while the adjacent candles have upper and lower wicks that do not overlap with the middle candle. This formation suggests that there is an imbalance where buying and selling powers are not equal. Settings Minimum size of FVG (pips) -> FVGs less than the indicated pips will be not be drawn Show touched FVGs Normal FVG color -> color of FVG that hasn't
FREE
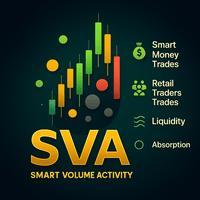
Smart Volume Activity [SVA] is an advanced analytical indicator designed for MetaTrader platforms. It reveals how institutional (Smart Money) and retail traders operate by analyzing volume behavior across multiple timeframes . Unlike ordinary volume tools, SVA automatically adapts to any chart timeframe and highlights zones of absorption — moments when large market participants absorb liquidity from weaker hands. By detecting abnormal volume spikes far beyond typical market noise, it distinguish

Institutional Liquidity Sweep & Stop Hunt Detector The FAKEOUT MATRIX PRO is a professional-grade analytical tool designed to identify the exact moments when institutional players "trap" retail traders. By monitoring session extremes and detecting high-probability Liquidity Sweeps, this indicator provides the technical edge needed to trade reversals with precision. The Institutional Logic Large financial institutions require significant liquidity to fill their orders. They often find this liquid
FREE

VISUAL ATR CANDLESTICK SCANNER PRO - Reconhecimento de Padrões Aprimorado O Visual ATR Candlestick Scanner Pro é um indicador projetado para identificar e filtrar automaticamente padrões comuns de velas, proporcionando uma visão mais clara de potenciais reversões ou continuações do mercado. I. Principais Características e Funcionalidade 1. Reconhecimento Automatizado de Padrões de Velas O indicador reconhece automaticamente mais de 25 padrões de velas profissionais, classificados em grupos clar

Cybertrade Auto Fibonacci retração e projeção - MT5
O Fibonacci automático é um indicador que traça automaticamente a retração e projeção de Fibonacci com base no número de barras que você seleciona na configuração do indicador. Estão disponíveis 9 níveis diferentes para retração e 3 níveis para projeção que podem ser customizados conforme desejado. Funciona em períodos maiores do que o período visível no gráfico. Todos os valores estão disponíveis em forma de buffers para simplificar possí
FREE

O KT HalfTrend é um indicador de tendência baseado em média móvel que desenha zonas no gráfico. Ele sinaliza uma mudança de tendência marcando zonas de invalidação altista e baixista. Também exibe a força de compra e venda com setas no gráfico principal. Quando não há tendência, o indicador permanece plano, indicando zonas de acumulação, consolidação ou distribuição temporária. Quando há tendência, ele apresenta uma inclinação na direção correspondente. Os sinais de tendência são mais fortes qua

Was: $69 Now: $49 Blahtech VWAP - Volume Weighted Average Price (VWAP) is the ratio of price to total volume. It provides an average price over a specified time interval. Links [ Install | Update | Documentation ] Feature Highlights
Configurable VWAP Line Sessions, intervals, anchored or continuous Previous day settlement line Standard Deviation bands Alerts at bar close or real time Automatic Broker or Tick volumes Significantly reduced CPU usage
Input Parameters
Expert Advisor Mo

The Forex Master Pattern is an alternative form of technical analysis that provides a framework which will help you to find and follow the hidden price pattern that reveals the true intentions of financial markets. This algorithm here does a good job detecting the Phase 1 of the Forex Master Pattern cycle, which is the contraction point (or Value).
On Phase 2 we get higher timeframe activation (also called Expansion), which is where price oscillates above and below the average price defined

Watermark Centralized
Adiciona uma marca d'agua centralizada com o nome do ativo e o período escolhido. É possível substituir o tipo de fonte, o tamanho da fonte, a cor da fonte e o caracter separador. A marca d'agua é posicionada atrás dos candles, não atrapalhando a visualização. Possui recentralização automática caso a janela seja redimensionada.
Espero que este indicador te ajude, bons trades ;)
FREE

AW Super Trend - Este é um dos indicadores de tendência clássicos mais populares. Possui uma configuração simples, permite trabalhar não apenas com a tendência, mas também exibe o nível de stop loss, que é calculado por este indicador. Benefícios:
Instrumentos: Pares de moedas , ações, commodities, índices, criptomoedas. Prazo: М15 e superior. Tempo de negociação: 24 horas por dia. Mostra a direção da tendência atual. Calcula o stop loss. Pode ser usado ao trabalhar com negociação. Trê
FREE

Position Size Calculator PRO MT5 (v2.20) Position Size Calculator PRO é uma ferramenta profissional de gestão de risco para MetaTrader 5 que calcula o tamanho de lote recomendado com base no seu risco por operação, distância do Stop Loss e especificações do símbolo (valor do tick, tamanho do tick, volume mín/máx/passo, margem). Sem operações comerciais: este indicador não abre nem fecha ordens e não gere posições. É uma ferramenta de apoio à decisão para padronizar a sua gestão de capital e redu

Ghost Renko Overlay Indicator Overview Ghost Renko Overlay Indicator displays Renko bricks directly on the main price chart as a semi-transparent overlay.
Unlike traditional Renko charts that require a separate offline window, this indicator allows traders to view standard candlestick price action and Renko structure simultaneously on the same chart. The overlay helps identify trend direction, price noise, and consolidation phases without losing time-based market context. Key Features Renko bric
FREE
Candle Timer Countdown (CTC) – Minimalist & Precise Candle Timer Candle Timer Countdown (CTC) is a lightweight and non-intrusive MetaTrader indicator that displays the remaining time of the current candlestick on your chart. Designed with simplicity and clarity in mind, this tool helps traders stay aware of candle closures without cluttering the chart. Key Features: Real-Time Candle Countdown
Always know how many seconds are left before the current candle closes – works on all timeframes. Minima
FREE

MA3 Trend MT5 - is the good trend indicator on three MAs . Benefits of the indicator: The indicator produces signals with high accuracy.
The confirmed signal of the indicator does not disappear and is not redrawn.
You can trade on the MetaTrader 5 trading platform of any broker.
You can trade any assets (currencies, metals, cryptocurrencies, stocks, indices etc.).
You can trade on any timeframes (M5-M15 scalping and day trading / M30-H1 medium-term trading / H4-D1 long-term trading). Indi
FREE

Understanding the levels of the previous day or week is very important information for your trading.
This indicateur allow to draw Previous day High/Low Previous week High/Low
Congifuration High & Low for: Previous day, week Line Style, color Label position, size, color Any questions or comments, send me a direct message here https://www.mql5.com/en/users/mvonline
FREE

The indicator draws supply and demand zones. The zone timeframe can be set independently of the chart timeframe. For instance, it is possible to set M5 zones on an H4 chart. The importance of zones can be adjusted using the zone strength parameter. Demand zones are displayed if at least one candle in the range of the zone is entirely above the zone. Similarly, supply zones are displayed if at least one candle within the zone is entirely below the zone.
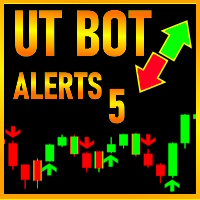
Good old UT BOT converted from TradingView script by ' QuantNomad ', initially by ' Yo_adriiiiaan ' and ' HPotter ' - so you can bet this is powerful tool. If you know, you know. This is top of the line, while keeping it really simple.
Main function: trend identification with trend switch points , created by EMA(source) and ATR -source is CLOSE PRICE with option to use HEIKEN ASHI chart instead, for this you need "Heiken Ashi" indicator - its available as free download by MetaQuotes
One of th

The indicator is designed for easy construction of synthetic charts based on data of various financial instruments. It will be useful both arbitrage and pair trading, as well as for analysis purposes. Its main advantage is simplicity and clarity. Each chart is given as a common mathematical formula. For example, if you want to plot the spread (difference) between EURUSD and GBPUSD with coefficients 4 and 3, then set the following formula: EURUSD * 4 - GBPUSD * 3 The resulting chart is shown in t

Ichimoku Trend Alert is the Ichimoku Kinko Hyo indicator with Alerts and signal filters.
Ichimoku Trend Alert features: Optional check of Ichimoku cloud, Tenkan sen(Conversion Line), Kijun sen(Base Line), Senkou span A, Senkou span B, and Chikou span relative to price, and more. Popup, email, and phone notification alerts for selected symbols and timeframes.
There are 9 classic Ichimoku trend filters you can enable/disable in settings: Price/Cloud Order: Checks the price position relative to
FREE

Special offer : ALL TOOLS , just $35 each! New tools will be $30 for the first week or the first 3 purchases ! Trading Tools Channel on MQL5 : Join my MQL5 channel to update the latest news from me Desbloqueie o poder do conceito de Inversion Fair Value Gap (IFVG) de ICT com o Inversion Fair Value Gaps Indicator ! Esta ferramenta inovadora eleva os Fair Value Gaps (FVGs) a um novo nível, identificando e exibindo zonas de FVG invertidas — áreas-chave de suporte e resistência formada

Olá pessoal, aqui é o The Rangers Fx Conseguimos criar um indicador para capturar picos no Índice Boom 1000, no Índice Boom 500 e no Índice Boom 300, de fato, essas palavras indicadoras em todos os Booms que estão disponíveis e nos outros que ainda estão por vir no futuro. Como usar este indicador Em primeiro lugar, você deve mudar seu período para M1/M5. Este indicador lhe enviará um alerta sobre quando realizar suas negociações de compra e quando sair/fechar suas negociações (X) e não tenha me

This is a derivative of John Carter's "TTM Squeeze" volatility indicator, as discussed in his book "Mastering the Trade" (chapter 11).
Gray dot on the midline show that the market just entered a squeeze (Bollinger Bands are with in Keltner Channel). This signifies low volatility, market preparing itself for an explosive move (up or down). Blue dot signify "Squeeze release".
Mr.Carter suggests waiting till the first blue after a gray dot, and taking a position in the direction of the moment
FREE

To get access to MT4 version please click https://www.mql5.com/en/market/product/130055  ; - This is the exact conversion from TradingView: "Ut Alart Bot Indicator". - You can message in private chat for further changes you need. Here is the source code of a simple Expert Advisor operating based on signals from Ut Bot Indicator . #property copyright "This EA is only education purpose only use it ur own risk" #property link " https://sites.google.com/view/automationfx/home " #property versio
FREE

Permita-me apresentar o Golden Sniper Indicator , uma poderosa ferramenta MQL5 meticulosamente desenvolvida para traders que desejam aprimorar sua experiência de negociação. Desenvolvido por uma equipe de traders experientes com mais de 6 anos de expertise , este indicador oferece um método confiável para identificar oportunidades de negociação com notável precisão. Principais Características : Alertas e Setas de Sinal : O Golden Sniper Indicator fornece alertas oportunos e setas visuais de sin

Modificação multimoeda e multitimeframe do indicador Bollinger Bands. No painel você pode ver os rompimentos e toques das Bandas de Bollinger. Nos parâmetros você pode especificar quaisquer moedas e prazos desejados. O indicador também pode enviar notificações quando o preço toca as Bandas de Bollinger, quando a volatilidade atual muda (expande ou cai) e quando o preço toca todas as bandas. Ao clicar em uma célula com ponto final, este símbolo e ponto final serão abertos. Este é o scanner MTF.

Price Volume Trend (PVT) Oscillator Description: The PVT Oscillator is a volume indicator that serves as an alternative to the standard On-Balance Volume (OBV). While ordinary volume indicators can be noisy and hard to read, this tool converts volume flow into a clear Histogram Oscillator, similar to a MACD, but for Volume. It is designed to detect first Trend Reversals and Divergences by analyzing the difference between a Fast and Slow PVT moving average. Why is this better than standard OBV?
FREE
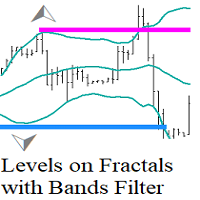
Levels on Fractals with Bands Filter é um nível baseado em fractais filtrados com o indicador Bollinger Bands.
O Levels on Fractals with Bollinger Bands Filter é uma ferramenta de análise técnica que usa uma combinação de fractais e o indicador Bollinger Bands para identificar níveis de suporte e resistência.
Como usá-lo.
Quando um fractal se forma atrás da banda de Bollinger externa (quebra de volatilidade), isso indica que o preço atingiu um nível extremo e pode mudar de direção.
Esses
FREE

A professional tool for trading - the divergence indicator between the RSI and the price, which allows you to receive a signal about a trend reversal in a timely manner or catch price pullback movements (depending on the settings). The indicator settings allow you to adjust the strength of the divergence due to the angle of the RSI peaks and the percentage change in price, which makes it possible to fine-tune the signal strength. The indicator code is optimized and is tested very quickly as par
FREE

The Hydra Multi Trend Dashboard is a powerful market scanning tool designed for MetaTrader 4 and MetaTrader 5. It monitors up to 25 currency pairs or assets simultaneously across all 9 standard timeframes (M1 to Monthly). Using a proprietary Special Trend Formula , the dashboard filters out market noise and provides clear, visual Bullish or Bearish signals, allowing traders to identify trend alignments at a glance without switching charts. Setup & Guide:
Download MT4 Version here. Exclusivel

Indicador para negociação manual e análise técnica para Forex.
Consiste em um indicador de tendência com o nível de abertura do dia de negociação e um indicador de seta para determinar os pontos de entrada.
O indicador não muda de cor; funciona quando a vela fecha.
Contém vários tipos de alertas para setas de sinalização.
Pode ser configurado para funcionar em qualquer gráfico, instrumento de negociação ou período de tempo.
A estratégia de trabalho baseia-se na busca de movimentos de preços ao

Este indicador de multitemporal e símbolo múltiplo identifica formações superiores / inferiores duplas ou triplas ou um rompimento do decote seguinte (superior / inferior confirmado). Ele oferece RSI, barra de pinos, engolfante, pinça, filtros de estrela da manhã / noite, bem como opções de filtro de divergência, o que torna possível filtrar apenas as configurações mais fortes. O indicador também pode ser usado no modo de gráfico único. Por favor, leia mais sobre esta opção no produto bl

NOTE: Turn Pattern Scan ON
This indicator identifies Swing Points, Break of Structure (BoS), Change of Character (CHoCH), Contraction and Expansion patterns which are plotted on the charts It also comes with Alerts & Mobile notifications so that you do not miss any trades. It can be used on all trading instruments and on all timeframes. The non-repaint feature makes it particularly useful in backtesting and developing profitable trading models. The depth can be adjusted to filter swing points.
FREE
Sigma Indicator is used by Sigma Expert advisor for plotting the zones but now its available for members to apply their stratagies on Sigma supply and demand levels.
Instructions:
1- Donot Change time frames instead run several pairs with different time frames with sigma indicator 2- For exness : Search for smaller zone = True
For other brokers keep it False
3- Maximum zone size = 0
4- Minimum zone size = 0
5 - Back candles = 300

This indicator allows to display Renko charts in the indicator window. Renko charts show only price movements that are bigger than the specified box size. It helps to eliminate noise and allows to focus on main trends.
Time is not a factor here. Only price movements are taken into account. That's why Renko chart is not synchronized with the main chart it is attached to. Indicator works in two modes: CLOSE - only close prices are taken into account while building the chart HIGH_LOW - only high/l
FREE

Modificação multimoeda e multitimeframe do indicador ZigZag. Exibe a direção atual do mercado, a altura do último movimento, o número de barras neste movimento e a quebra do ponto anterior do ZigZag (linha horizontal). Este é o scanner MTF.
Você pode especificar quaisquer moedas e prazos desejados nos parâmetros. Além disso, o painel pode enviar notificações quando o ZigZag mudar de direção ou quando houver um rompimento do ponto anterior. Ao clicar em uma célula com ponto final, este símbolo

Indicador de múltiplas moedas e multiprazos Inside Bar (IB). Nos parâmetros, você pode especificar quaisquer moedas e prazos desejados. O painel exibe o último padrão da barra interna (e da barra mãe) encontrado, a posição atual do preço e o rompimento dos níveis das barras mãe e interna. Você pode definir o tamanho e a cor das barras e do texto nas células. O indicador também pode enviar notificações quando os níveis são quebrados. Ao clicar em uma célula com ponto final, o símbolo e ponto fin

Este é um indicador de pregões que pode exibir todos os níveis (Aberto-Alto-Baixo-Fechar) durante quatro sessões. O indicador também pode prever os níveis da sessão. As sessões podem ser desenhadas com linhas ou retângulos (vazios ou preenchidos), as linhas podem ser estendidas para a próxima sessão. Você pode facilmente ocultar/mostrar cada sessão pressionando teclas de atalho (por padrão '1', '2', '3', '4').
Você pode ver linhas ASR (intervalo médio de sessão) (tecla de atalho padrão 'A'

This indicator is specifically designed for boom 1000 index. The indicator contains optimised trend filters to target buy spikes in an uptrend. The indicator also add a grid buy signal to recover some loss of the first buy signal. The indicator also provides exit signals for delayed spikes which can help with risk management .Also it analyses signals for historical data and displays percentage of good signals provided by the indicator. KEY FEATURES Non-lagging indicator. Non-repaint. Enable/d
FREE
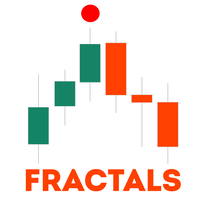
Este indicador foi desenvolvido para exibir fractais no gráfico de preços, ajudando os traders a identificar extremos locais importantes. Os fractais representam pontos específicos no gráfico que seguem a definição clássica: um máximo local é formado quando a vela central é mais alta que as duas adjacentes em ambos os lados, e um mínimo local ocorre quando a vela central é mais baixa que as duas adjacentes. Outros produtos -> AQUI Principais características e benefícios : Exibição flexível — o
FREE

Linear Regression Channel Pro The ultimate tool for statistical trend analysis. Automatically identifies the "Fair Value" of price and volatility extremes. Overview Linear Regression Channel Pro is a professional-grade indicator that automatically draws and updates the Linear Regression Channel for the current market trend. Unlike standard indicators that curve like Bollinger Bands, this tool draws precise straight-line channels based on the "Least Squares" mathematical method. It is designed fo
FREE

Candle Counter é um indicador que imprime o número dos candles desde o primeiro candle do dia. O primeiro candle do dia será o número 1 e cada novo candle será aumentado em 1 nesta contagem.
Parâmetros de entrada Escolha entre par, ímpar ou todos Distância do Candle para imprimir o número Tamanho da fonte do texto Cor da fonte do texto Se você ainda tiver dúvidas, entre em contato comigo por mensagem direta: https://www.mql5.com/pt/users/robsjunqueira/
FREE
O indicador Candle_Timer_and_Spread mostra em um gráfico o tempo até o final da vela e a porcentagem de variação do preço junto com o spread para os símbolos selecionados.
O cronômetro para o tempo até o final da vela no período atual e a variação do preço como uma porcentagem em relação ao preço de abertura do dia está localizado por padrão no canto superior direito do gráfico. O painel mostra o spread e a variação percentual do preço atual em relação à abertura do dia para os símbolos seleci
FREE

BUY INDICATOR AND GET NEW EXCLUSIVE EA FOR FREE AS A BONUS! ITALO ARROWS INDICATOR is the best reversal indicator ever created, and why is that? Using extreme reversal zones on the market to show the arrows and Fibonacci numbers for the Take Profit, also with a panel showing all the information about the signals on the chart, the Indicator works on all time-frames and assets, indicator built after 8 years of experience on forex and many other markets. You know many reversal indicators around t
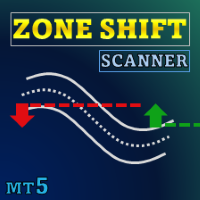
Oferta especial : ALL TOOLS , apenas $35 cada! Novas ferramentas custarão $30 na primeira semana ou para as 3 primeiras compras ! Canal Trading Tools no MQL5 : junte-se ao meu canal no MQL5 para receber as últimas novidades Zone Shift é uma ferramenta de identificação de tendência que utiliza bandas baseadas em EMA/HMA para detectar mudanças de tendência e exibir níveis-chave de reação. Ela mostra a direção da tendência pelas cores das velas e marca retestes importantes com sinais
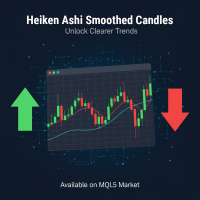
Indicador Heiken Ashi Smoothed para MT5 Heiken Ashi avançado com filtro de suavização. Reduz ruído, elimina falsos sinais e identifica tendências cedo. Ideal para Forex, índices e cripto em H1-D1. Como funciona e como é suavizado? O Heiken Ashi tradicional calcula as velas fazendo a média dos valores de abertura, fechamento, máxima e mínima de períodos anteriores, o que já reduz o impacto de flutuações menores. No entanto, o Heiken Ashi Smoothed eleva esse enfoque ao aplicar um filtro de suaviza
FREE

O Indicador Killzone do Aberto de Nova York da ICT foi desenvolvido para traders que seguem os Conceitos de Smart Money (SMC) , modelos de negociação da ICT e estratégias baseadas em liquidez no mercado Forex . Esta ferramenta marca o Killzone do Aberto de Nova York , que ocorre das 11h às 14h GMT , um horário crítico em que o volume institucional frequentemente leva a grandes movimentações. O indicador destaca faixas de sessão , faixas de formadores de mercado
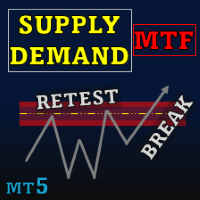
Special offer : ALL TOOLS , just $35 each! New tools will be $30 for the first week or the first 3 purchases ! Trading Tools Channel on MQL5 : Join my MQL5 channel to update the latest news from me Supply Demand Retest and Break Multi Timeframe , esta ferramenta traça zonas de oferta e demanda com base em velas de forte momentum, permitindo que você identifique essas zonas em múltiplos intervalos de tempo usando o recurso timeframe selector . Com etiquetas de reteste e quebra,

This is a simple order block locator. Searched for the existence of order blocks only at extremums. If you want multi criteria order block location check my other indicator which is more powerful here These order blocks are ICT order blocks without any buttering.
The indicator can be a useful tool for detecting reversals, continuations. You can also use the indicator as confluence with your other tools
FREE

O Verve AI Reversal Pro Indicator Pro é o companheiro de trading definitivo para quem exige precisão absoluta e uma compreensão inigualável da dinâmica do mercado. Aproveitando o poder da inteligência artificial de última geração, esta ferramenta sofisticada analisa continuamente a ação do preço, o volume e a volatilidade para identificar pontos de reversão de alta probabilidade antes mesmo de se formarem completamente. Ao combinar de forma fluida algoritmos avançados de machine learning com pr

KT OBV Divergence mostra as divergências regulares e ocultas formadas entre o preço e o oscilador OBV (On Balance Volume).
Recursos
Divergências assimétricas são descartadas para maior precisão e menos poluição visual. Suporta estratégias de trading para reversão de tendência e continuação de tendência. Totalmente compatível e pronto para ser integrado a um Expert Advisor. Pode ser utilizado tanto para entradas quanto para saídas. Todos os tipos de alertas do MetaTrader estão disponíveis.
O qu

The indicator plots a trend channel using the technique by Gilbert Raff. The channel axis is a first-order regression. The upper and lower lines show the maximum distance the Close line had moved away from the axis line. Therefore, the upper and lower lines can be considered as resistance and support lines, respectively. A similar version of the indicator for the MT4 terminal
As a rule, most movements of the price occur within a channel, going beyond the support or resistance line only for a sh
FREE
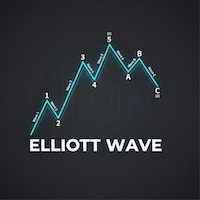
Teoria das Ondas de Elliott Automatizada 1. Contagem automática e redução de viés (Objetividade) Normalmente, a contagem das Ondas de Elliott envolve muita "imaginação" ou opinião pessoal. Este indicador ajuda: Encontrando Ondas de Impulso (1-2-3-4-5): Usa regras estritas (ex: a onda 3 não pode ser a mais curta, a onda 4 não deve sobrepor a onda 1) para mostrar a estrutura correta. Encontrando Ondas Corretivas (A-B-C): Ajuda a identificar retrações para encontrar oportunidades de reentrada na te

Apresentamos o Koala FVG para o MT5: seu indicador profissional de padrões Fair Value Gap (FVG). Koala FVG: Seu Caminho para uma Operação Precisa no MT5 Desbloqueie o potencial do padrão Fair Value Gap (FVG) com o Koala FVG, um indicador de ponta projetado para o MetaTrader 5. Por tempo limitado, acesse gratuitamente esta ferramenta profissional antes que ela se torne um indicador premium. Principais Características: Detecção de Padrões FVG: O Koala FVG identifica inteligentemente Padrões FVG Qu
FREE

Desenvolvido por smart2trader.com Smart Super Trend é um indicador avançado de identificação de tendências, desenvolvido para detectar com alta precisão movimentos de alta e baixa do mercado . O indicador Super Trend da Smart utiliza algoritmos adaptativos combinados com filtros de volatilidade , proporcionando sinais mais limpos e alinhados à dinâmica real do preço. Conta ainda com um sistema inteligente de monitoramento que notifica, em tempo real, sempre que ocorre uma mudança de tendência ,
FREE

This is Heiken Ashi smoothed version, where you can choose on what type smoothness you want to make your strategy base. You can choose between EMA or MA, on the period you want. And you can choose colors.
Definition:
The Heikin-Ashi technique averages price data to create a Japanese candlestick chart that filters out market noise. Heikin-Ashi charts, developed by Munehisa Homma in the 1700s, share some characteristics with standard candlestick charts but differ based on the values used to cre
FREE

Velocity Renko Heatmap is a separate-window indicator that converts standard time-based price series into Renko-style blocks and colors them by momentum speed. Each block represents a fixed Renko box size, while the color intensity reflects how fast the block was formed relative to recent average formation time. Slow movement appears dim/neutral, fast movement becomes more saturated, enabling quick visual assessment of acceleration and deceleration in trend moves. The indicator is designed for t
FREE

Este painel descobre e apresenta as zonas de oferta e procura no gráfico, tanto no modo de escalpelamento como de longo prazo, dependendo da sua estratégia de negociação para os símbolos seleccionados. Além disso, o modo de scanner do painel de controlo ajuda-o a verificar todos os símbolos desejados num relance e a não perder nenhuma posição adequada / Versão MT4 Indicador gratuito: Basic Supply Demand
Características
Permite-lhe ver oportunidades de negociação em vários pares de
VM Breakout BB: Indicador de rompimento baseado em probabilidade com Bandas de Bollinger VM Breakout BB é um indicador de detecção de rompimentos baseado em Bandas de Bollinger combinado com análise estatística de probabilidade (Z-score e a função de distribuição acumulada normal, CDF) e filtros de confirmação inteligentes como RSI, ADX e Volume SMA. O indicador visa entregar sinais com base estatística clara, reduzir ruído e confirmar rompimentos com maior probabilidade de sucesso. Lógica dos s
FREE
O Mercado MetaTrader é um site simples e prático, onde os desenvolvedores podem vender seus aplicativos de negociação.
Nós iremos ajudá-lo a postar e explicar como descrever o seu produto para o mercado. Todos os aplicativos no Mercado são protegidos por criptografia e somente podem ser executados no computador de um comprador. Cópia ilegal é impossível.
Você está perdendo oportunidades de negociação:
- Aplicativos de negociação gratuitos
- 8 000+ sinais para cópia
- Notícias econômicas para análise dos mercados financeiros
Registro
Login
Se você não tem uma conta, por favor registre-se
Para login e uso do site MQL5.com, você deve ativar o uso de cookies.
Ative esta opção no seu navegador, caso contrário você não poderá fazer login.