Regardez les tutoriels vidéo de Market sur YouTube
Comment acheter un robot de trading ou un indicateur
Exécutez votre EA sur
hébergement virtuel
hébergement virtuel
Test un indicateur/robot de trading avant d'acheter
Vous voulez gagner de l'argent sur Market ?
Comment présenter un produit pour qu'il se vende bien
Indicateurs techniques pour MetaTrader 5 - 8
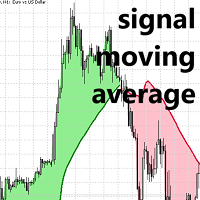
Algorithme Lux de moyenne mobile de signal pour MT5
Découvrez un indicateur de moyenne mobile unique, spécialement conçu pour l'utilisation de lignes de signal dans les systèmes de croisement de moyennes mobiles. Cet outil avancé se distingue par sa divergence par rapport au prix sur les marchés en range, tout en reproduisant fidèlement une moyenne mobile standard sur les marchés en tendance. Cette caractéristique permet aux traders d'éviter les perturbations inutiles et les sur-tradings poten
FREE

Filigrane centralisé
Ajoute un filigrane centré avec le nom de l'actif et la période choisie.
Il est possible de remplacer le type de police, la taille de police, la couleur de police et le caractère de séparation.
Le filigrane est positionné derrière les bougies, ne perturbant pas la visualisation.
Il a un recentrage automatique si la fenêtre est redimensionnée.
J'espère que cet indicateur vous aidera, bon trading ;)
FREE

This indicator displays Pivot-Lines, preday high and low, preday close and the minimum and maximum of the previous hour. You just have to put this single indicator to the chart to have all these important lines, no need to setup many single indicators.
Why certain lines are important Preday high and low : These are watched by traders who trade in a daily chart. Very often, if price climbs over or falls under a preday low/high there is an acceleration in buying/selling. It is a breakout out of a
FREE

Benefits and Usage of the Volume Bubble Tool This tool, (one of my favorites by Algo Alpha, from Tradingview) provides an advanced method of volume analysis by moving beyond traditional histograms. It leverages statistical normalization (Z-score) on lower-timeframe data to identify and classify statistically significant volume events, visualizing the dynamic between "Smart Money" (institutional) and "Retail" participants. Core Benefits Intuitive On-Chart Visualization: By plotting volume as bub
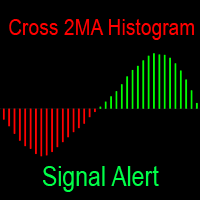
L'indicateur montre la différence entre les deux moyennes mobiles sous la forme d'un histogramme. Les moyennes mobiles ont d'énormes possibilités de personnalisation. Alertes par tous les moyens lorsque vous changez la couleur de l'histogramme: bips dans le terminal, envoie une notification au téléphone et une lettre à la poste-maintenant vous ne manquerez pas la transaction. Indicateur d'intersection des moyennes mobiles entièrement gratuit sous la forme de lignes sur le graphique: https://www.
FREE

Modification multidevises et multitemporelles de l'oscillateur stochastique. Vous pouvez spécifier les devises et les délais souhaités dans les paramètres. Le panneau affiche les valeurs actuelles et les intersections des lignes — Signal et Principal (croisement stochastique). En outre, l'indicateur peut envoyer des notifications lors du franchissement des niveaux de surachat et de survente. En cliquant sur une cellule avec un point, ce symbole et ce point seront ouverts. Il s'agit du scanner M
Version Expert Advisor Si vous préférez le trading automatisé plutôt que les signaux manuels, vous pouvez trouver la version Expert Advisor de cet indicateur ici : https://www.mql5.com/en/market/product/148310
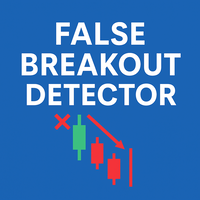
False Breakout Detector est un indicateur conçu pour détecter les situations où le prix dépasse brièvement un niveau de support ou de résistance récent, puis revient rapidement dans la plage précédente. Ces fausses cassures peuvent être utiles pour une analyse discrétionnaire ou des stra
FREE
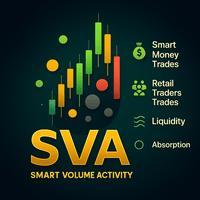
Smart Volume Activity [SVA] is an advanced analytical indicator designed for MetaTrader platforms. It reveals how institutional (Smart Money) and retail traders operate by analyzing volume behavior across multiple timeframes . Unlike ordinary volume tools, SVA automatically adapts to any chart timeframe and highlights zones of absorption — moments when large market participants absorb liquidity from weaker hands. By detecting abnormal volume spikes far beyond typical market noise, it distinguish
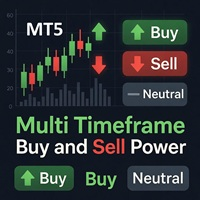
Multi Timeframe Buy and Sell Power
The Multi Timeframe Buy and Sell Power indicator for MetaTrader 5 is a versatile tool designed to provide traders with a clear visual representation of market pressure across nine standard timeframes, from M1 to MN1. By aggregating buy and sell strength percentages derived from recent price action and tick volume, it helps identify potential trends, reversals, and neutral conditions in real-time. The indicator displays this information in a compact dashboard
FREE

VISUAL ATR CANDLESTICK SCANNER PRO - Reconnaissance de Modèles Améliorée Le Visual ATR Candlestick Scanner Pro est un indicateur conçu pour identifier et filtrer automatiquement les modèles de chandeliers courants, offrant une vue plus claire des potentiels retournements ou continuations du marché. I. Caractéristiques Clés et Fonctionnalité 1. Reconnaissance Automatisée des Modèles de Chandeliers L'indicateur reconnaît automatiquement plus de 25 modèles de chandeliers professionnels, classés en
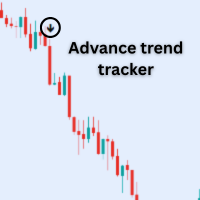
Features: 1. Buy arrows= when Up trend start. 2.Sell arrows = when Down trend start 3.Alert System= when Signal appear then Mt5 itself Pop up a alert Box. 4. You can get notifications on your phone real time through Mt5 app.
Note: this indicator will work on trending market. So try to trade volatile market.
Best Pair: Only trade in New York session NASDAQ (US100) S&P ( US500) Dow Jones (US30)
Note : Don't Trade Forex pair.
FREE

tendance,analyse de tendance,signaux,alertes,panneau de trading,tableau de bord,contexte de marché,scalping,day trading,intraday,swing trading,sans repaint,sans recalcul,gestion du risque,risque rendement,support résistance,zones offre demande,pression achat vente,forex,crypto,multi timeframe
QuantumTrade Panel est un indicateur avancé pour MetaTrader 5 conçu pour fournir un contexte de marché complet en temps réel, regroupant tendance, zones d’équilibre, pression acheteuse et vendeuse, risque
FREE

Le KT HalfTrend est un indicateur de tendance basé sur une moyenne mobile qui trace des zones sur le graphique. Il indique un changement de tendance en affichant des zones d’invalidation haussières et baissières. Il affiche également la force d’achat et de vente avec des flèches sur le graphique principal. Lorsque la tendance est absente, l’indicateur devient plat, ce qui reflète une phase d’accumulation, de distribution ou de consolidation temporaire. En présence d’une tendance, une pente appar
Nous vous présentons un indicateur révolutionnaire qui change les règles du jeu dans le monde du trading de tendance. L'indicateur est conçu pour repenser les performances et élever votre expérience de trading à un niveau sans précédent. Notre indicateur dispose d'une combinaison unique de fonctionnalités avancées qui le distinguent de ses concurrents. La technologie de pointe "Real Pricing Factors" offre une durabilité inégalée, même dans les conditions de marché les plus difficiles et les plus

The Volume Weighted Average Price is similar to a moving average, except volume is included to weight the average price over a period. Volume-Weighted Average Price [VWAP] is a dynamic, weighted average designed to more accurately reflect a security’s true average price over a given period . Mathematically, VWAP is the summation of money (i.e., Volume x Price) transacted divided by the total volume over any time horizon, typically from market open to market close.
VWAP reflects the capitali
FREE
The Omega Trend Indicator is an advanced tool that has been specifically designed to detect market trends early, and follow them efficiently. The indicator draws two lines. The main (thicker) Trend Line represents the presumed lower or upper volatility limits of the current market trend. A break in the main Trend Line indicates a potential reversal or shift in the movement of the trend. The Trend Line also indicates the best point to place a stop loss order. In Omega Trend Indicator, the Trend L
FREE

The Forex Master Pattern is an alternative form of technical analysis that provides a framework which will help you to find and follow the hidden price pattern that reveals the true intentions of financial markets. This algorithm here does a good job detecting the Phase 1 of the Forex Master Pattern cycle, which is the contraction point (or Value).
On Phase 2 we get higher timeframe activation (also called Expansion), which is where price oscillates above and below the average price defined

Ichimoku Trend Alert is the Ichimoku Kinko Hyo indicator with Alerts and signal filters.
Ichimoku Trend Alert features: Optional check of Ichimoku cloud, Tenkan sen(Conversion Line), Kijun sen(Base Line), Senkou span A, Senkou span B, and Chikou span relative to price, and more. Popup, email, and phone notification alerts for selected symbols and timeframes.
There are 9 classic Ichimoku trend filters you can enable/disable in settings: Price/Cloud Order: Checks the price position relative to
FREE

Savoir où sont les niveaux importants comme les plus hauts et bas du jours précédent ou de la semaine permettent une meilleur prise de setup de trading.
Cet indicateur permet d'afficher Haut et bas du jour précédent Haut et bas de la semaine précédente
Congifuration High & Low for: Previous day, week Line Style, color Label position, size, color Questions, commentaires, envoyez moi un message en direct ici: https://www.mql5.com/en/users/mvonline
FREE

Calculateur de Lot & Risque PRO MT5 (v2.20) Position Size Calculator PRO est un outil professionnel de gestion des risques pour MetaTrader 5 qui calcule le volume de lot recommandé en fonction de votre risque par transaction, de la distance de votre Stop Loss et des spécifications du symbole (valeur du tick, taille du tick, volume min/max/step, marge). Aucune opération de trading : cet indicateur n'ouvre ni ne ferme d'ordres et ne gère pas les positions. C'est un outil d'aide à la décision pour

An ICT fair value gap is a trading concept that identifies market imbalances based on a three-candle sequence. The middle candle has a large body while the adjacent candles have upper and lower wicks that do not overlap with the middle candle. This formation suggests that there is an imbalance where buying and selling powers are not equal. Settings Minimum size of FVG (pips) -> FVGs less than the indicated pips will be not be drawn Show touched FVGs Normal FVG color -> color of FVG that hasn't
FREE
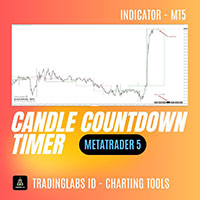
Candle Timer Countdown (CTC) – Minimalist & Precise Candle Timer Candle Timer Countdown (CTC) is a lightweight and non-intrusive MetaTrader indicator that displays the remaining time of the current candlestick on your chart. Designed with simplicity and clarity in mind, this tool helps traders stay aware of candle closures without cluttering the chart. Key Features: Real-Time Candle Countdown
Always know how many seconds are left before the current candle closes – works on all timeframes. Minima
FREE
Indicateur Market Structure ICT 1. Structure de Marché Automatisée Le plus grand avantage est de réduire les erreurs dues à l'interprétation subjective. Identification précise de la tendance : Identifie automatiquement les BOS (Break of Structure) pour la continuation et les CHoCH (Change of Character) pour le retournement. Classification des Swings : L'utilisateur peut choisir le type de structure (Court, Moyen, Long terme), idéal pour les Scalpers et les Swing Traders. 2. Tableau de Bord Profe

The indicator draws supply and demand zones. The zone timeframe can be set independently of the chart timeframe. For instance, it is possible to set M5 zones on an H4 chart. The importance of zones can be adjusted using the zone strength parameter. Demand zones are displayed if at least one candle in the range of the zone is entirely above the zone. Similarly, supply zones are displayed if at least one candle within the zone is entirely below the zone.
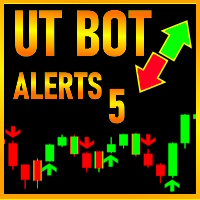
Good old UT BOT converted from TradingView script by ' QuantNomad ', initially by ' Yo_adriiiiaan ' and ' HPotter ' - so you can bet this is powerful tool. If you know, you know. This is top of the line, while keeping it really simple.
Main function: trend identification with trend switch points , created by EMA(source) and ATR -source is CLOSE PRICE with option to use HEIKEN ASHI chart instead, for this you need "Heiken Ashi" indicator - its available as free download by MetaQuotes
One of th

OBV MACD
Calculating MACD based on OBV data Features
3 outputs: MACD & Signal & Histogram 4 Colored Histogram Smoothing factor show/hide option for MACD & Signal lines Description
Among the few indicators developed for working with volume data, OBV (On Balance Volume) is the simplest yet most informative one. Its logic is straightforward: when the closing price is above the previous close, today's volume is added to the previous OBV; conversely, when the closing price is below the previous close
FREE

The indicator is designed for easy construction of synthetic charts based on data of various financial instruments. It will be useful both arbitrage and pair trading, as well as for analysis purposes. Its main advantage is simplicity and clarity. Each chart is given as a common mathematical formula. For example, if you want to plot the spread (difference) between EURUSD and GBPUSD with coefficients 4 and 3, then set the following formula: EURUSD * 4 - GBPUSD * 3 The resulting chart is shown in t
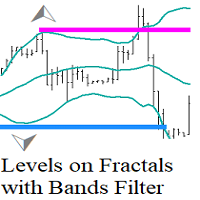
Levels on Fractals with Bands Filter est un outil d'analyse technique qui utilise une combinaison de fractales et de l'indicateur Bollinger Bands pour identifier les niveaux de support et de résistance.
L'outil Levels on Fractals with Bollinger Bands Filter est un outil d'analyse technique qui utilise une combinaison de fractales et de l'indicateur Bollinger Bands pour identifier les niveaux de support et de résistance.
Comment l'utiliser.
Lorsqu'une fractale se forme derrière la bande de B
FREE

A professional tool for trading - the divergence indicator between the RSI and the price, which allows you to receive a signal about a trend reversal in a timely manner or catch price pullback movements (depending on the settings). The indicator settings allow you to adjust the strength of the divergence due to the angle of the RSI peaks and the percentage change in price, which makes it possible to fine-tune the signal strength. The indicator code is optimized and is tested very quickly as par
FREE

Bonjour les gars, voici The Rangers Fx Nous avons réussi à créer un indicateur pour détecter les pics sur l'indice Boom 1000, l'indice Boom 500 et l'indice Boom 300. En fait, cet indicateur indique tous les booms disponibles et les autres à venir. Comment utiliser cet indicateur Tout d'abord, vous devez transformer votre délai en délai M1/M5, cet indicateur vous enverra une alerte indiquant quand effectuer vos transactions d'achat et quand quitter/clôturer vos transactions (X) et n'ayez pas peur

The Multi Pairs Forex Indicator is an advanced trading too l that allows traders to track and analyze the performance of multiple currency pairs in real-time on a single chart. It consolidates data from various Forex pairs, providing an at-a-glance overview of market conditions across different currencies and helps you save time. Useful for various trading styles, including scalping, day trading, and swing trading. Whether you're monitoring major pairs like EUR/USD, GBP/USD, or more exoti

Permettez-moi de vous présenter le Golden Sniper Indicator , un puissant outil MQL5 soigneusement conçu pour les traders souhaitant améliorer leur expérience de trading. Développé par une équipe de traders chevronnés avec plus de 6 ans d’expertise , cet indicateur offre une méthode fiable pour identifier des opportunités de trading avec une précision remarquable. Principales caractéristiques : Alertes et flèches de signal : Le Golden Sniper Indicator fournit des alertes en temps opportun et des

Multicurrency and multitimeframe modification of the indicator Bollinger Bands. On the dashboard you can see breakouts and touches of the Bollinger Bands. In the parameters you can specify any desired currencies and timeframes. The indicator can also send notifications when the price touches the Bollinger Bands, when the current volatility changes (expands or falls), and when the price touches all the bands. By clicking on a cell with a period, this symbol and period will be opened. This is MTF

MA3 Trend MT5 - is the good trend indicator on three MAs . Benefits of the indicator: The indicator produces signals with high accuracy.
The confirmed signal of the indicator does not disappear and is not redrawn.
You can trade on the MetaTrader 5 trading platform of any broker.
You can trade any assets (currencies, metals, cryptocurrencies, stocks, indices etc.).
You can trade on any timeframes (M5-M15 scalping and day trading / M30-H1 medium-term trading / H4-D1 long-term trading). Indi
FREE

The Hydra Multi Trend Dashboard is a powerful market scanning tool designed for MetaTrader 4 and MetaTrader 5. It monitors up to 25 currency pairs or assets simultaneously across all 9 standard timeframes (M1 to Monthly). Using a proprietary Special Trend Formula , the dashboard filters out market noise and provides clear, visual Bullish or Bearish signals, allowing traders to identify trend alignments at a glance without switching charts. Setup & Guide:
Download MT4 Version here. Exclusivel

Indicateur de trading manuel et d'analyse technique pour le Forex.
Il se compose d'un indicateur de tendance avec le niveau d'ouverture du jour de bourse et d'un indicateur de flèche pour déterminer les points d'entrée.
L'indicateur ne se recolore pas ; il fonctionne lorsque la bougie se ferme.
Contient plusieurs types d'alertes pour les flèches de signalisation.
Peut être configuré pour fonctionner sur n’importe quel graphique, instrument de trading ou période.
La stratégie de travail est bas

AW Super Trend -C'est l'un des indicateurs de tendance classiques les plus populaires. Il a un réglage simple, vous permet non seulement de travailler avec la tendance, mais affiche également le niveau de stop loss, qui est calculé par cet indicateur. Avantages:
Instruments: Paires de devises , actions, matières premières, indices, crypto-monnaies. Délai : М15 et supérieur. Temps de négociation : 24 heures sur 24. Affiche la direction de la tendance actuelle. Calcule le stop loss. Il
FREE

VM Breakout BB : Indicateur de breakout basé sur la probabilité avec Bandes de Bollinger VM Breakout BB est un indicateur de détection de breakouts basé sur les Bandes de Bollinger, combiné à une analyse statistique de probabilité (Z-score et fonction de répartition normale cumulative, CDF) et à des filtres de confirmation intelligents tels que le RSI, l’ADX et la moyenne mobile du volume (Volume SMA). L’indicateur vise à fournir des signaux avec une base statistique claire, réduire le bruit et
FREE

NOTE: Turn Pattern Scan ON
This indicator identifies Swing Points, Break of Structure (BoS), Change of Character (CHoCH), Contraction and Expansion patterns which are plotted on the charts It also comes with Alerts & Mobile notifications so that you do not miss any trades. It can be used on all trading instruments and on all timeframes. The non-repaint feature makes it particularly useful in backtesting and developing profitable trading models. The depth can be adjusted to filter swing points.
FREE
L'indicateur Candle_Timer_and_Spread affiche sur un graphique le temps jusqu'à la fin de la bougie et le pourcentage de variation de prix ainsi que le spread pour les symboles sélectionnés.
Le minuteur pour le temps jusqu'à la fin de la bougie sur la période actuelle et la variation du prix en pourcentage par rapport au prix d'ouverture du jour est situé par défaut dans le coin supérieur droit du graphique. Le panneau affiche l'écart et la variation en pourcentage du prix actuel par rapport à
FREE

Phoenix Auto Fibonacci Monitor (MT5)
Outil professionnel d'analyse Fibonacci et des fluctuations pour MetaTrader 5. Détecte automatiquement les fluctuations dominantes du marché et fournit des informations avancées sur les retracements de Fibonacci grâce à un tableau de bord visuel en temps réel.
Présentation
Phoenix Auto Fibonacci Monitor identifie automatiquement les fluctuations majeures du marché à l'aide d'un pivot à intervalle de temps supérieur et d'une validation ATR, puis trace des n
FREE

Ce indicateur est conçu pour afficher des fractales sur le graphique des prix, aidant ainsi les traders à identifier les extrêmes locaux importants. Les fractales sont des points particuliers sur le graphique qui correspondent à la définition classique : un maximum local est formé lorsque la bougie centrale est plus haute que les deux bougies voisines de chaque côté, et un minimum local est formé lorsque la bougie centrale est plus basse que les deux bougies voisines. Autres produits -> ICI Pri
FREE

Cet indicateur à plusieurs périodes et à plusieurs symboles identifie les formations haut/bas doubles ou triples ou une cassure de décolleté suivante (haut/bas confirmé). Il offre des filtres RSI, pin bar, engloutissant, pince à épiler, étoile du matin/soir ainsi que des options de filtre de divergence qui permettent de filtrer uniquement les configurations les plus fortes. L'indicateur peut également être utilisé en mode graphique unique. Veuillez en savoir plus sur cette option dans le p

This indicator allows to display Renko charts in the indicator window. Renko charts show only price movements that are bigger than the specified box size. It helps to eliminate noise and allows to focus on main trends.
Time is not a factor here. Only price movements are taken into account. That's why Renko chart is not synchronized with the main chart it is attached to. Indicator works in two modes: CLOSE - only close prices are taken into account while building the chart HIGH_LOW - only high/l
FREE

Candle Counter is an indicator that prints the number of candles from the first candle of the day . The first candle of the day will be the number 1 and each new candle will be increased by 1 in this count.
Input Parameters Choose from even, odd or all Distance from candle to Print the number Text Font Size Text Font Color
If you still have questions, please contact me by direct message: https://www.mql5.com/en/users/robsjunqueira/
FREE
Sigma Indicator is used by Sigma Expert advisor for plotting the zones but now its available for members to apply their stratagies on Sigma supply and demand levels.
Instructions:
1- Donot Change time frames instead run several pairs with different time frames with sigma indicator 2- For exness : Search for smaller zone = True
For other brokers keep it False
3- Maximum zone size = 0
4- Minimum zone size = 0
5 - Back candles = 300

Multicurrency and multitimeframe modification of the ZigZag indicator. Displays the current direction of the market, the height of the last movement, the number of bars in this movement and the breaking of the previous point of the ZigZag (horizontal line). This is MTF Scanner, you can actually see the supply and demand levels.
You can specify any desired currencies and timeframes in the parameters. Also, the panel can send notifications when the ZigZag changes direction or when there was a br

Multicurrency and multi-timeframe indicator Inside Bar (IB). In the parameters, you can specify any desired currencies and timeframes. The panel displays the last found Inside Bar (and Mother Bar) pattern, the current price position and the breakout of the levels of the Mother and Inside Bars. You can set the size and color for bars and text in the cells. The indicator can also send notifications when levels are broken. The dashboard highlights Double Inside Bar in a special color. By clicking

This is a derivative of John Carter's "TTM Squeeze" volatility indicator, as discussed in his book "Mastering the Trade" (chapter 11).
Gray dot on the midline show that the market just entered a squeeze (Bollinger Bands are with in Keltner Channel). This signifies low volatility, market preparing itself for an explosive move (up or down). Blue dot signify "Squeeze release".
Mr.Carter suggests waiting till the first blue after a gray dot, and taking a position in the direction of the moment
FREE

To get access to MT4 version please click https://www.mql5.com/en/market/product/130055  ; - This is the exact conversion from TradingView: "Ut Alart Bot Indicator". - You can message in private chat for further changes you need. Here is the source code of a simple Expert Advisor operating based on signals from Ut Bot Indicator . #property copyright "This EA is only education purpose only use it ur own risk" #property link " https://sites.google.com/view/automationfx/home " #property versio
FREE

Grebenka - помощник для разметки графика.
Функционал: 1. позволяет непрерывно рисовать линии ZigZag в ручном режиме, используя клики мышкой. 2. позволяет включать режим, при котором любая трендовая линия с которой в данный момент проводится манипуляция, выравнивается по горизонтали.
Горячие клавиши: [Z] - включение/выключение режима рисования линий ZigZag вручную [X] - включение/выключение режима горизонтальной трендовой линии [C] - быстрая смена цвета линий ZigZag [Del] - стандартная клавиш
FREE

Velocity Renko Heatmap is a separate-window indicator that converts standard time-based price series into Renko-style blocks and colors them by momentum speed. Each block represents a fixed Renko box size, while the color intensity reflects how fast the block was formed relative to recent average formation time. Slow movement appears dim/neutral, fast movement becomes more saturated, enabling quick visual assessment of acceleration and deceleration in trend moves. The indicator is designed for t
FREE

This is an indicator of trading sessions that can display all levels (Open-High-Low-Close) for four sessions . The indicator can also predict session levels. Sessions can be drawn with lines or rectangles (empty or filled), lines can be extended to the next session. You can easily hide/show each session by pressing hotkeys (by default '1', '2', '3', '4'). You can see ASR (Average Session Range) lines (default hotkey 'A'). This is similar to the ADR calculation, only it is calculated based on

Custom Spread Indicator *Please write a review, thanks!
Also MT4 version is available
Spread Indicator show the current spread in pips with color codes. Handle 3 levels, Low, Medium, High. You can set levels and colors for each level (eg. Low: Green, Medium: Orange, High: Red), and can choose display position on the chart.
There is two spread calculation mode: -> Server spread value -> Ask - Bid value
Can set opacity, for better customization. When spread jump bigger, then display do not
FREE

An MT5 divergence scanner that automatically finds divergence / hidden divergence between price and a chosen oscillator , then draws the matching trendlines/channels in the indicator window and can alert you when the line is crossed. Key features (simple) Auto Divergence Detection Bullish divergence : price makes a lower low while oscillator makes a higher low (possible reversal up). Bearish divergence : price makes a higher high while oscillator makes a lower high (possible reversal down). Hidd
FREE

Cybertrade Auto Fibonacci retraction and projection - MT5
Auto Fibonacci is an indicator that automatically plots the Fibonacci retracement and projection based on the number of bars you select in the indicator setting. You can customize nine different levels of retraction and three levels of projection. It works on periods longer than the period visible on the chart. All values are available in the form of buffers to simplify possible automations. This indicator is the same one we use in ou
FREE
Offre spéciale : ALL TOOLS , seulement 35 $ chacun ! Les nouveaux outils seront à 30 $ pendant la première semaine ou pour les 3 premiers achats ! Chaîne Trading Tools sur MQL5 : rejoignez ma chaîne MQL5 pour recevoir mes dernières actualités Zone Shift est un outil d’identification de tendance utilisant des bandes basées sur EMA/HMA pour détecter les inversions de tendance et afficher les niveaux de réaction clés. Il indique la direction de la tendance via les couleurs des bougie

L' indicateur ICT NewYork Open Killzone est conçu pour les traders qui suivent les concepts Smart Money (SMC) , les modèles de trading ICT et les stratégies basées sur la liquidité sur le marché Forex . Cet outil mesure la Killzone de l'Open de New York , qui s'étend de 11h00 à 14h00 GMT , une période critique où le volume institutionnel entraîne souvent des fluctuations majeures. L'indicateur met en évidence les fourchettes de séance , les fourchettes des teneu

Verve AI Reversal Pro Indicator Pro est le compagnon de trading ultime pour ceux qui exigent une précision chirurgicale et une compréhension inégalée de la dynamique des marchés. Exploitant la puissance de l’intelligence artificielle de pointe, cet outil sophistiqué analyse en continu l’action des prix, le volume et la volatilité pour repérer les points de retournement à haute probabilité avant même leur formation complète. En mariant sans effort des algorithmes avancés d’apprentissage automati

KT OBV Divergence affiche les divergences régulières et cachées qui se forment entre le prix et l’oscillateur OBV (On Balance Volume).
Fonctionnalités
Les divergences asymétriques sont ignorées pour plus de précision et moins d'encombrement visuel. Prend en charge des stratégies de trading de retournement et de continuation de tendance. Entièrement compatible et prêt à être intégré dans un Expert Advisor. Peut être utilisé pour les entrées comme pour les sorties de position. Inclut toutes les a
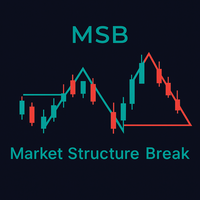
Indicator Guide: Key Price Levels & Structure Shifts 1. Description The indicator is a technical analysis tool for the MetaTrader 5 platform. It is designed to automatically identify specific price movements and to highlight corresponding price zones based on preceding price action. This provides a visualization of key price areas according to the indicator's internal logic. 2. Visual Elements & Their Identification The indicator identifies and draws several types of visual elements on the chart
FREE

This is Heiken Ashi smoothed version, where you can choose on what type smoothness you want to make your strategy base. You can choose between EMA or MA, on the period you want. And you can choose colors.
Definition:
The Heikin-Ashi technique averages price data to create a Japanese candlestick chart that filters out market noise. Heikin-Ashi charts, developed by Munehisa Homma in the 1700s, share some characteristics with standard candlestick charts but differ based on the values used to cre
FREE

Price Volume Trend (PVT) Oscillator Description: The PVT Oscillator is a volume indicator that serves as an alternative to the standard On-Balance Volume (OBV). While ordinary volume indicators can be noisy and hard to read, this tool converts volume flow into a clear Histogram Oscillator, similar to a MACD, but for Volume. It is designed to detect first Trend Reversals and Divergences by analyzing the difference between a Fast and Slow PVT moving average. Why is this better than standard OBV?
FREE

This is a simple order block locator. Searched for the existence of order blocks only at extremums. If you want multi criteria order block location check my other indicator which is more powerful here These order blocks are ICT order blocks without any buttering.
The indicator can be a useful tool for detecting reversals, continuations. You can also use the indicator as confluence with your other tools
FREE

Institutional Liquidity Sweep & Stop Hunt Detector The FAKEOUT MATRIX PRO is a professional-grade analytical tool designed to identify the exact moments when institutional players "trap" retail traders. By monitoring session extremes and detecting high-probability Liquidity Sweeps, this indicator provides the technical edge needed to trade reversals with precision. The Institutional Logic Large financial institutions require significant liquidity to fill their orders. They often find this liquid
FREE

Ce tableau de bord découvre et affiche les zones d'offre et de demande sur le graphique, à la fois en mode scalping et à long terme, en fonction de votre stratégie de trading pour les symboles sélectionnés. En outre, le mode scanner du tableau de bord vous permet de vérifier tous les symboles souhaités en un coup d'œil et de ne manquer aucune position appropriée / Version MT4
Indicateur gratuit: Basic Supply Demand
Caractéristiques Permet de visualiser les opportunités de tradin

The indicator plots a trend channel using the technique by Gilbert Raff. The channel axis is a first-order regression. The upper and lower lines show the maximum distance the Close line had moved away from the axis line. Therefore, the upper and lower lines can be considered as resistance and support lines, respectively. A similar version of the indicator for the MT4 terminal
As a rule, most movements of the price occur within a channel, going beyond the support or resistance line only for a sh
FREE

Fair Value Gap Finder detects fair value gaps and generates a signal when price returns to one. Set the minimum and maximum fvg size, customize the colors, style, and length, then let the indicator highlight them for you.
Key Features: Automatic FVG highlights - The indicator detects all fair value gaps that fit your criteria and marks them on the chart.
Entry Signal - A signal is created whenever price retests a fair value gap.
Notification - Alerts notify you when a fair value gap or a new
FREE

Bar Countdown is a simple indicator for MetaTrader 5 that shows the time remaining of the each candle. It can be placed in any corner of the chart or near of the price close and it'll help you to know
if the current candle is ending. Choose the counter format between HR:MIN:SEC and MIN:SEC It is so easy to use, configure the color, size and counter position on the chart and that's it!!! The Countdown starts now!
Updates: 2021/02/28; v1.0: Initial release 2021/03/16; v1.1: Minor code changes
FREE

Sonic R Indicator Description Overview The Sonic R Indicator for MT5 is designed to help traders analyze market trends using moving averages and volume analysis. This tool assists in identifying potential price movements by displaying trend zones and volume strength, making it suitable for various trading strategies. Key Features Dual EMA Trend Channels – Uses 34-period Exponential Moving Averages (EMA) to visualize price movement. Volume Analysis – A color-coded histogram to indicate changes i
Découvrez comment acheter un robot de trading sur le MetaTrader Market, le magasin d'applications de la plateforme MetaTrader.
e système de paiement de MQL5.community prend en charge les transactions via PayPal, les cartes bancaires et les systèmes de paiement populaires. Nous vous recommandons vivement de tester le robot de trading avant de l'acheter, pour une meilleure expérience client.
Vous manquez des opportunités de trading :
- Applications de trading gratuites
- Plus de 8 000 signaux à copier
- Actualités économiques pour explorer les marchés financiers
Inscription
Se connecter
Si vous n'avez pas de compte, veuillez vous inscrire
Autorisez l'utilisation de cookies pour vous connecter au site Web MQL5.com.
Veuillez activer les paramètres nécessaires dans votre navigateur, sinon vous ne pourrez pas vous connecter.