Guarda i video tutorial del Market su YouTube
Come acquistare un Robot di Trading o un indicatore
Esegui il tuo EA
hosting virtuale
hosting virtuale
Prova un indicatore/robot di trading prima di acquistarlo
Vuoi guadagnare nel Market?
Come presentare un prodotto per venderlo con successo
Indicatori tecnici per MetaTrader 5 - 8

Volume Footprint Analysis is a precision-engineered, volume-based indicator that transforms raw market volume into an intuitive, color-coded signal system. Built on concepts from Volume Spread Analysis (VSA) and Smart Money principles, this tool removes the guesswork from volume interpretation and gives traders clear, actionable insights on when to buy or sell — on any timeframe and across any trading instrument. MT4 Version - https://www.mql5.com/en/market/product/138564/ Join To Learn Mark

Capture every opportunity: your go-to indicator for profitable trend trading Trend Trading is an indicator designed to profit as much as possible from trends taking place in the market, by timing pullbacks and breakouts. It finds trading opportunities by analyzing what the price is doing during established trends. [ Installation Guide | Update Guide | Troubleshooting | FAQ | All Products ]
Trade financial markets with confidence and efficiency Profit from established trends without getting whip
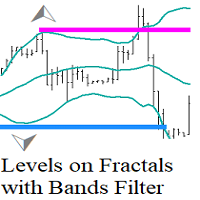
Levels on Fractals with Bands Filter questi sono livelli basati su frattali filtrati con l'indicatore Bollinger Bands.
Il Levels on Fractals with Bollinger Bands Filter è uno strumento di analisi tecnica che utilizza una combinazione di frattali e l'indicatore Bollinger Bands per identificare i livelli di supporto e resistenza.
Come si usa.
Quando un frattale si forma dietro la banda di Bollinger esterna (breakout della volatilità) indica che il prezzo ha raggiunto un livello estremo e potr
FREE
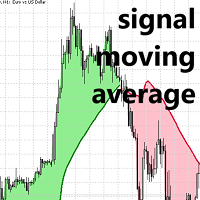
Algoritmo Lux per la media mobile Signal per MT5
Scopri un indicatore di media mobile unico, progettato specificamente per l'utilizzo della linea di segnale nei sistemi di crossover di media mobile. Questo strumento avanzato si differenzia divergendo dal prezzo nei mercati in range, mentre rispecchia fedelmente una media mobile standard nei mercati in trend. Questa caratteristica aiuta i trader a evitare rumore di fondo inutile e potenziale overtrading dovuto alle fluttuazioni del mercato.
La
FREE

FOR CRASH 500 ONLY!! MT5
*This is a smooth heiken ashi setup meant to be used on CRASH 500 in combination with other indicators. *You are welcome to test it on other markets aswell. *I will be posting other indicators aswell to help with trading the crash 500 market. *You can use this to help smooth out price if you do struggle with reading the charts as is. * Just note heiken ashi doesnt represent real price action only smoothes it out for ease of read.
FREE
** All Symbols x All Time frames scan just by pressing scanner button ** After 18 years of experience in the markets and programming, Winner indicator is ready. I would like to share with you! *** Contact me to send you " Trend Finder indicator " free, instruction and add you in "M1 Signal Scanner group" for sharing or seeing experiences with other users. Introduction: M1 Signal Scanner is the indicator designed scalping M1 time frame to detect Small trend switching in the direction

Benefits and Usage of the Volume Bubble Tool This tool, (one of my favorites by Algo Alpha, from Tradingview) provides an advanced method of volume analysis by moving beyond traditional histograms. It leverages statistical normalization (Z-score) on lower-timeframe data to identify and classify statistically significant volume events, visualizing the dynamic between "Smart Money" (institutional) and "Retail" participants. Core Benefits Intuitive On-Chart Visualization: By plotting volume as bub

- Real price is 200$ - 50% Discount (It is 99$ now) - It is enabled for 4 purchases. Contact me for extra bonus (Gann Trend indicator), instruction or any questions! - Non-repaint, No lag - I just sell my products in Elif Kaya Profile, any other websites are stolen old versions, So no any new updates or support. - Lifetime update free Gann Gold EA MT5 Introduction W.D. Gann’s theories in technical analysis have fascinated traders for decades. It offers a unique approach beyond traditional cha

Il Weis Wave Scouter Basic è la versione essenziale del nostro rinomato indicatore per MetaTrader 5, progettato per i trader che desiderano esplorare i concetti del metodo Wyckoff e dell'analisi VSA (Volume Spread Analysis) in modo accessibile ed efficiente. Basato sulla lettura delle onde di volume, questo indicatore semplificato consente di identificare chiaramente i movimenti di mercato, concentrandosi sui principi di sforzo vs risultato e domanda e offerta, come insegnato da Richard Wyckoff.
FREE
Smart Volume Activity [SVA] is an advanced analytical indicator designed for MetaTrader platforms. It reveals how institutional (Smart Money) and retail traders operate by analyzing volume behavior across multiple timeframes . Unlike ordinary volume tools, SVA automatically adapts to any chart timeframe and highlights zones of absorption — moments when large market participants absorb liquidity from weaker hands. By detecting abnormal volume spikes far beyond typical market noise, it distinguish
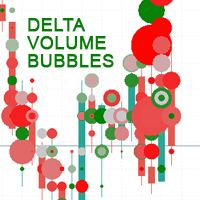
Delta Volume Bubbles è un indicatore avanzato per MetaTrader 5 progettato per visualizzare in modo chiaro e intuitivo la pressione di acquisto e vendita sul mercato. Attraverso bolle colorate e dinamiche, mostra in tempo reale la differenza tra volumi in buy e sell (Delta Volume), aiutando il trader a individuare zone di forte squilibrio tra domanda e offerta. L’indicatore rappresenta una forma visiva del flusso degli ordini (order flow) , semplificando l’analisi volumetrica anche per chi non di
FREE

VISUAL ATR CANDLESTICK SCANNER PRO - Riconoscimento di Pattern Migliorato Il Visual ATR Candlestick Scanner Pro è un indicatore progettato per identificare e filtrare automaticamente i comuni pattern di candele, fornendo una visione più chiara di potenziali inversioni o continuazioni del mercato. I. Caratteristiche Principali e Funzionalità 1. Riconoscimento Automatico dei Pattern di Candele L'indicatore riconosce automaticamente oltre 25 pattern di candele professionali, classificati in gruppi

Grebenka - помощник для разметки графика.
Функционал: 1. позволяет непрерывно рисовать линии ZigZag в ручном режиме, используя клики мышкой. 2. позволяет включать режим, при котором любая трендовая линия с которой в данный момент проводится манипуляция, выравнивается по горизонтали.
Горячие клавиши: [Z] - включение/выключение режима рисования линий ZigZag вручную [X] - включение/выключение режима горизонтальной трендовой линии [C] - быстрая смена цвета линий ZigZag [Del] - стандартная клавиш
FREE

KT HalfTrend è un indicatore di tendenza basato sulla media mobile che disegna zone sul grafico. Segnala un cambiamento di trend mostrando aree di invalidazione rialziste e ribassiste. Mostra anche la forza di acquisto e vendita con delle frecce direttamente sul grafico principale. Se non c’è una tendenza, l’indicatore resta piatto: ciò può indicare una fase di accumulo, distribuzione o consolidamento temporaneo. Se è presente una tendenza, viene mostrata una pendenza nella direzione del trend.
Ti presentiamo un indicatore rivoluzionario che cambia le regole del gioco nel mondo del trading di tendenza. L'indicatore è progettato per ripensare le prestazioni e portare la tua esperienza di trading a livelli senza precedenti. Il nostro indicatore vanta una combinazione unica di funzionalità all'avanguardia che lo distinguono dalla concorrenza. La tecnologia avanzata "Real Pricing Factors" offre una sostenibilità senza pari anche nelle condizioni di mercato più difficili e volatili. Dì addi

Presentazione Quantum Breakout PRO , l'innovativo indicatore MQL5 che sta trasformando il modo in cui scambi le zone di breakout! Sviluppato da un team di trader esperti con un'esperienza di trading di oltre 13 anni, Quantum Breakout PRO è progettato per spingere il tuo viaggio di trading a nuovi livelli con la sua strategia innovativa e dinamica della zona di breakout.
Quantum Breakout Indicator ti fornirà frecce di segnalazione sulle zone di breakout con 5 zone target di
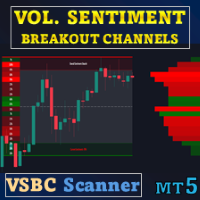
Offerta speciale : ALL TOOLS , solo $35 ciascuno. I nuovi strumenti saranno a $30 per la prima settimana oppure per i primi 3 acquisti ! Trading Tools Channel on MQL5 : unisciti al mio canale MQL5 per ricevere tutti i miei aggiornamenti Volume Sentiment Breakout Channels è un indicatore che visualizza le zone di breakout basate sul sentiment del volume all’interno di canali di prezzo dinamici. Invece di considerare il breakout come un semplice evento tecnico di prezzo, si concent

An ICT fair value gap is a trading concept that identifies market imbalances based on a three-candle sequence. The middle candle has a large body while the adjacent candles have upper and lower wicks that do not overlap with the middle candle. This formation suggests that there is an imbalance where buying and selling powers are not equal. Settings Minimum size of FVG (pips) -> FVGs less than the indicated pips will be not be drawn Show touched FVGs Normal FVG color -> color of FVG that hasn't
FREE

Understanding the levels of the previous day or week is very important information for your trading.
This indicateur allow to draw Previous day High/Low Previous week High/Low
Congifuration High & Low for: Previous day, week Line Style, color Label position, size, color Any questions or comments, send me a direct message here https://www.mql5.com/en/users/mvonline
FREE

The Forex Master Pattern is an alternative form of technical analysis that provides a framework which will help you to find and follow the hidden price pattern that reveals the true intentions of financial markets. This algorithm here does a good job detecting the Phase 1 of the Forex Master Pattern cycle, which is the contraction point (or Value).
On Phase 2 we get higher timeframe activation (also called Expansion), which is where price oscillates above and below the average price defined

This indicator is specifically designed for boom 1000 index. The indicator contains optimised trend filters to target buy spikes in an uptrend. The indicator also add a grid buy signal to recover some loss of the first buy signal. The indicator also provides exit signals for delayed spikes which can help with risk management .Also it analyses signals for historical data and displays percentage of good signals provided by the indicator. KEY FEATURES Non-lagging indicator. Non-repaint. Enable/d
FREE

Desenvolvido por smart2trader.com Indicador Pin Bar Color detecta e pinta automaticamente padrões de pin bar no gráfico com cores personalizáveis, oferecendo configurações flexíveis para identificação de oportunidades de trading. Além disso, através do nosso indicador Pin Bar , é possível monitorar em tempo real as formações do padrão pin bar , sendo sempre avisado nos ultimos 30 segundos antes do encerramento do candle.
Sobre o Padrão Pin Bar
O padrão Pin Bar é amplamente utilizado na análise
FREE

To get access to MT4 version please click https://www.mql5.com/en/market/product/130055  ; - This is the exact conversion from TradingView: "Ut Alart Bot Indicator". - You can message in private chat for further changes you need. Here is the source code of a simple Expert Advisor operating based on signals from Ut Bot Indicator . #property copyright "This EA is only education purpose only use it ur own risk" #property link " https://sites.google.com/view/automationfx/home " #property versio
FREE

Position Size Calculator PRO MT5 (v2.20) Position Size Calculator PRO è uno strumento professionale di gestione del rischio per MetaTrader 5 che calcola la dimensione del lotto consigliata in base al rischio per operazione, alla distanza dello Stop Loss e alle specifiche del simbolo (valore del tick, dimensione del tick, volume min/max/step, margine). Nessuna operazione di trading: questo indicatore non apre né chiude ordini e non gestisce posizioni. È uno strumento di supporto alle decisioni pe

Modified oscillator MACD. A classic indicator that combines a trend indicator with an oscillator to detect entry points. Has a multi-timeframe panel and 3 types of notifications
Benefits:
Works on all instruments and timeseries Trend indicator with oscillator for inputs Multi-period panel on all timeframes Pluggable arrows when signals appear Three types of notifications: push, email, alert
MT4 version -> HERE / Our news -> HERE
How the indicator works:
AW Classic MACD - Indicator of
FREE

The SuperTrend Strategy is a widely-used technical indicator based on the Average True Range (ATR), primarily employed as a trailing stop tool to identify prevailing market trends. The indicator is designed for ease of use while providing reliable insights into the current market trend. It operates based on two key parameters: the period and the multiplier . By default, it uses a period of 15 for the ATR calculation and a multiplier of 3 . The Average True Range (ATR) plays a crucial role in th
FREE

The indicator draws supply and demand zones. The zone timeframe can be set independently of the chart timeframe. For instance, it is possible to set M5 zones on an H4 chart. The importance of zones can be adjusted using the zone strength parameter. Demand zones are displayed if at least one candle in the range of the zone is entirely above the zone. Similarly, supply zones are displayed if at least one candle within the zone is entirely below the zone.

Good old UT BOT converted from TradingView script by ' QuantNomad ', initially by ' Yo_adriiiiaan ' and ' HPotter ' - so you can bet this is powerful tool. If you know, you know. This is top of the line, while keeping it really simple.
Main function: trend identification with trend switch points , created by EMA(source) and ATR -source is CLOSE PRICE with option to use HEIKEN ASHI chart instead, for this you need "Heiken Ashi" indicator - its available as free download by MetaQuotes
One of th

The indicator is designed for easy construction of synthetic charts based on data of various financial instruments. It will be useful both arbitrage and pair trading, as well as for analysis purposes. Its main advantage is simplicity and clarity. Each chart is given as a common mathematical formula. For example, if you want to plot the spread (difference) between EURUSD and GBPUSD with coefficients 4 and 3, then set the following formula: EURUSD * 4 - GBPUSD * 3 The resulting chart is shown in t

Scopri la Strategia delle "Agulhadas" Ispirata a concetti popolari nel mercato brasiliano, questa strategia combina cinque indicatori tecnici per identificare potenziali punti di entrata e uscita basati su tendenza, forza del mercato e momentum. Tra gli indicatori utilizzati c’è il famoso Indice Didi, sviluppato da Odair Aguiar, noto per rappresentare l'incrocio delle medie mobili. Scarica qui lo Scanner Azionario Indicatori Utilizzati Indice Didi ADX Bande di Bollinger Trix Stocastico Come Funz
FREE

NOTE: Turn Pattern Scan ON
This indicator identifies Swing Points, Break of Structure (BoS), Change of Character (CHoCH), Contraction and Expansion patterns which are plotted on the charts It also comes with Alerts & Mobile notifications so that you do not miss any trades. It can be used on all trading instruments and on all timeframes. The non-repaint feature makes it particularly useful in backtesting and developing profitable trading models. The depth can be adjusted to filter swing points.
FREE
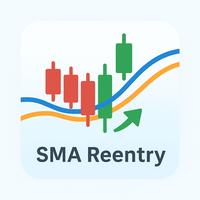
Cos’è SMA Reentry SMA Reentry è un indicatore professionale che segnala i punti di rientro a favore di trend utilizzando due medie mobili semplici (SMA): una veloce e una lenta. L’indicatore mostra chiaramente quando il prezzo rientra sopra o sotto la media mobile veloce, in presenza di un trend definito dalla SMA lenta. È lo strumento ideale per chi cerca segnali chiari di pullback, breakout e rientro su trend già avviati. Come Funziona Identifica il trend di fondo grazie all’incrocio tra SMA
FREE

Ciao ragazzi, questo è The Rangers Fx Siamo riusciti a creare un indicatore per rilevare i picchi sull'indice Boom 1000, sull'indice Boom 500 e sull'indice Boom 300, infatti questo indicatore indica tutti i Boom disponibili e gli altri che stanno ancora arrivando in futuro. Come utilizzare questo indicatore Prima di tutto devi trasformare il tuo intervallo temporale in un intervallo temporale M1/M5, questo indicatore ti invierà un avviso su quando effettuare le tue operazioni di acquisto e quand

The Multi Pairs Forex Indicator is an advanced trading too l that allows traders to track and analyze the performance of multiple currency pairs in real-time on a single chart. It consolidates data from various Forex pairs, providing an at-a-glance overview of market conditions across different currencies and helps you save time. Useful for various trading styles, including scalping, day trading, and swing trading. Whether you're monitoring major pairs like EUR/USD, GBP/USD, or more exoti
Il Pin bar tracker è un indicatore progettato per trovare i modelli di pin bar nei grafici di valute, oro e bitcoin in qualsiasi intervallo di tempo, include uno strumento che calcola automaticamente il rapporto rischio-rendimento, il lotto e i possibili punti di stop loss e take profit. Caratteristiche: - Funziona in qualsiasi intervallo di tempo - Calcola automaticamente i lotti - Mostra i livelli di stop loss e take profit - Invia un avviso quando rileva un Pin Bar
FREE

Multicurrency and multitimeframe modification of the indicator Bollinger Bands. On the dashboard you can see breakouts and touches of the Bollinger Bands. In the parameters you can specify any desired currencies and timeframes. The indicator can also send notifications when the price touches the Bollinger Bands, when the current volatility changes (expands or falls), and when the price touches all the bands. By clicking on a cell with a period, this symbol and period will be opened. This is MTF

Smart Money Structure & Precision Trading Indicator (MT5) Smart Money Structure & Precision Trading Indicator is a powerful Smart Money Concepts (SMC) indicator for MetaTrader 5, designed to help traders identify high-probability entries with institutional logic . This indicator automatically detects market structure in real time , highlights key liquidity levels , and provides clear, non-repainting signals so you can trade with confidence and precision. Whether you are a scalper, day trader, o

Indicator Guide: Key Price Levels & Structure Shifts 1. Description The indicator is a technical analysis tool for the MetaTrader 5 platform. It is designed to automatically identify specific price movements and to highlight corresponding price zones based on preceding price action. This provides a visualization of key price areas according to the indicator's internal logic. 2. Visual Elements & Their Identification The indicator identifies and draws several types of visual elements on the chart
FREE

The indicator looks for consolidation (flat) in the market at a certain time, builds a box-channel and marks levels indented from it for a breakdawn. After crossing one of the levels, the indicator marks the zone for take profit and calculates the corresponding profit or loss in the direction of this entry on the panel. Thus, the indicator, adjusting to the market, finds a flat area of the market, with the beginning of a trend movement to enter it. Version for MT4: https://www.mql5.com/en/market
FREE

The Hydra Multi Trend Dashboard is a powerful market scanning tool designed for MetaTrader 4 and MetaTrader 5. It monitors up to 25 currency pairs or assets simultaneously across all 9 standard timeframes (M1 to Monthly). Using a proprietary Special Trend Formula , the dashboard filters out market noise and provides clear, visual Bullish or Bearish signals, allowing traders to identify trend alignments at a glance without switching charts. Setup & Guide:
Download MT4 Version here. Exclusivel

Questo indicatore multi time frame e multi simbolo identifica formazioni alto/basso doppie o triple o un successivo breakout della scollatura (confermato alto/basso). Offre RSI, pin bar, engulfing, tweezer, filtri a stella del mattino/sera e opzioni di filtro di divergenza che consentono di filtrare solo le configurazioni più forti. L'indicatore può essere utilizzato anche in modalità grafico singolo. Si prega di leggere di più su questa opzione nel prodotto blog . Combinato con le tue
Versione Expert Advisor Se preferisci il trading automatico invece dei segnali manuali, puoi trovare la versione Expert Advisor di questo indicatore qui: https://www.mql5.com/en/market/product/148310
False Breakout Detector è un indicatore progettato per individuare situazioni in cui il prezzo supera un livello di supporto o resistenza recente e successivamente rientra rapidamente nel range. Il rilevamento di questi falsi breakout può essere utile nell’ambito di analisi tecnica discrezionale o
FREE

Indicatore Crypto_Forex "Smoothed Trend Histogram" per MT5, senza ridisegno.
- L'indicatore Smoothed Trend Histogram è molto più efficiente di qualsiasi incrocio di medie mobili standard. - È particolarmente focalizzato sul rilevamento di grandi tendenze. - L'indicatore ha 2 colori: rosso per il downtrend ribassista e verde per il uptrend rialzista (i colori possono essere modificati nelle impostazioni). - Con avvisi per dispositivi mobili e PC. - È un'ottima idea combinare questo indicatore c

Sigma Indicator is used by Sigma Expert advisor for plotting the zones but now its available for members to apply their stratagies on Sigma supply and demand levels.
Instructions:
1- Donot Change time frames instead run several pairs with different time frames with sigma indicator 2- For exness : Search for smaller zone = True
For other brokers keep it False
3- Maximum zone size = 0
4- Minimum zone size = 0
5 - Back candles = 300

AW Super Trend - Questo è uno degli indicatori di tendenza classici più popolari. Ha un'impostazione semplice, ti consente di lavorare non solo con la tendenza, ma mostra anche il livello di stop loss, che viene calcolato da questo indicatore. Benefici:
Strumenti: Coppie di valute , azioni, materie prime, indici, criptovalute. Tempi: М15 e superiori. Tempo di negoziazione: tutto il giorno. Mostra la direzione del trend attuale. Calcola lo stop loss. Può essere utilizzato quando si lavor
FREE

Multicurrency and multi-timeframe indicator Inside Bar (IB). In the parameters, you can specify any desired currencies and timeframes. The panel displays the last found Inside Bar (and Mother Bar) pattern, the current price position and the breakout of the levels of the Mother and Inside Bars. You can set the size and color for bars and text in the cells. The indicator can also send notifications when levels are broken. The dashboard highlights Double Inside Bar in a special color. By clicking

MA3 Trend MT5 - is the good trend indicator on three MAs . Benefits of the indicator: The indicator produces signals with high accuracy.
The confirmed signal of the indicator does not disappear and is not redrawn.
You can trade on the MetaTrader 5 trading platform of any broker.
You can trade any assets (currencies, metals, cryptocurrencies, stocks, indices etc.).
You can trade on any timeframes (M5-M15 scalping and day trading / M30-H1 medium-term trading / H4-D1 long-term trading). Indi
FREE

L'indicatore UzFx-Total TP'SL & Timer-MT5 è progettato per fornire un monitoraggio in tempo reale dei valori totali di Take Profit (TP) e Stop Loss (SL) su tutte le operazioni aperte e in sospeso. Inoltre, include un timer con conto alla rovescia delle candele per indicare il tempo rimanente alla chiusura della candela corrente.
Caratteristiche principali:
Calcola automaticamente il profitto e la perdita totali previsti da tutte le operazioni attive e gli ordini in sospeso. Visualizza il temp
FREE
ICONIC Reversal Engine Quality over quantity. Trade only the reversals that matter. The Problem: Noise, Overload, False Signals Most indicators flood charts with arrows but ignore context.
A hammer in a strong downtrend is irrelevant. An engulfing without volume is a trap.
Result: analysis paralysis, missed moves, costly errors. The Solution: Your Analytical Co-Pilot The ICONIC Reversal Engine is not “just another arrow.” It explains why a setup matters.
Every signal is stress-tested through a
FREE

This is an indicator of trading sessions that can display all levels (Open-High-Low-Close) for four sessions . The indicator can also predict session levels. Sessions can be drawn with lines or rectangles (empty or filled), lines can be extended to the next session. You can easily hide/show each session by pressing hotkeys (by default '1', '2', '3', '4'). You can see ASR (Average Session Range) lines (default hotkey 'A'). This is similar to the ADR calculation, only it is calculated based on
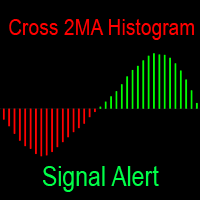
L'indicatore mostra la differenza tra le due medie mobili sotto forma di un grafico a barre. Le medie mobili hanno enormi opportunità di personalizzazione. Notifica in tutti i modi quando il colore dell'istogramma cambia: emette un segnale acustico nel terminale, invia una notifica al telefono e una lettera alla posta: ora non perderai sicuramente l'affare. Indicatore di intersezione delle medie mobili completamente gratuito sotto forma di linee sul grafico: https://www.mql5.com/it/market/produc
FREE

Presentiamo Koala FVG per MT5: il tuo indicatore professionale per i pattern Fair Value Gap (FVG). Koala FVG: La tua strada verso un trading preciso su MT5 Scopri la potenza del pattern Fair Value Gap (FVG) con Koala FVG, un indicatore all'avanguardia progettato per MetaTrader 5. Per un periodo limitato, accedi gratuitamente a questo strumento professionale prima che diventi un indicatore premium. Principali caratteristiche: Rilevamento dei pattern FVG: Koala FVG identifica intelligentemente i p
FREE

The Order Block Indicator for MT5 is a powerful tool designed for traders who use smart money concepts and institutional trading strategies. It automatically detects key order blocks on the chart, helping traders identify high-probability reversal and continuation zones.
Key Features: • Automatic Order Block Detection – Highlights strong buying and selling zones based on price action and volume. • Multi-Timeframe Support – Analyze order blocks across different timeframes for better market in
FREE

OBV MACD
Calculating MACD based on OBV data Features
3 outputs: MACD & Signal & Histogram 4 Colored Histogram Smoothing factor show/hide option for MACD & Signal lines Description
Among the few indicators developed for working with volume data, OBV (On Balance Volume) is the simplest yet most informative one. Its logic is straightforward: when the closing price is above the previous close, today's volume is added to the previous OBV; conversely, when the closing price is below the previous close
FREE
L'indicatore Candle_Timer_and_Spread mostra su un grafico il tempo fino alla fine della candela e la percentuale di variazione del prezzo insieme allo spread per i simboli selezionati.
Il timer per il tempo fino alla fine della candela sull'intervallo di tempo corrente e la variazione del prezzo in percentuale rispetto al prezzo di apertura del giorno si trova per impostazione predefinita nell'angolo in alto a destra del grafico. Il pannello mostra lo spread e la variazione percentuale del pre
FREE

A professional tool for trading - the divergence indicator between the RSI and the price, which allows you to receive a signal about a trend reversal in a timely manner or catch price pullback movements (depending on the settings). The indicator settings allow you to adjust the strength of the divergence due to the angle of the RSI peaks and the percentage change in price, which makes it possible to fine-tune the signal strength. The indicator code is optimized and is tested very quickly as par
FREE

Verve AI Reversal Pro Indicator Pro è il compagno di trading definitivo per chi richiede precisione assoluta e intuizioni di mercato senza pari. Sfruttando la potenza dell’intelligenza artificiale all’avanguardia, questo strumento sofisticato analizza continuamente l’azione del prezzo, il volume e la volatilità per individuare punti di inversione ad alta probabilità prima che si manifestino completamente. Integrando perfettamente algoritmi di machine learning avanzati con principi collaudati di
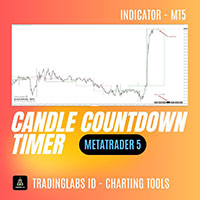
Candle Timer Countdown (CTC) – Minimalist & Precise Candle Timer Candle Timer Countdown (CTC) is a lightweight and non-intrusive MetaTrader indicator that displays the remaining time of the current candlestick on your chart. Designed with simplicity and clarity in mind, this tool helps traders stay aware of candle closures without cluttering the chart. Key Features: Real-Time Candle Countdown
Always know how many seconds are left before the current candle closes – works on all timeframes. Minima
FREE
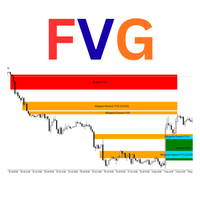
Luta FVG Pro – Professional Fair Value Gap (FVG) Indicator
Detects Institutional Fair Value Gaps on H4 timeframe with the same way used by ICT/SMC traders.
Features: • Real-time Bullish & Bearish FVG detection • Automatic Mitigation tracking • Inverted FVG signals (very powerful reversal setups) • "GOOD" FVG marking (gaps ≥ 2× minimum size – higher probability) • Clean rectangles with smart labels (Bullish FVG / Mitigated / Inverted) • Overlap filter option • Maximum 50 active zones (no chart
FREE

Questo cruscotto scopre e visualizza le zone di domanda e offerta sul grafico, sia in modalità scalping che a lungo termine, a seconda della vostra strategia di trading per i simboli selezionati. Inoltre, la modalità scanner del cruscotto vi aiuta a controllare tutti i simboli desiderati in un colpo d'occhio e a non perdere nessuna posizione adatta / versione MT4
Indicatore gratuito: Basic Supply Demand
Caratteristiche Consente di visualizzare le opportunità di trading su più

This is a simple order block locator. Searched for the existence of order blocks only at extremums. If you want multi criteria order block location check my other indicator which is more powerful here These order blocks are ICT order blocks without any buttering.
The indicator can be a useful tool for detecting reversals, continuations. You can also use the indicator as confluence with your other tools
FREE

Oscillatore di momentum avanzato che regola automaticamente il suo periodo in base alla volatilità del mercato per segnali di ipercomprato e ipervenduto più accurati. Come Funziona: L'indicatore utilizza un calcolo del periodo adattivo che si riduce durante l'alta volatilità e si allunga durante la bassa volatilità. Questa regolazione dinamica fornisce segnali più rapidi quando il mercato è in trend e riduce i falsi segnali durante le fasi di lateralità. Il valore RSI viene calcolato sulla base
FREE

Presentiamo Market Structure Break Out per MT5 – Il tuo indicatore professionale di MSB e Zona Infrangibile. La versione per MT4 è disponibile anche, controllala qui: https ://www .mql5 .com /en /market /product /109958 Questo indicatore viene continuamente aggiornato. Cerchiamo di fornire punti di ingresso e uscita estremamente precisi basati sulla struttura del mercato. Siamo ora alla versione 1.1, e qui di seguito sono riportate le ultime modifiche se ti unisci a noi ora: Obiettivi di Acquis

This indicator allows to display Renko charts in the indicator window. Renko charts show only price movements that are bigger than the specified box size. It helps to eliminate noise and allows to focus on main trends.
Time is not a factor here. Only price movements are taken into account. That's why Renko chart is not synchronized with the main chart it is attached to. Indicator works in two modes: CLOSE - only close prices are taken into account while building the chart HIGH_LOW - only high/l
FREE
REVERSAL POWER PRO
The ONLY Indicator That Shows You Where Markets WILL Reverse - BEFORE They Move
WELCOME TO THE NEXT LEVEL OF TRADING PRECISION
Tired of guessing where the market will turn? Missing entries because you don't know where support/resistance REALLY is? Getting stopped out at "fake" levels? Wondering if your bias is correct before entering?
What if you had: Crystal-clear Supply/Demand Zones that markets RESPECT Daily Bias Engine telling you market directio
FREE

Questo indicatore è progettato per visualizzare i frattali sul grafico dei prezzi, aiutando i trader a identificare i massimi e minimi locali importanti. I frattali sono punti particolari sul grafico che corrispondono alla definizione classica: un massimo locale si forma quando la candela centrale è più alta delle due candele vicine su entrambi i lati, e un minimo locale si forma quando la candela centrale è più bassa delle due candele vicine. Altri prodotti -> QUI Funzionalità principali e van
FREE
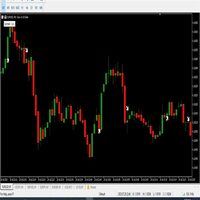
hello,
king binary sureshot mt5 binary indicator,
1 minute candle
1 minute expire
Alright. This indicator works on MT5 and is very easy to use. When you receive a signal from it, you wait for that candle with the signal to close and you enter your trade at the beginning of the next new candle. A red arrow means sell and a green arrow means buy. All arrows comes with a long dotted like for easy identification of trade signal. Are you okay with that?
FREE

The worktime indicator helps you identify the most important times to day to trade the currency pairs. It was created based on the ICT day trading free tutorials that are freely vailable on his youtube channel. You can use this indicator together with my other indicators that i have shared freely with you like the true day, custom periods, daily month, weekly open lines - they together complement each other very well.
Nuggets from this indicator: 1. Draws the asian session box showinng you the
FREE

Sonic R Indicator Description Overview The Sonic R Indicator for MT5 is designed to help traders analyze market trends using moving averages and volume analysis. This tool assists in identifying potential price movements by displaying trend zones and volume strength, making it suitable for various trading strategies. Key Features Dual EMA Trend Channels – Uses 34-period Exponential Moving Averages (EMA) to visualize price movement. Volume Analysis – A color-coded histogram to indicate changes i

Developed by MMQ — Session Based Market Profile TPO Indicator This indicator organizes price and time information into session-based Market Profiles, helping you identify value areas, points of control, and single prints for more informed trading analysis. Inspired by Jim Dalton’s book “Mind Over Markets”.
LINKS [ Documentation | Upgrade ]
What is Session-Based Market Profile? Session Based Market Profile is a powerful analytical tool that organizes price and time information to reveal mar
FREE
Sai perché MetaTrader Market è il posto migliore per vendere strategie di trading e indicatori tecnici? Non c'è bisogno di pubblicità o di protezione del software, nessun problema di pagamento. Tutto ciò è fornito da MetaTrader Market.
Ti stai perdendo delle opportunità di trading:
- App di trading gratuite
- Oltre 8.000 segnali per il copy trading
- Notizie economiche per esplorare i mercati finanziari
Registrazione
Accedi
Se non hai un account, registrati
Consenti l'uso dei cookie per accedere al sito MQL5.com.
Abilita le impostazioni necessarie nel browser, altrimenti non sarà possibile accedere.