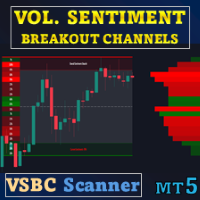
Volume Sentiment Breakout Channels MT5 Scanner
- Indicators
-
Duc Hoan Nguyen
 I develop practical trading tools for MetaTrader 4/5, with a focus on indicator integration, Multi-Timeframe analysis, market scanning, and automated trading solutions.
My work mainly includes:
• Indicator-to-EA Solutions - Version: 1.0
- Activations: 10
New tools will be $30 for the first week or the first 3 purchases!
Trading Tools Channel on MQL5: Join my MQL5 channel to update the latest news from me
Volume Sentiment Breakout Channels is an indicator that visualizes breakout zones based on volume sentiment inside dynamic price channels. Instead of looking only at pure technical breakouts, it focuses on how buy/sell volume is distributed within consolidation areas, thereby expressing the shift in control between buyers and sellers whenever price leaves the channel.
Inside each compression zone, the indicator identifies high-impact areas, measures the degree of dominance between the buy and sell side, and continuously updates the strength of order flow directly on the chart. When price breaks above or below a channel that is “weighted” by volume sentiment, that event is displayed as a shift in market conviction, not just a touch or break of a price line.
See more MT5 version at: Volume Sentiment Breakout Channels MT5 Scanner
See more MT4 version at: Volume Sentiment Breakout Channels MT4 Scanner
See more products at: All Products
1. Core Idea and Structure
The indicator is built on two main logic layers:
Channel Detection
A volatility-based algorithm detects price compression zones by normalizing highs and lows over a specified lookback period. These zones are shown as “boxes” representing accumulation or distribution phases. The lifetime of each box is determined dynamically based on price behavior, allowing users to track each phase completely before it breaks.
Volume Sentiment Profiling
Each price channel is divided into multiple “price tiers”. At each tier, volume is aggregated and signed by candle direction (bullish or bearish), forming a detailed sentiment map that shows which price regions are more strongly controlled by buyers or sellers. Color and color intensity reflect both direction and participation.
When a breakout occurs, the old box is closed and a new one is created. As a result, the transition of control between market phases (accumulation – breakout – new phase) is displayed seamlessly on the chart.
2. Detailed On-Chart Visualization
Volume Sentiment Breakout Channels does not just draw a single box, but restructures the price zone into multiple visual layers:
-
The main channel box represents the full upper and lower bounds of the accumulation zone.
-
The internal background area can be displayed as a semi-transparent colored region, giving the feeling of a “sentiment channel” that envelops price behavior.
-
The upper and lower parts of the box are colored according to directional bias (typically red for the upper side – selling pressure, and green for the lower side – buying pressure), combined with different transparency levels to suggest participation intensity.
-
The channel midline is drawn as a dashed line, representing the equilibrium between the upper and lower bounds – an important reference level for viewing price structure inside the channel.
-
Additional upper and lower boundary lines are plotted separately, creating a clear “channel frame” that helps distinguish the regions influenced by buyers and sellers.
Beyond the internal map of the box, the indicator can also draw a current profile extending to the right, showing how volume and volume sentiment are distributed at price levels around the current active area, helping users quickly see where the market is concentrating activity.
3. Flexible Channel and Breakout Logic
The indicator allows flexible configuration of how channels are defined and tracked:
-
Limit on number of bars processed: users can set the maximum number of bars the indicator will calculate, focusing either on the most recent data or the entire history as needed.
-
Normalization length and box detection length:
-
The normalization length is used to calculate the recent high–low range and affects how the channel expands or contracts.
-
The box detection length determines the sensitivity of consolidation detection: a shorter length will create more boxes, while a longer length focuses on larger and more prominent zones.
-
-
Multiple breakout modes:
The indicator supports several ways to compare price to the channel boundaries, such as using the close price, the extremes (high/low), or the average between open and close. This allows users to choose a definition of “breakout” that fits their analytical style.
While the box is active, if price stays between the upper and lower boundaries, the box is maintained and its internal sentiment map is continuously updated. When price moves outside that control zone, the box is marked as broken and corresponding signals and alerts are triggered.
4. Volume Sentiment Map and Explanatory Labels
Inside each box, the indicator builds a profile consisting of multiple price tiers:
-
Each tier records the total traded volume passing through it, separated by candle direction.
-
The sentiment value at each tier is normalized and converted into color intensity:
-
Tiers dominated by buyers are filled with green shades, with depth corresponding to intensity.
-
Tiers dominated by sellers use equivalent red shades.
-
The indicator can additionally display:
-
A current sentiment label at the active trading region, for example a percentage reflecting the relative strength between buying and selling at the price tier where the current price is located.
-
An overall sentiment label for the entire channel, indicating whether the channel as a whole is leaning toward buying or selling, based on the aggregation of all tiers.
Display options allow users to toggle:
-
Detailed labels,
-
Percentage labels,
-
The current sentiment profile extended to the right side of the chart.
Thanks to this, Volume Sentiment Breakout Channels can be used either as a minimalist visualization tool (only boxes and breakout arrows) or as a full sentiment map when a deeper view into market behavior is needed.
5. Breakouts, Signal Arrows, and Trend-Following Lines
When a channel is broken:
-
The indicator records an upward or downward breakout event and attaches the corresponding arrow just above or below the relevant candle (the position is adjusted using local volatility for better visibility).
-
After the breakout, a trend-following line is drawn based on the sequence of highs/lows and the number of bars since the breakout occurred. This line acts as a trace of the post-breakout trend and will automatically terminate when price crosses back in the opposite direction.
This allows users to:
-
Review an entire breakout phase together with subsequent price behavior,
-
Easily distinguish the preparation zone (box), the trigger moment (arrow), and the post-breakout segment (trail line).
6. Event-Based Alert System
Volume Sentiment Breakout Channels integrates an event-centered alert system around key states:
-
Alerts when a breakout occurs to the upside or downside.
-
Alerts when a new sentiment channel is formed.
Each alert can be configured to:
-
Apply only to the current chart, or to the full symbol list when used together with the scanner.
-
Choose the delivery method:
-
Platform notification,
-
Push notification,
-
Email,
-
And optional sound playback with a custom sound file.
-
This allows users to keep track of important sentiment zones without constantly watching the screen – focusing only on moments when a new channel appears or an existing one is broken.
7. Multi-Timeframe and Multi-Symbol Scanner
Another key feature is the ability to integrate with a scanner panel:
-
The scanner can be turned on or off directly on the chart.
-
Users define the list of timeframes to monitor (for example M1, M5, M15, M30, H1, H4, D1, W1).
-
A single common parameter set can be used for all timeframes, or separate parameter sets can be assigned to each timeframe.
The symbol list can be taken from:
-
Only the current symbol,
-
A limited number of symbols from Market Watch,
-
Or a custom, user-defined list.
The scanner is displayed as a grid:
-
Cells are color-coded to reflect notable states/sentiment (for example bullish/bearish bias or key signal types).
-
Separate text colors for bullish and bearish states help distinguish them at a glance.
-
A different background color when a cell is clicked provides a clear “selected” state.
Users can:
-
Click directly on a cell to quickly switch the chart to the corresponding symbol and timeframe.
-
Adjust column width and row height, keep the panel fixed or make it draggable.
-
Adjust the scale when minimized so the scanner does not cover the main part of the chart.
8. Display Control and User Experience
To avoid overloading the interface, Volume Sentiment Breakout Channels provides:
-
Hotkey display mode:
The indicator can be shown or hidden using a predefined hotkey. This helps users quickly switch between a “clean” chart and a detailed analytical view. -
Zone/box display options:
Users can turn all channel zones on or off, or keep only arrows and trend-following lines for a more minimal layout. -
Customizable colors, fonts, and sizes:
Backgrounds, text, bullish/bearish colors, fonts, and font sizes can all be configured to match the chart theme and individual visual preferences.
Summary
Volume Sentiment Breakout Channels combines:
-
Volatility-based channel detection,
-
Detailed volume sentiment mapping inside each box,
-
Breakout signals with trend-following lines,
-
An event-driven alert system,
-
And a multi-timeframe, multi-symbol scanner,
to turn accumulation zones and breakout events from static colored blocks into a dynamic, continuously updated structure. Users can see not only where price broke the channel, but also who is controlling that price region and how strong the underlying order flow is behind each phase of movement.