适用于MetaTrader 5的技术指标 - 8

FOR CRASH 500 ONLY!! MT5
*This is a smooth heiken ashi setup meant to be used on CRASH 500 in combination with other indicators. *You are welcome to test it on other markets aswell. *I will be posting other indicators aswell to help with trading the crash 500 market. *You can use this to help smooth out price if you do struggle with reading the charts as is. * Just note heiken ashi doesnt represent real price action only smoothes it out for ease of read.
FREE

Price Volume Trend (PVT) Oscillator Description: The PVT Oscillator is a volume indicator that serves as an alternative to the standard On-Balance Volume (OBV). While ordinary volume indicators can be noisy and hard to read, this tool converts volume flow into a clear Histogram Oscillator, similar to a MACD, but for Volume. It is designed to detect first Trend Reversals and Divergences by analyzing the difference between a Fast and Slow PVT moving average. Why is this better than standard OBV?
FREE

专家顾问版本 如果您更喜欢自动交易而不是手动信号,您可以在此处找到该指标的专家顾问版本: https://www.mql5.com/en/market/product/148310
False Breakout Detector 是一款技术分析工具,用于自动识别价格短暂突破最近支撑或阻力位后迅速回撤的情况。此类 虚假突破 的识别对反趋势策略或识别非有效突破具有参考价值。 主要功能: 对最近 N 根K线的 虚假突破进行自动检测 通过 箭头、水平线与背景色 显示信号,直观清晰 提供 可配置的弹窗与推送通知 ,防止错过关键机会 支持多项 参数自定义 :检测周期、点差容忍度、箭头位置、颜色设定等 采用 轻量级高效代码 ,适用于实时交易和回测场景 兼容性: 时间周期 :支持 M1 至 H4 适用市场 :外汇、指数、股票、大宗商品等 本指标 不包含预测算法 , 不保证交易结果 ,也 不生成自动交易信号 。它是一款专为 辅助技术分析判断 而设计的工具,适合结合其他方法使用。
推荐指标 该指标可与 Candlestick Pattern Analyzer 工具配合使用,以增强交易形态(setup
FREE

After 18 years of experience in the markets and programming, Winner indicator is ready. I would like to share with you! *** Contact me to send you instruction and add you in group for sharing or seeing experiences with other users. Largest Market Cap belongs to Gold, Bitcoin and US30, So they have many traders and great for use in scalping. Gold and Bitcoin Assistant will earn profit on M5 time frames in Gold, Bitcoin and US30. Easy strategy comes from long years experiences, It is a piece of c

【你看到的“即时 RSI 背离”,大多数都是错的】 如果你用过 RSI 背离指标,大概率遇到过这种情况:
当下看着是背离,几根 K 线之后却消失了,
回头一看,历史图形被改得面目全非。 这不是你用错了方法,
而是“不确认高低点的背离”,本身就站不住逻辑。 如果你在找一个不会事后推翻自己的 RSI 背离指标,
请继续往下看。 ———————————————————— 【指标功能简介】 这是一个 RSI 背离识别指标,用于自动标出价格与 RSI 之间的顶背离与底背离。 主要特性包括: 自动识别 RSI 背离结构
在 RSI 指标窗口中清晰标出背离段
不重绘、不回撤历史信号
适合与 MACD、趋势线、均线等工具配合使用
更适合用于结构确认,而非抢最低或最高点 ———————————————————— 【为什么背离信号会延迟 5 根 K 线显示】 这是本指标最重要、也最容易被误解的一点,请务必理解。 所有“真实有效”的背离判断,都必须先确认一个已经成立的高点或低点。 而确认高点或低点,必然需要一个前提条件:
行情已经发生了反向回调。 在没有回调之前,任何所谓的“高点”或“低点”,都只是暂时的猜
FREE

98% 准确率的交易信号 精准入场,清晰出场 | 多时间周期 | 所有市场
简单三步即可操作 1️⃣ 入场交易(买入/卖出规则) 信号触发:两条线 (X) 在彩色区域外交叉(红色代表买入/蓝色代表卖出)。
确认:价格 K 线必须触及交叉(在交叉期间或之后 1-5 个 K 线内)。
备选入场(未触及):
卖出信号(蓝色区域):价格保持在交叉上方(无需触及)。
买入信号(红色区域):价格保持在交叉下方(无需触及)。
2️⃣ 出场交易(止盈) 平仓信号:黄线在当前区域外弯曲 → 出场交易。
3️⃣ 风险管理 手数:每 1,000 美元账户余额 0.01 手。
分散交易:跨主要货币对(例如,美元/日元、欧元/英镑、黄金)。
交易者为何青睐此指标 98% 准确率 – 基于流动性和移动平均线交叉的可靠信号。 适用范围广泛 – 所有外汇货币对、商品、时间周期(从 1 个月到每月)。 无需猜测 – 严格的入场、出场和风险规则。 灵活确认 – 即使 K 线未触及也可交易(特殊情况)。
主要特点 不重绘 – 仅在有效交叉后确认信号。 可视区域 – 蓝色 = 卖

The indicator is stable on noise fluctuations in price and quickly reacts to the trend. It is based on an algorithm from a system of hyperbolic functions that allows you to aggressively smooth the flat with minimal lag on the trend. It can be applied directly to the price chart, to itself, or to other indicators in order to eliminate false signals. The main purpose of the indicator is to smooth out small sawtooth price movements as much as possible. The higher the Hyperbolic parameter, the stron
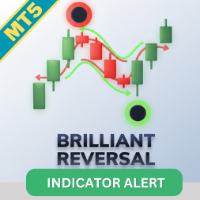
提升您的交易策略,使用 Brilliant Reversal Indicator MT5 ,这是一个前沿指标,利用非参数内核回归提供平滑、自适应的趋势分析。受 Nadaraya-Watson 估计器的启发,此工具将高斯内核平滑应用于价格数据,创建动态包络线,这些包络线适应市场波动性,而没有传统移动平均线的过度滞后。在 TradingView 等平台上广受赞誉,并受到全球交易者的高度评价,因为其在发现反转方面的精确性,Nadaraya Watson Envelope 自 2022 年以来人气飙升,作为 Bollinger Bands 的优越替代品。其非重绘模式确保实时可靠信号,而重绘选项提供超平滑视觉效果,用于深入分析。 交易者喜爱 Brilliant Reversal Indicator,因为它能够以惊人的准确性突出趋势强度、超买/超卖状况和潜在反转点。通过估计底层价格趋势并计算平均绝对偏差,它形成上部和下部带,这些带充当动态支撑和阻力水平。这使您能够在趋势延续或反转期间自信地进入交易,减少噪音和虚假信号。益处包括增强决策,用于剥头皮、波段交易或长期头寸,通过警报关键交叉或反弹潜在

The official release price is $65 only for the first 10 copies, the next price is $125 Gold Scalper System is a multifunctional trading system that combines a breakout strategy for key liquidity levels with confirmation and a built-in Smart DOM Pro module for market depth analysis. The system identifies zones of limit order accumulation, tracks activity at support and resistance levels, and generates signals at the moment of their breako

江恩箱(或江恩方)是一种基于 W.D. Gann 的“市场预测的数学公式”文章的市场分析方法。 该指标可以绘制三种正方形模型:90、52(104)、144。有六种网格变体和两种弧形变体。 您可以在一张图表上同时绘制多个方块。
参数 Square — 江恩方格模型的选择: 90 — 90 的平方(或 9 的平方); 52 (104) — 52(或 104)的平方; 144 — 144的万能平方; 144 (full) — 正方形的“完整”版本,结合了其他正方形的线条。 据我们所知,W.D.江恩并没有这样的加价; for Arcs — 圆弧的简化正方形; Grid — 网格的变体: 4x4 (52) — 4 x 4 网格,52 个标记; 5x5 (40); 8x8 (90); 8x8 (104); 8x8 (144); 16x16 (144); 36x36 (144); disable — 禁用网格; Arcs — 弧线的变体: 4x4; 5x5; disable — 禁用弧; 开始时的方形参数: Length of Square, Bars (X-axis) — 正方形的长度(以条

推出 Market Structure Break Out for MT5 — 您的专业 MSB 和 Unbroken Zone 指标。 MT4 版本也已上线,请查看: https ://www .mql5 .com /en /market /product /109958 该指标正在持续更新。 我们努力提供基于市场结构的高精度进场和出场点。目前我们处于1.1版本,如果您现在加入我们,以下是最新的更改: 买入和卖出目标: 明确了解买入和卖出位置的最佳获利水平。 最后的MSB方向: 显示最新的市场结构突破方向,以帮助更好地决策。 增强的视觉模式: 使用新的美观模式自定义您的图表,包括亮色、暗色或个性化主题。 实时回测开关: 使用新的屏幕按钮轻松开启或关闭实时回测。 领取您的免费EA:
获取免费的 Market Structure Breakout EA ,它可以根据突破箭头自动开仓,使用固定手数,并可自定义止损和止盈水平。 如何领取:
点击此处下载 EA 。请注意,此 EA 仅在您已购买 Market Structure Break Out 指标 后才能
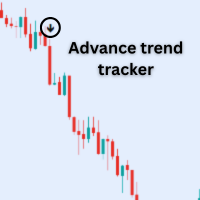
Features: 1. Buy arrows= when Up trend start. 2.Sell arrows = when Down trend start 3.Alert System= when Signal appear then Mt5 itself Pop up a alert Box. 4. You can get notifications on your phone real time through Mt5 app.
Note: this indicator will work on trending market. So try to trade volatile market.
Best Pair: Only trade in New York session NASDAQ (US100) S&P ( US500) Dow Jones (US30)
Note : Don't Trade Forex pair.
FREE
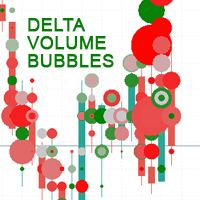
Delta Volume Bubbles is an advanced MetaTrader 5 indicator designed to visually display buy and sell pressure through dynamic, colored bubbles plotted directly on the price chart.
It calculates the net volume delta (difference between buy and sell volume) and represents it as bubbles of different sizes and colors giving traders a clear, intuitive picture of order flow activity. This indicator provides a visual form of order flow analysis , allowing traders to interpret market pressure even with
FREE

该指标是一款用于 MetaTrader 4 和 5 的交互式艾略特波浪标注工具。
它允许用户通过图表上的菜单选择标注大小、颜色和波浪类型(ABC 修正浪、五浪推动浪或 WXY 结构),并直接在图表上手动放置波浪标注。
只需在图表上单击一次,指标就会在所选的价格和时间位置依次放置相应的波浪标注,帮助交易者直观地绘制和整理艾略特波浪结构。 如果您喜欢,请为它评分! 该指标是一款用于 MetaTrader 4 和 5 的交互式艾略特波浪标注工具。
它允许用户通过图表上的菜单选择标注大小、颜色和波浪类型(ABC 修正浪、五浪推动浪或 WXY 结构),并直接在图表上手动放置波浪标注。
只需在图表上单击一次,指标就会在所选的价格和时间位置依次放置相应的波浪标注,帮助交易者直观地绘制和整理艾略特波浪结构。 如果您喜欢,请为它评分!
FREE

NOTE: Turn Pattern Scan ON
This indicator identifies Swing Points, Break of Structure (BoS), Change of Character (CHoCH), Contraction and Expansion patterns which are plotted on the charts It also comes with Alerts & Mobile notifications so that you do not miss any trades. It can be used on all trading instruments and on all timeframes. The non-repaint feature makes it particularly useful in backtesting and developing profitable trading models. The depth can be adjusted to filter swing points.
FREE

The SuperTrend Strategy is a widely-used technical indicator based on the Average True Range (ATR), primarily employed as a trailing stop tool to identify prevailing market trends. The indicator is designed for ease of use while providing reliable insights into the current market trend. It operates based on two key parameters: the period and the multiplier . By default, it uses a period of 15 for the ATR calculation and a multiplier of 3 . The Average True Range (ATR) plays a crucial role in th
FREE

Trend Entry Indicator Your Trading will Be easier with this indicator!!! This Indicator is Developed To make our trading life easier. Get an Arrow for Entry with Take Profit and Slop Loss marks on chart. - Indicator is Based on trend, because thats what we all want we want to follow the trend "it's our friend". - Based on Levels, price action and oscillators. - It works on all currency pairs, all indices, metals and stock. - it works on all pairs/indexes on Deriv including Boom and Crash. - Tim
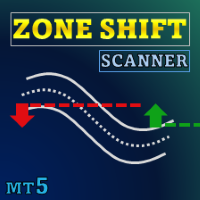
特别优惠 : ALL TOOLS ,每个仅 $35 ! 新工具 在 发布后的第一周 或 前 3 笔购买 期间仅售 $30 ! MQL5 上的 Trading Tools 频道 :加入我的 MQL5 频道以获取我的最新动态 Zone Shift 是一款趋势识别工具,使用基于 EMA/HMA 的带状通道来检测趋势转换并显示关键反应位。它通过蜡烛颜色显示趋势方向,并用可视化提示标记重要回测,帮助用户跟踪动能。 查看 MT5 版本: Zone Shift MT5 Scanner 查看 MT4 版本: Zone Shift MT4 Scanner 查看更多产品: All P roducts 主要功能 1) 动态 EMA-HMA 带 构建三线通道:中线为 EMA 与 HMA 的平均;上、下轨根据平均蜡烛范围扩展。该带会根据市场波动性自适应,以反映当前运行区间。 2) 趋势检测(带区穿越逻辑) 当最低价上穿上轨时识别为上升趋势。 当最高价下穿下轨时识别为下降趋势。 蜡烛重新上色:上升趋势为黄绿色(lime),下降趋势为红色。 3) 趋势起始位 在新趋势开始时,工具记录

An ICT fair value gap is a trading concept that identifies market imbalances based on a three-candle sequence. The middle candle has a large body while the adjacent candles have upper and lower wicks that do not overlap with the middle candle. This formation suggests that there is an imbalance where buying and selling powers are not equal. Settings Minimum size of FVG (pips) -> FVGs less than the indicated pips will be not be drawn Show touched FVGs Normal FVG color -> color of FVG that hasn't
FREE

### Best Order Block Detector Indicator for MT5
The Order Block Detector is a technical analysis indicator designed for MetaTrader 5 (MT5). It identifies potential order blocks (OBs) in the market, which are key price levels where significant buying or selling activity has occurred, often acting as support or resistance zones. These blocks are detected based on volume pivots and market structure swings, helping traders spot areas of institutional interest for potential reversals or continuation
FREE

Smart Money Breakout Channels Indicator
The Smart Money Breakout Channels indicator is a powerful technical analysis tool designed to identify potential breakout opportunities in financial markets by detecting consolidation channels based on price volatility. Built for MetaTrader 5 (MT5), it overlays dynamic channels on the price chart, highlighting areas of low volatility that often precede significant price movements. This indicator is inspired by smart money concepts, focusing on institution
FREE

Benefits and Usage of the Volume Bubble Tool This tool, (one of my favorites by Algo Alpha, from Tradingview) provides an advanced method of volume analysis by moving beyond traditional histograms. It leverages statistical normalization (Z-score) on lower-timeframe data to identify and classify statistically significant volume events, visualizing the dynamic between "Smart Money" (institutional) and "Retail" participants. Core Benefits Intuitive On-Chart Visualization: By plotting volume as bub
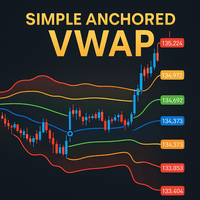
Simple Anchored VWAP is a lightweight yet powerful tool designed for traders who want precise volume-weighted levels without complexity.
This indicator lets you anchor VWAP from any point on the chart and instantly see how price reacts around institutional volume zones. MT4 Version - https://www.mql5.com/en/market/product/155320
Join To Learn Market Depth - https://www.mql5.com/en/channels/suvashishfx Using VWAP bands and dynamic levels, the tool helps you understand where real buying and s
FREE
ICONIC Reversal Engine 重质不重量。 只交易真正有意义的反转。 问题:噪音、过载、假信号 多数指标用一堆箭头把图表塞满,却忽略 语境 。
强势下跌中的锤子形态毫无意义;没有成交量配合的吞没只是陷阱。
结果:分析瘫痪、错过行情、代价高昂的错误。 解决方案:你的分析副驾驶 ICONIC Reversal Engine 不是“又一个箭头”。它会告诉你 为何 这个形态重要。
每个信号都经过 五阶段共振模型 的压力测试,并给出 0–100 分 的质量评分,让你一眼看出优劣,而不是只有“买/卖”。 核心能力 智能置信评分(0–100): 衡量共振强度。 >75 = A++ 顶级形态 。 五大共振支柱: 形态强度 —— 识别高价值的 1/2/3 根 K 线反转形态。 市场结构 —— 验证是否位于关键摆动高/低点。 趋势语境 —— 检查价格在关键 EMA 处的反应。 动能 —— 以 RSI 背离 / MACD 变化 进行确认。 成交量与波动 —— 关注市场参与度与 布林带 语境。 交互式 GUI 仪表盘: 简洁的图上“驾驶舱”,提供方向与精确价位( Entry、TP、SL )。可
FREE
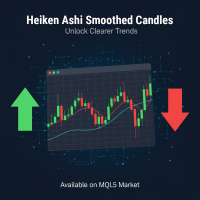
Heiken Ashi 平滑指标 (MT5专用) 高级Heiken Ashi,带平滑滤波器。去除噪音,减少假信号,提前识别趋势。适合外汇、指数、加密货币(H1-D1)。 工作原理与平滑方式 传统Heiken Ashi通过平均前几根K线的开盘、收盘、最高、最低价来生成K线,已减少小幅波动影响。然而, Heiken Ashi Smoothed 在此基础上对“原始”价格(raw)应用额外平滑滤波器。不使用直接价格,而是采用移动平均(EMA或SMA,可配置)处理输入数据,生成代表更稳定流畅趋势的K线。 此平滑过程分两阶段进行: 基础Heiken Ashi计算 :平均价格形成初始K线,多头K线(通常绿色或白色)表示上升趋势,空头(红色或黑色)表示下降趋势。 递归平滑 :对结果应用移动平均,消除异常峰值,创建价格运动的更线性表示。最小化临时波动引起的“噪音”,不引入过多滞后,适合实时分析。 结果,平滑K线如动态均线般运作:价格在K线上方表示多头强势,下方为空头。价格交叉产生清晰进出场信号。 核心优势 该指标以提升交易精度著称,提供具体益处: 减少虚假信号 :过滤市场噪音,大幅降低假突破(whips
FREE

凤凰趋势强度计(MT5)
适用于MetaTrader 5的市场状态与趋势强度分析工具。整合ADX、RSI及方向性移动指标于单一面板,实时分类市场状况。
核心价值
多数交易者失败并非源于入场时机不当,而是将错误策略套用于错误的市场状态。凤凰趋势强度计可帮助交易者即时判断市场处于震荡、趋势形成、强势趋势或进入耗尽风险区域。
该指标通过ADX分析趋势强度,利用DI判断方向倾向,结合RSI衡量动能平衡。这些指标整合为可视化计量器,并配有清晰的文本化状态分类(震荡、谨慎做多/做空、强势做多/做空、风险/超买)。面板随新K线实时更新,并可选配状态转换与趋势衰竭预警功能。
安装说明
从MQL5市场下载后附加至任意图表,面板即刻显示并采用预优化默认参数。
系统要求
MetaTrader 5 3280版或更高版本。本指标为自定义指标,兼容所有经纪商及交易品种,旨在为您的交易策略提供决策支持与市场状态筛选功能。
反馈与评价
若您认为本工具实用,敬请在MQL5平台给予五星好评。您的反馈将直接影响凤凰工具的未来更新、优化及新功能开发——我们致力于打造交易者真正重视的工具。
技术支持
通
FREE
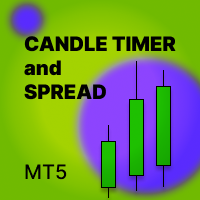
Candle_Timer_and_Spread 指标在一张图表上显示蜡烛结束之前的时间以及价格变化的百分比以及所选交易品种的点差。
默认情况下,当前时间范围内蜡烛结束之前的时间以及价格变化相对于当天开盘价的百分比的计时器位于图表的右上角。 该面板显示所选交易品种当前价格相对于当日开盘价的价差和百分比变化。该面板默认位于左上角。
输入设置: Candle_Time_Lable_Settings - 蜡烛结束前的计时器类型设置以及当前交易品种的价格变化。 Font_Size - 字体大小。 X_offset - 沿横坐标轴移动。 Y_offset - 沿纵坐标轴移动。 Text_color - 字体颜色。 Multi_Symbol_Settings - 多符号面板的设置。 Symbols_to_work - 手动输入面板将显示的符号,以逗号分隔。可以是任意数量的字符。仅显示添加到 Market_Watch 的交易品种。 Show_spread_tab - 是否显示传播列。 Show_daily_change_tab - 是否显示当前价格相对于当日开盘价的变化列。 Colorful_p
FREE

Smart Volume Activity [SVA] is an advanced analytical indicator designed for MetaTrader platforms. It reveals how institutional (Smart Money) and retail traders operate by analyzing volume behavior across multiple timeframes . Unlike ordinary volume tools, SVA automatically adapts to any chart timeframe and highlights zones of absorption — moments when large market participants absorb liquidity from weaker hands. By detecting abnormal volume spikes far beyond typical market noise, it distinguish

Azimuth 专为追求结构分析的交易者打造,在一个专业套件中提供完整的市场周期分析。
大多数ZigZag指标只显示主要摆动,而Azimuth同时揭示4个嵌套的摆动层级(L1/L2/L3/L4)— 提供早期周期入场、晚期周期警告和完整的结构背景。结合摆动锚定VWAP(非任意的每日重置)、MTF ZigZag摆动和自动ABC形态检测,您无需在图表间切换即可获得机构级别的结构分析。
主要功能
4层级ZigZag系统 - 1-4层级同时渲染(从微观到宏观摆动) - 可自定义周期(默认:9/36/144/576 — 斐波那契对齐) - 颜色编码可视化,实现即时形态识别
摆动锚定VWAP - AVWAP L3锚定于主要摆动高点/低点 - 每日VWAP参考线(机构基准) - 方向性逻辑(上升趋势中为支撑,下降趋势中为阻力) - 新摆动形成时实时更新
移动平均线 - 两条指数移动平均线用于趋势识别
ABC形态检测 - 早期周期信号(L3→L1汇合) - 主趋势信号(L2→L3汇合) - 晚期周期信号(L1→L2汇合) - 当前TF偏向过滤(Cycle/Wave模式 L4/L3)
多
FREE

介绍 Koala FVG for MT5 – 您的专业 Fair Value Gap (FVG) 模式指标 Koala FVG:您在 MT5 上精确交易的道路 解锁 Fair Value Gap (FVG) 模式的威力,使用 Koala FVG – 这是专为 MetaTrader 5 设计的先进指标。在有限的时间内,可以在其成为付费指标之前免费访问这个专业工具。 主要特点: FVG 模式检测: Koala FVG 智能识别基于可定制的最小和最大尺寸标准的 Qualified FVG 模式。 视觉呈现: 通过图形显示清晰度,其中包括动态矩形,用于说明 FVG 区域。三条线突出显示 FVG 水平,进行精确分析。 箭头入场信号: 永远不要错过交易机会。Koala FVG 提供清晰的箭头信号,指示入场点,让您能够做出明智的决策。 Koala FVG Scalper EA: 自动交易的卓越之选 通过下载 此处 可轻松将您的交易提升到新的水平。这款专家顾问与 Koala FVG 指标无缝集成,提供: 低回撤: 经验低于 7% 的回撤百分比,增强风险管理。 可靠的利润: 在整年内获得一贯和可靠的利润
FREE

VISUAL ATR CANDLESTICK SCANNER PRO - 增强型形态识别 Visual ATR Candlestick Scanner Pro 是一款旨在自动识别和筛选常见K线形态的指标,为潜在的市场反转或持续提供更清晰的视角。 I. 主要特点和功能 1. 自动化K线形态识别 该指标自动识别超过25种专业的K线形态,并将其分类为清晰的组别: 强劲看涨组 (Strong Bullish Group): 看涨吞没 (Bullish Engulfing)、三白兵 (Three White Soldiers)、晨星 (Morning Star)、看涨反冲 (Bullish Kicker) 等。 强劲看跌组 (Strong Bearish Group): 看跌吞没 (Bearish Engulfing)、三只乌鸦 (Three Black Crows)、黄昏星 (Evening Star)、看跌反冲 (Bearish Kicker) 等。 反转与持续组 (Reversal & Continuation Groups): 锤头 (Hammer)、射击之星 (Shooting St

This is Heiken Ashi smoothed version, where you can choose on what type smoothness you want to make your strategy base. You can choose between EMA or MA, on the period you want. And you can choose colors.
Definition:
The Heikin-Ashi technique averages price data to create a Japanese candlestick chart that filters out market noise. Heikin-Ashi charts, developed by Munehisa Homma in the 1700s, share some characteristics with standard candlestick charts but differ based on the values used to cre
FREE

Smart SR Levels Support and Resistance - Professional Strength-Based Support & Resistance Indicator MT5
Key Features: • Automatic detection of significant Support and Resistance levels • Line thickness based on level strength (number of touches + volume factor) • Custom colours for Support and Resistance • Multi-timeframe support • Clean background lines (no overlap with candles) • Labels showing S/R type and strength value
Perfect for price action traders, supply-demand zones, and institutio
FREE

BOOM AND CRASH PRO SPIKER This indicator is specifically designed for all boom and crash indices. The indicator targets buy spike signals for boom indices and sell spike signals for crash indices. The indicator contains optimized trend filters to target buy spikes in an uptrend and sell spikes in a downtrend. The indicator also adds a grid signal to recover some loss of the first signal. The indicator also provides exit signals for delayed spikes which can help with risk management. Also, it an
FREE

KT HalfTrend 是一种基于移动平均线的趋势指标,它在图表上绘制趋势区间。通过显示多头和空头无效区域,该指标标志着趋势的转变。 它还在主图中用箭头显示买卖趋势强度。当市场处于整理、积累或分配状态时,指标将呈现平坦状态。若市场出现明显趋势,指标会出现斜率方向。 当斜率陡峭时,无论向上还是向下,趋势信号都较为强烈。指标可用蓝色高亮显示强劲上升趋势,用红色高亮表示强劲下跌趋势。
功能特点
操作简便,界面友好,具有独特的趋势识别方式。 适用于所有货币对及任何时间周期。 支持激进型和稳健型两种交易入场方式。 支持自定义移动平均线、抛物线SAR参数及颜色显示设置。
应用说明 通常,当价格上穿指标斜率,且 HalfTrend 显示为蓝色时,视为买入信号。 价格K线下方会出现蓝色向上箭头,表明当前为多头趋势。建议将止损位设置在指标下方。 若看到红色向下箭头,说明可能反转,可考虑平多或设置止盈。 当价格下破指标斜率,且 HalfTrend 变为红色,说明趋势转为空头,形成卖出信号。 价格K线上方会显示红色向下箭头,建议止损位设在指标上方。 若出现蓝色向上箭头,可平空或设置止盈位置。

MACD 日內趨勢 PRO 是通過改編自 Gerald Appel 在 1960 年代創建的原始 MACD 而開發的指標。
通過多年的交易,觀察到通過使用斐波那契比例更改 MACD 的參數,我們可以更好地呈現趨勢運動的連續性,從而可以更有效地檢測價格趨勢的開始和結束。
由於其檢測價格趨勢的效率,還可以非常清楚地識別頂部和底部的背離,從而更好地利用交易機會。
特徵 MACD 日內趨勢 PRO 指標適用於任何貨幣對、任何時間範圍以及 Renko 圖表。 可以通過選擇 6 種模式來設置趨勢檢測速度: 最快的 快速地 普通的 減緩 最慢
資源 它有 6 個可配置的警報: MACD回調信號線 MACD穿越信號線 MACD穿過零水平 信號線過零電平 MACD 變化趨勢顏色 信號線變化趨勢顏色 對於每個警報,可以配置: 彈出 聲音(有 13 種聲音可用。) 智能手機通知 彈出窗口和聲音 彈出窗口和智能手機通知 聲音和智能手機通知 彈出窗口、聲音和智能手機通知
與智能交易系統或其他指標集成 有 8 個緩衝區可用於訪問和與專家顧問或其他指標集成,即使關閉警報,它們也會被填滿,它們是: 緩衝

High Low Today (MT5) is a free, easy-to-use MetaTrader 5 indicator that displays the current day’s High and Low price levels on your chart. It even offers optional push notifications to alert you when the price touches or breaks these key levels. With a clean and minimalist design, it provides valuable intraday insights without cluttering your chart. Marks the current day’s High and Low on the chart (key intraday support/resistance levels) Clean, lightweight, and unobtrusive – only the essenti
FREE
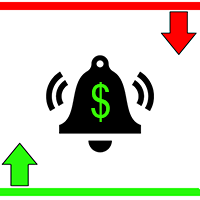
一个智能助手,准确和及时的市场进入. 当价格达到水平时,指示器发出蜂鸣声和警报. 您可以手动设置支撑和阻力水平或将其委托给算法。 在价格达到水平的那一刻,蜡烛图案被额外标记。 独特的蜡烛模式是经典模式和模式的崩溃和反弹水平的共生。 对于证券交易所的高利润交易,在大多数情况下,下订单是不够的,交易者需要亲自查看和分析价格在接近重要水平时的表现。 我认为所有交易者都遇到过这样一种情况:我们在交易日开始时设定了重要目标,然后错过了价格达到它们的那一刻。 结果,入场的那一刻被错过了,我们得到了额外的负面情绪,看着价格完全按照我们的计划移动。 但你不在那里,也没有利润。 交易愉快和舒适! 不要再连续几天盯着显示器看了。 确定对你来说很重要的级别,然后去做你的生意,其他的工作,或者只是放松一下。 当价格达到设定水平时,您将收到通知,并可以立即开始交易。 有了这个指标,你将不再错过进入市场的最佳时机。 今天开始使用警报级别,看看它如何简化交易过程并提高其效率。 您可以下载指标的试用版。 在试用版中,您只能设置一个警报级别。 否则,功能没有什么不同。 下载MetaTrader5的指标: https:/
FREE

Cybertrade Auto Fibonacci retraction and projection - MT5
Auto Fibonacci is an indicator that automatically plots the Fibonacci retracement and projection based on the number of bars you select in the indicator setting. You can customize nine different levels of retraction and three levels of projection. It works on periods longer than the period visible on the chart. All values are available in the form of buffers to simplify possible automations. This indicator is the same one we use in ou
FREE

This indicator displays Pivot-Lines, preday high and low, preday close and the minimum and maximum of the previous hour. You just have to put this single indicator to the chart to have all these important lines, no need to setup many single indicators.
Why certain lines are important Preday high and low : These are watched by traders who trade in a daily chart. Very often, if price climbs over or falls under a preday low/high there is an acceleration in buying/selling. It is a breakout out of a
FREE
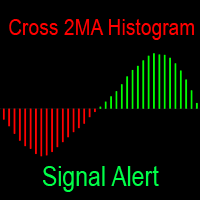
该指标以直方图的形式显示两个移动平均线之间的差异。 移动平均线有巨大的自定义选项。 当直方图的颜色发生变化时,它会以各种方式通知您:它在终端中发出蜂鸣声,向手机发送通知并向邮件发送电子邮件—现在您绝对不会错过任何交易。 一个完全免费的移动平均线交叉指标,以图表上的线条形式显示: https://www.mql5.com/zh/market/product/148478 你的反馈对我很重要。 反馈使发展变得更好,并帮助我们共同前进。 您有任何问题或想分享您的意见吗? 写评论或发送消息-我总是保持联系! 这个工具成为您可靠的助手,接管日常监控市场。 您可以将此任务委托给指标,而不是不断查看图表以预测相交时刻。 它不仅使用清晰的直方图列可视化趋势强度的动态,而且还充当看门狗,在最关键的时刻立即用强大的警报唤醒您。 这使您可以毫不拖延地采取行动,情绪和大惊小怪,严格遵循您的交易策略。 设置的灵活性为具有任何经验和分析方法的交易者提供了机会。 您可以通过将移动平均线周期与任何时间段和交易资产进行匹配来试验移动平均线周期,从分钟图表上的倒卖到长期投资。 该指标将同样有效地用于过滤信号和准确确定进入
FREE

The Price Action Finder indicator is an indicator of entry points, which is designed to search and display patterns of the Price Action system on a price chart. The indicator is equipped with a system of trend filters, as well as a system of alerts and push notifications. Manual (Be sure to read before purchasing) | Version for MT4 Advantages
1. Patterns: Pin bar, Outside bar, Inside bar, PPR, Power bar, Hanging man, Inverted hammer 2. Pattern filtering system. Removes countertrend patterns from

一个专业的交易工具是RSI和价格之间的背离指标,它允许您及时收到关于趋势反转的信号或捕捉价格回调走势(取决于设置)。 指标设置允许您根据RSI峰值的角度和价格的百分比变化来调整发散的强度,这使得微调信号强度成为可能。 指标代码经过优化,并作为Ea交易的一部分进行了非常快速的测试。
指标不重绘,交易方向的箭头正好位于信号出现的位置--在柱的开口处。 Fractal True . PeriodRSI_P = 14 ; //Period IndentFrom50_P = 10.0 ; //Indent +- from 50 [0...50] LeftBars_P = 1 ; //LeftBars RightBars_P = 1 ; //RightBars IndDivForce_P = 15.0 ; //Divergences force of indicator (not for the Lite version) PriceDivForce_P = 0.01
FREE

Divergence Matrix SE – Special Edition
精准标注关键背离,直观识别价格潜在反转点!
自动显示背离点,辅助你更好分析行情,不再错过重要走势! Divergence Matrix SE 保留了 MACD、MACD Histogram、Stochastic 三大指标背离标注,是轻量精简的体验版。为了保证信号可靠性,指标会在背离发生后 延迟4根K线显示 ,这样可以过滤掉市场噪音,让你看到更稳妥的信号。SE版经过精简设计,只保留核心背离功能,运行流畅、界面清爽,非常适合新手入门,也可作为专业交易者快速参考的辅助工具。 使用 SE 版,你可以: 自动捕捉核心背离点,无需手动查找; 清楚了解背离点背后的趋势变化; 快速体验背离分析方法,学习结合自己交易策略使用。 想解锁更多指标和高级功能?
Lite/SE版只是入门体验,如果你想使用 14个指标背离合集 + 高级功能 ,请点击下面链接直接体验完整版,让你的交易工具更强大:
立即体验完整 Divergence Matrix 下载 Divergence Matrix SE ,轻量精简、核心功能齐全,帮你快速掌握背
FREE

Position Size Calculator PRO MT5 (v2.20) Position Size Calculator PRO 是一款专业的 MetaTrader 5 风险管理工具。它根据您的每笔交易风险、止损距离和品种规格(跳动点值、跳动点大小、最小/最大/步进交易量、保证金)来计算建议的手数。 无交易操作: 该指标 不会 开仓/平仓,也不管理持仓。它是一个决策辅助工具,旨在规范您的资金管理并减少进入前的头寸计算错误。 图表显示内容 建议手数 (根据风险和止损距离计算) 入场价格 / 止损 (SL) / 止盈 (TP) 以及点数距离 预估风险 (账户货币及百分比)和止损时的潜在损失 潜在利润 (在止盈位)+ 风险回报比 (R:R) 所需保证金 和保证金水平(如果经纪商支持) 预估盈亏平衡点 (包含点差) 视觉化止损/止盈区域 + 实时价格标签(可选) PRO 版本核心功能 (v2.20) 可拖动的止损/止盈线 ,精确调整水平( 不会导致图表滚动 ) 荧光高亮选择 :止损 = 红色 / 止盈 = 绿色 区域从当前形成的蜡烛开始 ,界面更整洁 区域向前延伸 (可调节 K 线数

To get access to MT4 version please click https://www.mql5.com/en/market/product/130055  ; - This is the exact conversion from TradingView: "Ut Alart Bot Indicator". - You can message in private chat for further changes you need. Here is the source code of a simple Expert Advisor operating based on signals from Ut Bot Indicator . #property copyright "This EA is only education purpose only use it ur own risk" #property link " https://sites.google.com/view/automationfx/home " #property versio
FREE

This indicator finds and displays the Double Bottom and Double Top technical analysis patterns. Signals (displays a message on the screen) if the shape was formed recently. Often after the appearance of these patterns, the trend reverses or a correction occurs. In order not to search for them yourself, or not to miss their appearance, it is enough to add an indicator to the chart. The indicator can be used on different timeframes and currency pairs, there are settings for a better search on a c
FREE

Bar Countdown With Symbol Info is a sleek, non-intrusive Heads-Up Display (HUD) designed to keep essential market data in front of your eyes without cluttering the chart. It combines a smart candle timer with a comprehensive symbol information strip.
Key Features: Smart Candle Countdown: Follow-Price Mode: The timer attaches dynamically to the Bid price line, moving up and down with the market so your eyes never leave the action. Dynamic Coloring: The background changes color in real-time
FREE

Trend Battle Indicator
Overview The Trend Battle Indicator is a professional technical analysis tool that reveals the battle between buyers (Bulls) and sellers (Bears) in the market through a comprehensive dashboard. Using an intuitive visual interface, the indicator offers a unique perspective on market power dynamics by analyzing the last twenty bars to provide precise insights into momentum and directional strength. Additionally, the panel provides automatic real-time updates for bars in for
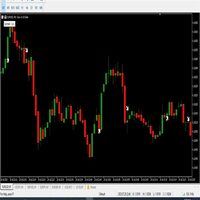
hello,
king binary sureshot mt5 binary indicator,
1 minute candle
1 minute expire
Alright. This indicator works on MT5 and is very easy to use. When you receive a signal from it, you wait for that candle with the signal to close and you enter your trade at the beginning of the next new candle. A red arrow means sell and a green arrow means buy. All arrows comes with a long dotted like for easy identification of trade signal. Are you okay with that?
FREE

Good old UT BOT converted from TradingView script by ' QuantNomad ', initially by ' Yo_adriiiiaan ' and ' HPotter ' - so you can bet this is powerful tool. If you know, you know. This is top of the line, while keeping it really simple.
Main function: trend identification with trend switch points , created by EMA(source) and ATR -source is CLOSE PRICE with option to use HEIKEN ASHI chart instead, for this you need "Heiken Ashi" indicator - its available as free download by MetaQuotes
One of th

概述 本指标是经典 Donchian 通道 的增强版,增加了多种实用的交易功能。
除了标准的三条线(最高、最低和中线),系统能够检测 突破 ,并在图表上用箭头进行可视化标记,同时只显示 与当前趋势方向相反的那条线 ,让图表更加简洁。 功能包括: 可视化信号 :突破时在图表上绘制彩色箭头 自动通知 :弹窗、Push 推送和 Email 邮件 RSI 过滤 :根据市场相对强弱验证信号 个性化设置 :颜色、线条粗细、箭头符号、RSI 阈值等 工作原理 Donchian 通道计算: 上轨线 :最近 N 根已收盘 K 线的最高价 下轨线 :最近 N 根已收盘 K 线的最低价 中线 :最高价和最低价的平均值 看涨突破 :收盘价高于上轨线
看跌突破 :收盘价低于下轨线 指标会: 绘制三条 Donchian 通道线 仅在 方向变化后的首次突破 绘制箭头 隐藏顺应趋势方向的那条线(上涨趋势: 只显示红色下轨线;下跌趋势: 只显示绿色上轨线) 可选用 RSI 过滤突破信号,减少虚假突破 支持实时发送通知 参数说明 Donchian 通道设置 indPeriod :计算通道高低点的已收盘 K 线数量 Lin
FREE

Projective SR – 实时预测的支撑与阻力 Projective SR 是一款先进的指标,它能自动检测图表上的 关键支撑与阻力点 ,并以 动态的对角线形式将其预测至未来 ,从而预示价格可能发生反应的潜在区域。 与只显示固定水平的传统指标不同, Projective SR 分析价格的几何结构 ,识别出最相关的 关键点 (Pivots) ,并绘制出 倾斜的线条 来适应市场走势。 这些线条 实时更新 ,并在新K线形成时展示价格结构是如何演变的。 技术特点 (Jìshù Tèdiǎn) 基于 K 线结构的自动关键点检测 (高点和低点)。 精确的几何预测 ,使用 实时计算 (而非基于K线数量)。 预测性的支撑与阻力线 ,能够预见未来的价格走势。 灵活的配置: 关键点敏感度、预测长度、颜色、粗细和标签。 稳定模式: 除非检测到新的确认关键点,否则线条保持固定不变。 优势 (Yōushì) 帮助您 清晰地可视化市场可能的方向 。 允许您 提前发现 结构区域内的 突破或反弹 。 是 剥头皮 (Scalping) 、 波段交易 (Swing) 或 高级技术分析 的理想选择。 兼容任何交易品种或
FREE

Special offer : ALL TOOLS , just $35 each! New tools will be $30 for the first week or the first 3 purchases ! Trading Tools Channel on MQL5 : Join my MQL5 channel to update the latest news from me 通过 Inversion Fair Value Gaps Indicator 解锁 ICT 的 反转公平价值缺口 (IFVG) 概念的强大功能!这款尖端工具将公平价值缺口 (FVG) 提升到新的水平,通过识别并显示反转 FVG 区域——价格修复后形成的关键支撑和阻力区域。无论您是短线交易者、波段交易者还是长期投资者,IFVG 指标都能为实时决策提供宝贵的见解。 查看 MT4 版本: Inversion Fair Value Gaps MT4 Multi TF 查看更多产品: 所有 产品 Some Usage Tips for Inversion Fair Valu

请允许我介绍一下 Golden Sniper Indicator ,这是一款精心打造的 MQL5 工具,专为希望提升交易体验的交易员而设计。由一支经验丰富的交易团队开发,拥有超过 6 年的经验 ,该指标提供了一种可靠的方法,以卓越的准确性识别交易机会。 主要特点 : 警报和信号箭头 :Golden Sniper Indicator 及时提供警报和视觉信号箭头,帮助您识别趋势反转。 风险管理 :它根据**风险-回报比(RRR)**建议适当的获利和止损水平。 适应性 :无论您是新手还是专业交易员,该指标都适用于各种交易风格,包括摆动交易和快进快出。 可定制设置 :根据您的偏好调整指标。 建议 : 时间框架 :Golden Sniper Indicator 在所有时间框架上表现良好。对于快进快出,可以考虑 M5 和 M15,而摆动交易者可能更喜欢 M30 和 H1。 货币对 :最佳表现出现在货币对如 EURUSD、GBPUSD、AUDUSD、EURGBP、EURUAD 和 XAUUSD 上。 风险管理 :遵循默认的止损设置,以实现有效的风险管理。 获利水平 :根据风险-回报比原则,选择 0

The Omega Trend Indicator is an advanced tool that has been specifically designed to detect market trends early, and follow them efficiently. The indicator draws two lines. The main (thicker) Trend Line represents the presumed lower or upper volatility limits of the current market trend. A break in the main Trend Line indicates a potential reversal or shift in the movement of the trend. The Trend Line also indicates the best point to place a stop loss order. In Omega Trend Indicator, the Trend L
FREE

布林带指标的多货币和多时间框架修改。 在仪表板上,您可以看到布林带的突破和触及。 在参数中,您可以指定任何所需的货币和时间范围。 当价格触及布林线、当前波动率发生变化(扩大或下跌)以及价格触及所有布林线时,该指标还可以发送通知。 通过单击带有句点的单元格,将打开该符号和句点。 这是 MTF 扫描仪。
默认情况下,从图表中隐藏仪表板的键是“D”.
参数 Bollinger Bands Settings Averaging period — 计算指标的平均周期。 Standard deviations — 与主线的标准差数。 Bands shift — 指标相对于价格图表的移动。 Applied price — 用于计算的价格。 Show BB on the current chart — 在当前图表上显示 BB
仪表板 Clear the chart at startup — 启动时清除图表。 Set of Pairs — 符号集 — Market Watch — 来自 MT 的“市场观察”的货币对。 — Specified manually — 在参数“Pairs”中手动指定对
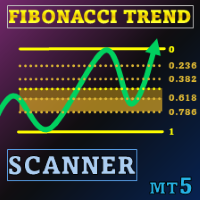
特别优惠 : ALL TOOLS ,每款仅 $35 ! New tools will be $30 for the first week or the first 3 purchases ! Trading Tools Channel on MQL5 : Join my MQL5 channel to update the latest news from me 在波动剧烈的交易环境中,一款功能强大且直观的分析工具可以帮助您迅速抓住机会。Fibonacci Trend Scanner不仅结合了传统Fibonacci指标与SuperTrend功能,而且通过货币对扫描、多周期监控以及当趋势在多头与空头之间转换时的智能提醒,进一步扩大了其应用范围。 See more MT4 version at: Fibonacci Trend MT4 Scanner See more products at: All Products 1. 结合SuperTrend技术的趋势分析 Fibonacci Trend Scanner采用 SuperTrend 算法,可快速准确

This indicator is specifically designed for boom 1000 index. The indicator contains optimised trend filters to target buy spikes in an uptrend. The indicator also add a grid buy signal to recover some loss of the first buy signal. The indicator also provides exit signals for delayed spikes which can help with risk management .Also it analyses signals for historical data and displays percentage of good signals provided by the indicator. KEY FEATURES Non-lagging indicator. Non-repaint. Enable/d
FREE

The Hydra Multi Trend Dashboard is a powerful market scanning tool designed for MetaTrader 4 and MetaTrader 5. It monitors up to 25 currency pairs or assets simultaneously across all 9 standard timeframes (M1 to Monthly). Using a proprietary Special Trend Formula , the dashboard filters out market noise and provides clear, visual Bullish or Bearish signals, allowing traders to identify trend alignments at a glance without switching charts. Setup & Guide:
Download MT4 Version here. Exclusivel

Indicator for manual trading and technical analysis for Forex.
It consists of a trend indicator with the opening level of the trading day and a arrow indicator for determining entry points.
The indicator does not recolor; it works when the candle closes.
Contains several types of alerts for signal arrows.
Can be configured to work on any chart, trading instrument or time frame.
The work strategy is based on searching for price movements along the trend.
To make " Buy " transactions: The tre
Candle Timer Countdown (CTC) – Minimalist & Precise Candle Timer Candle Timer Countdown (CTC) is a lightweight and non-intrusive MetaTrader indicator that displays the remaining time of the current candlestick on your chart. Designed with simplicity and clarity in mind, this tool helps traders stay aware of candle closures without cluttering the chart. Key Features: Real-Time Candle Countdown
Always know how many seconds are left before the current candle closes – works on all timeframes. Minima
FREE
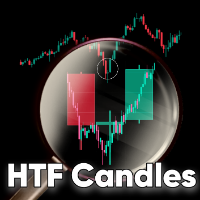
HTF Candles is an indicator which plots the outline of the higher time-frame candles on the lower candle. The indicator gives you the option to choose whether or not to view live current HTF candle, with no lag or repainting. Features No objects drawn on chart: The indicator does not plot any lines or rectangle objects on the chart, it simply draws the htf candles. This keeps your chart simple and clean. MTF Selection: The indicator allows you to choose all the different higher time-frames for e
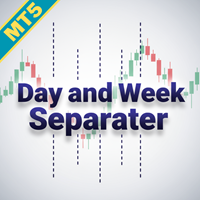
通过 Day and Week Separator MT5 优化您的交易分析,这是一款直观的工具,旨在绘制可自定义的每日和每周分隔线,非常适合处理经纪商时区差异的交易者。在 Forex Factory 和 Reddit 的 r/Forex 等交易社区中广受好评,因其简单而高效,这款指标解决了将图表时间框架与本地或特定市场时间对齐的常见问题,正如 Investopedia 和 TradingView 等平台上的讨论所强调的。交易者称赞其提高图表清晰度的能力,用户报告通过清晰标记交易时段,基于会话的分析得到改善,交易计划效率提高高达 20%,尤其是在时区偏移较大的地区(例如,使用欧洲经纪商的亚太地区交易者)。其优势包括精确可视化每日和每周市场过渡、可自定义的时区偏移以匹配本地或策略性时间,以及轻量级设计,可无缝集成到任何交易系统中,非常适合剥头皮、日内交易和波段交易者,旨在基于时间市场周期优化入场和出场。 Day and Week Separator MT5 在用户指定的时间(例如,图表时间 7:00 对应本地时间 00:00)绘制垂直虚线(默认 dash-dot-dot 样式,宽度 2)
FREE

这个多时间框架和多品种指标识别双重或三重顶部/底部形态或随后的颈线突破(确认顶部/底部)。它提供 RSI、pin bar、吞没、镊子、早/晚星过滤器以及发散过滤器选项,可以仅过滤掉最强的设置。 该指标也可用于单一图表模式。请在产品的 博客 。 结合您自己的规则和技术,该指标将允许您创建(或增强)您自己的强大系统。 特征
可以同时监控您的市场报价窗口中可见的所有交易品种。将该指标仅应用于一张图表,并立即监控整个市场。 可以监控从 M1 到 MN 的每个时间范围,并在识别出第二个或第三个顶部/底部或颈线突破时向您发送实时警报。支持所有 Metatrader 原生警报类型。 可以使用 RSI,从不同的蜡烛形态和背离中进行选择,以正确识别潜在的逆转。 该指示器包括一个交互式面板。当单击一个项目时,将打开一个带有相关代码和时间范围的新图表。 该指标将信号写入文本文件,EA 交易系统 (EA) 也可以使用该文件进行自动交易。比如 这个产品 。
输入参数
输入参数的描述和解释可以在 这里 找到。 重要的 请注意,由于具有多功能性,既不会在安装指标的图表上绘制买卖建议,也不会绘制线条和

This is a simple order block locator. Searched for the existence of order blocks only at extremums. If you want multi criteria order block location check my other indicator which is more powerful here These order blocks are ICT order blocks without any buttering.
The indicator can be a useful tool for detecting reversals, continuations. You can also use the indicator as confluence with your other tools
FREE

REVERSAL POWER PRO
The ONLY Indicator That Shows You Where Markets WILL Reverse - BEFORE They Move
WELCOME TO THE NEXT LEVEL OF TRADING PRECISION
Tired of guessing where the market will turn? Missing entries because you don't know where support/resistance REALLY is? Getting stopped out at "fake" levels? Wondering if your bias is correct before entering?
What if you had: Crystal-clear Supply/Demand Zones that markets RESPECT Daily Bias Engine telling you market directio
FREE

Sigma Indicator is used by Sigma Expert advisor for plotting the zones but now its available for members to apply their stratagies on Sigma supply and demand levels.
Instructions:
1- Donot Change time frames instead run several pairs with different time frames with sigma indicator 2- For exness : Search for smaller zone = True
For other brokers keep it False
3- Maximum zone size = 0
4- Minimum zone size = 0
5 - Back candles = 300

ZigZag 指标的多货币和多时间框架修改。 显示市场的当前方向、上次走势的高度、本次走势中的柱数以及锯齿形调整浪(水平线)的前一个点的突破。 这是 MTF 扫描仪。
您可以在参数中指定任何所需的货币和时间范围。 此外,当之字折线改变方向或突破前一点时,面板可以发送通知。 通过单击带有句点的单元格,将打开该符号和句点. 指标——连接关键低点和高点以显示趋势线
参数 Depth — 如果最后一根蜡烛的偏差小于(或大于)前一根,则 Zigzag 将不会绘制第二个最大值(或最小值)的烛台的最小数量; Deviation — 锯齿形形成局部顶部/底部的两个相邻烛台的最高点/最低点之间的最小点数; Backstep — 局部高点/低点之间的最小烛台数量; Bars to calculate ZZ — 历史中用于查找 ZigZag 点的柱的数量. ZZ-wave info — 表格中显示有关波形的哪些信息 — 仅当前波形或当前波形 + 上一个波形; Highlight the symbol when all periods are in the same direction — 方向时突出显

多货币和多时间范围指标 Inside Bar (IB)。 在参数中,您可以指定任何所需的货币和时间范围。 该面板显示最后找到的内部柱线(和母柱线)形态、当前价格位置以及母线和内部柱线水平的突破。 您可以设置单元格中的条形和文本的大小和颜色。 当水平被突破时,该指标还可以发送通知。 通过单击带有句点的单元格,将打开指定的交易品种和句点。 这是 MTF 扫描仪。
默认情况下,从图表中隐藏仪表板的键是“D”.
参数 How long pattern will be valid after first breakout (bars) — 信号将在单元格中显示多少柱 IB body must be inside of the MB body - IB 主体必须位于 MB 主体内部。 IB body and wicks must be inside the MB body - IB 主体和灯芯必须位于 MB 主体内。 If MB is IB, choose the next MB — 如果找到的母柱是前一个信号的内柱,则将显示前一个信号。 MB body must be large tha
MetaTrader市场是独有的自动交易和技术指标商店。
阅读MQL5.community用户备忘更多地了解我们提供给交易者的独特的服务:复制交易信号,自由职业者开发的自定义应用程序,通过支付系统完成的自动付款和MQL5云网络。
您错过了交易机会:
- 免费交易应用程序
- 8,000+信号可供复制
- 探索金融市场的经济新闻
注册
登录