Master of Breakouts MT4

Master Breakout Trading Strategy By Naveen Saroha - Premium Trading System

🎯 Revolutionary Trading Architecture

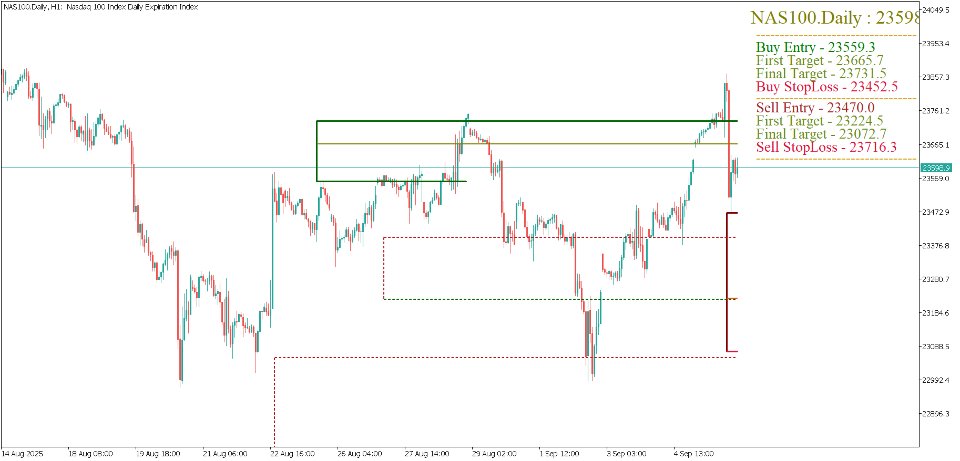
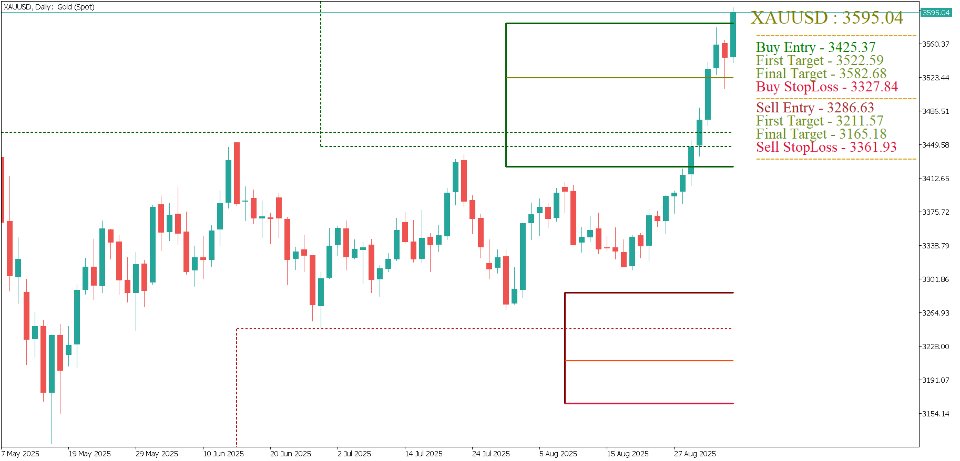
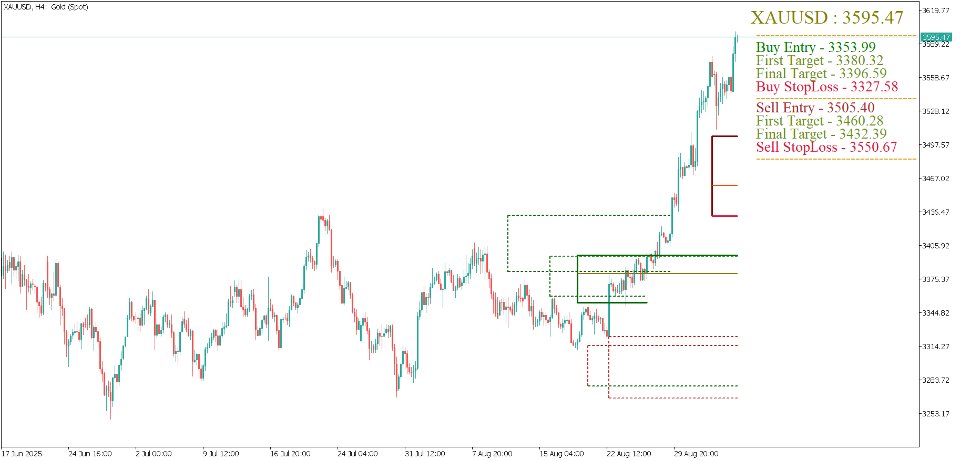
The Master Breakout Strategy represents a paradigm shift in technical analysis, combining advanced mathematical modeling with institutional-grade precision to identify and capitalize on high-probability market breakouts. This isn't just another trading system—it's a comprehensive market analysis framework that thinks like the algorithms used by professional trading firms.

Core Technological Superiority

Intelligent Swing Detection Engine

  • Adaptive Swing Analysis: Dynamic swing identification that adjusts to market volatility
  • Multi-Timeframe Synchronization: Processes up to 1000 historical candles for context-aware decision making
  • Precision Depth Control: Configurable sensitivity (Length parameter) to filter noise while capturing significant moves

Mathematical Trendline Mastery

  • Geometric Price Projection: Calculates exact intersection points using time-based trendline mathematics
  • Dynamic Center Point Logic: Identifies optimal entry zones at the precise convergence of swing patterns and trend geometry
  • Algorithmic Distance Calculation: Measures exact price-to-trendline relationships for target optimization

🚀 Advanced Entry & Exit Mechanics

Multi-Layered Signal Generation

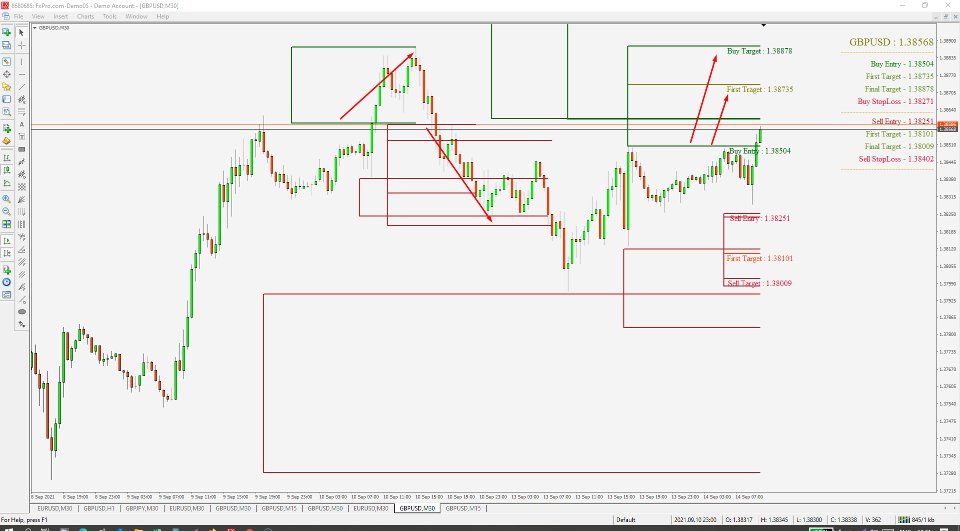
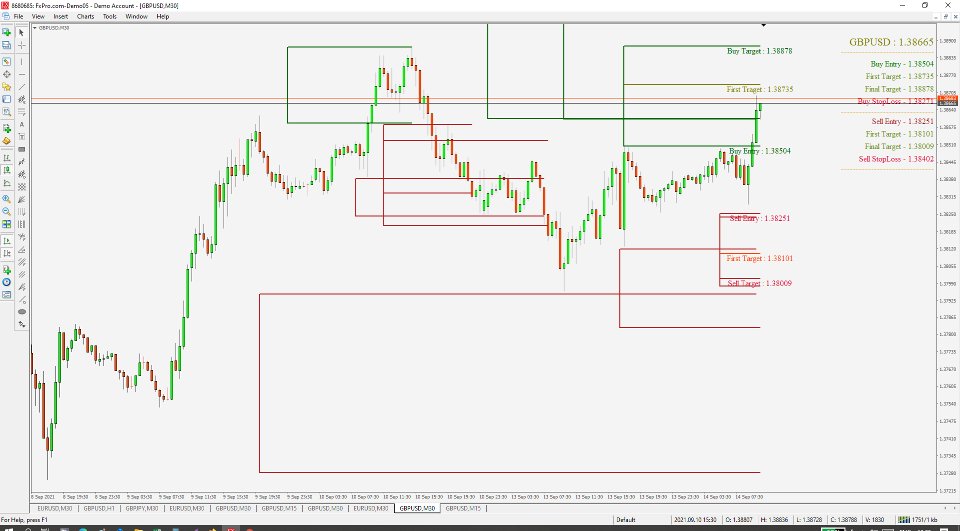
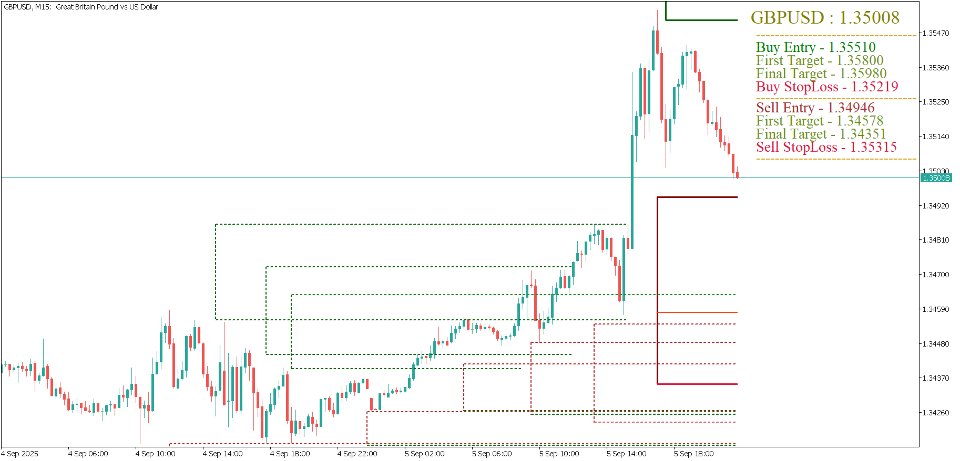
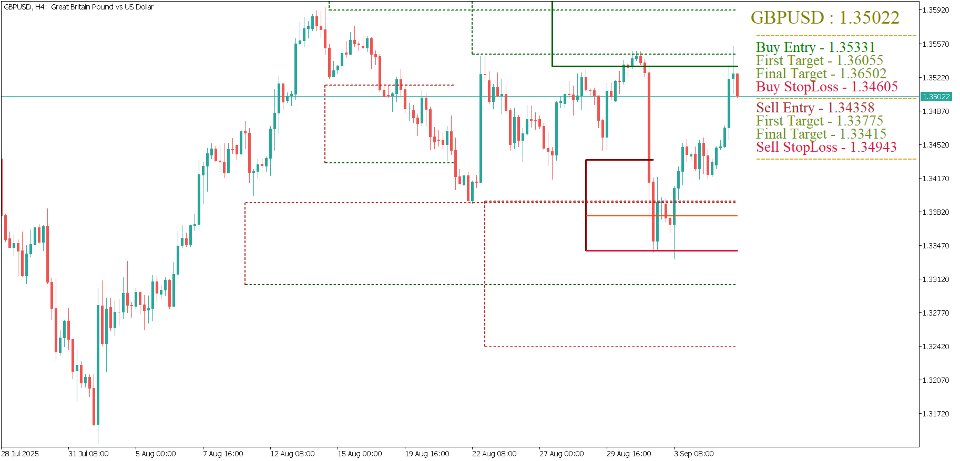
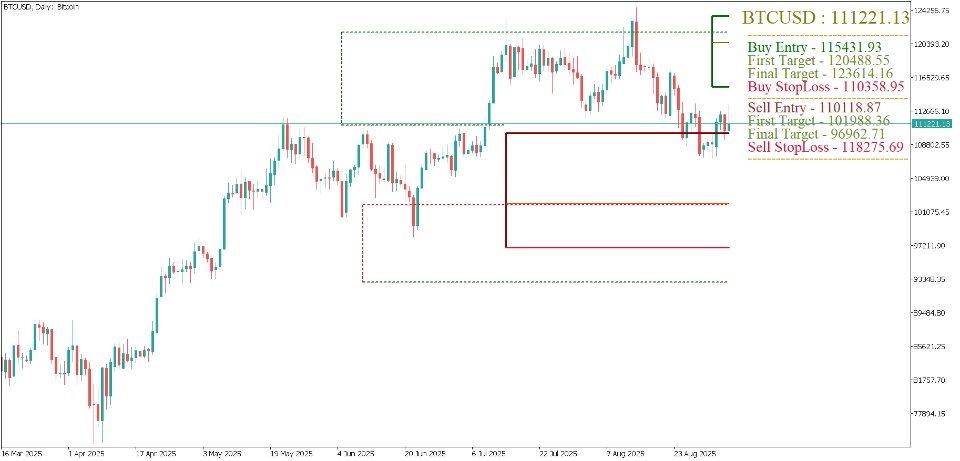
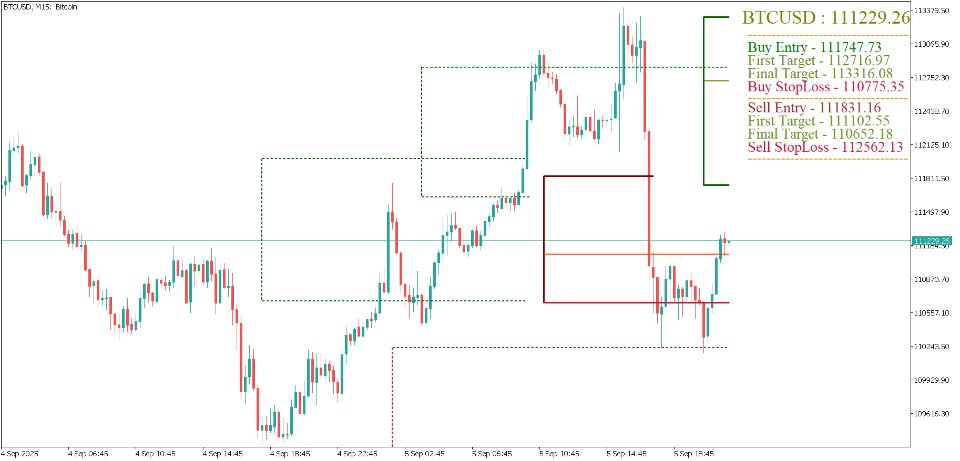
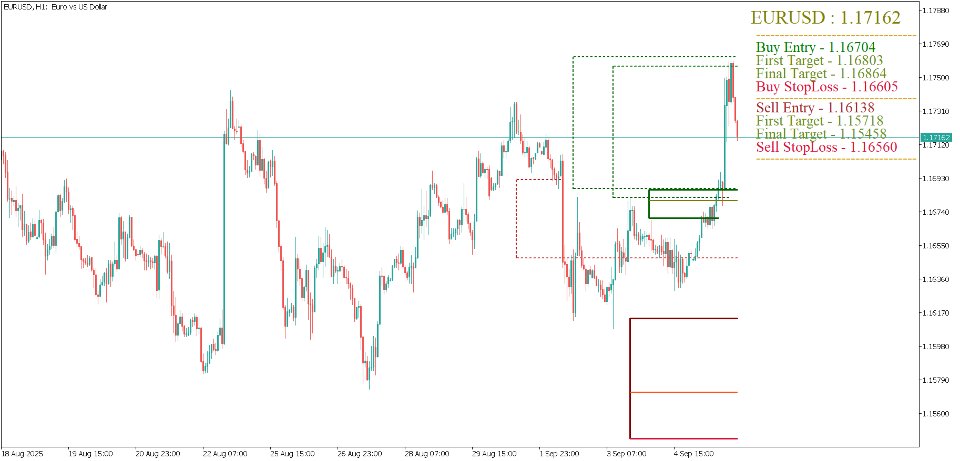
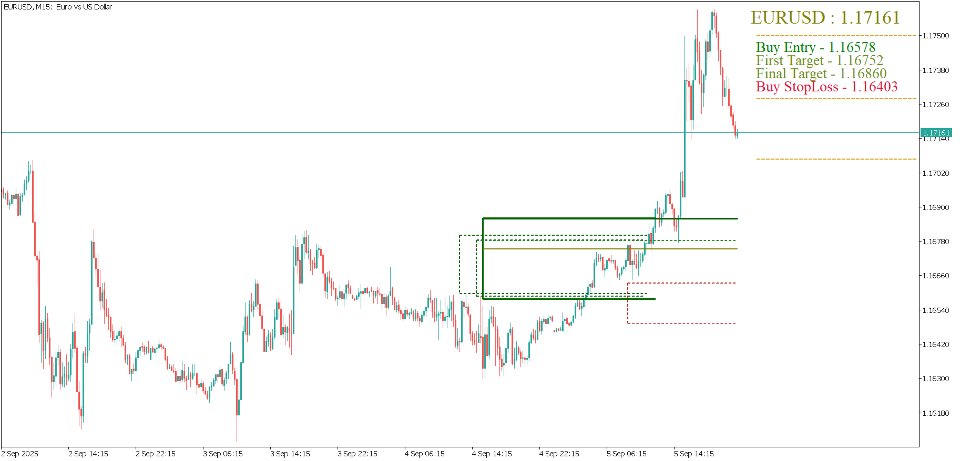
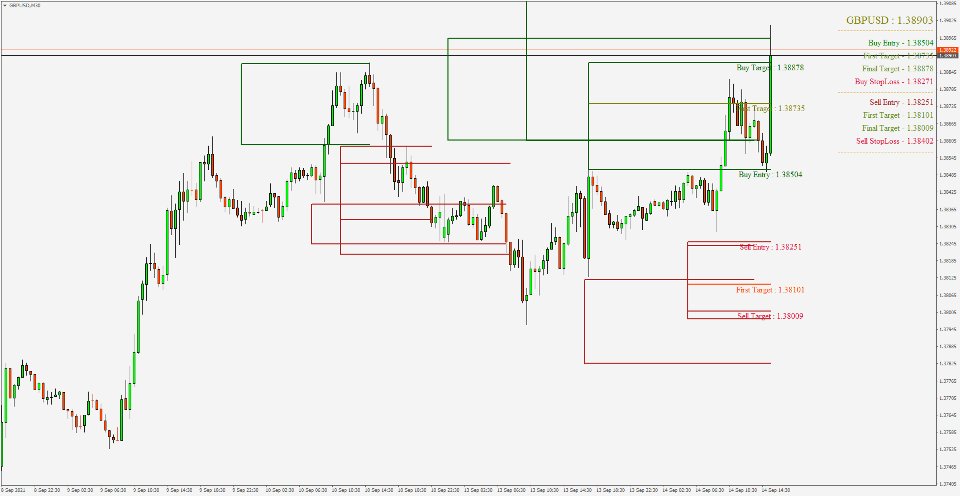
  • Primary Breakout Confirmation: Solid-line entries for high-conviction trades
  • Secondary Opportunity Detection: Dashed-line entries for position scaling and risk diversification
  • Intelligent Pattern Recognition: Distinguishes between false breakouts and genuine momentum shifts

Sophisticated Target Architecture

  • Fibonacci-Enhanced Targeting: 61.8% intermediate targets for optimal profit-taking psychology
  • Dynamic Risk Assessment: Automated 62% stop-loss calculation maintaining consistent risk-reward ratios
  • Extended Projection Lines: Visual confirmation of long-term price objectives

💎 Professional-Grade Features

Real-Time Intelligence Dashboard

  • Live Market Analytics: Instant display of all entry levels, targets, and risk parameters
  • Color-Coded Visualization: Intuitive green/red system for immediate trade direction recognition
  • Professional Layout Design: Clean, distraction-free interface optimized for high-stress trading environments

Institutional-Quality Alerts

  • Smart Notification System: Precision alerts triggered only at confirmed breakout moments
  • Multi-Asset Compatibility: Seamless operation across forex, indices, commodities, and cryptocurrencies
  • Configurable Alert Preferences: Customizable notification settings for different trading styles

🎨 Visual Excellence & User Experience

Advanced Chart Integration

  • Cyan Logic Lines: Transparent visualization of the mathematical reasoning behind each signal
  • Gradient Color Schemes: Professional aesthetic that reduces eye strain during extended trading sessions
  • Scalable Interface Elements: Adjustable text and line sizes for different screen configurations

Intelligent Object Management

  • Auto-Cleanup System: Prevents chart clutter by managing historical signals automatically
  • Layered Information Display: Hierarchical organization of critical vs. supplementary data
  • Cross-Platform Compatibility: Flawless operation on both MT4 and MT5 platforms

⚔️ Competitive Advantages

Precision Engineering

Unlike basic breakout systems that rely on subjective pattern recognition, Master Breakout employs quantitative trendline mathematics to eliminate guesswork and emotional bias from trading decisions.

Multi-Dimensional Analysis

The strategy doesn't just identify breakouts—it predicts optimal entry timing by calculating the exact mathematical relationship between swing patterns and trend continuation probabilities.

Risk-Optimized Framework

Every signal comes pre-calculated with precise risk parameters, ensuring consistent position sizing and capital preservation across all market conditions.

Scalability & Flexibility

  • Configurable Position Sizing: Up to 3 entry levels per direction for advanced position management
  • Adaptable Parameters: Fine-tunable settings for different market personalities and trading styles
  • Universal Application: Effective across all timeframes from scalping to swing trading

🏆 Professional Trading Edge

Institutional-Grade Logic

The Master Breakout system mirrors the mathematical precision used by quantitative hedge funds, bringing Wall Street-level analytics to individual traders.

Psychological Advantage

By providing pre-calculated entries and exits, the system eliminates the emotional stress and second-guessing that destroys most traders' accounts.

Consistent Performance Framework

The strategy's rule-based approach ensures reproducible results, allowing traders to build genuine expertise rather than relying on luck or intuition.

The Master Breakout Strategy isn't just a trading tool—it's a complete market analysis ecosystem designed for serious traders who demand institutional-quality precision in their trading decisions.

Productos recomendados
TradeLogic Pro – The Advanced MT4 EA for Long Term Investing TradeLogic Pro   is an advanced   MetaTrader 4 Expert Advisor (EA)   designed to harness the power of price imbalances in the forex trading markets. Whether you’re a beginner or a professional trader,   TradeLogic Pro   uses sophisticated market analysis to identify high-potential entry points, allowing you to trade smarter and more efficiently. How Does TradeLogic Pro Work? At the core of   TradeLogic Pro   is its ability to   detect
Este indicador ha sido diseñado para integrarse con la teoría de las Ondas de Elliott, proporcionando dos métodos distintos de operación: Trabajo Automático: En este modo, el indicador opera de manera autónoma al detectar las cinco ondas motrices en el gráfico de acuerdo con la teoría de las Ondas de Elliott. Ofrece predicciones e identifica zonas potenciales de reversión. Además, tiene la capacidad de generar alertas y mensajes push para notificar a los traders sobre desarrollos significativos
Indicement MT4
Profalgo Limited
5 (2)
¡Bienvenido a Indicement! ¡PROP FIRM LISTO! -> descargar archivos del conjunto   aquí PROMOCIÓN DE LANZAMIENTO: ¡Solo quedan unas pocas copias al precio actual! Precio final: 990$ NEW: Choose 1 EA for FREE! (limited to 2 trading account numbers) Oferta combinada definitiva     ->     haga clic aquí ÚNETE AL GRUPO PÚBLICO:   Haz clic aquí   VERSION 4.0 LIVE RESULTS OLD VERSION FINAL RESULTS INDICEMENT   aporta mis 15 años de experiencia en la creación de algoritmos comerciales profesionales a l
Una gran adición a su lucrativa cartera de asesores expertos. La estrategia se basa en un algoritmo para atravesar los niveles construidos durante un cierto período de tiempo. El EA tiene un StopLoss fijo, que le permite mantener la reducción mínima. Probado en todos los ticks utilizando Tick Data Suite, con las condiciones comerciales reales más cercanas posibles, vea el video Precio para los primeros 10 compradores $ 75 (le ruego que publique sus informes en los comentarios) Recomendaciones
MultiFiboDynamicMT4 is a powerful, professional indicator for estimating the most important support and resistance levels. The main advantage is that it plots the Fibonacci levels at all timeframes simultaneously, which allows the trader to see the full picture of the possible price movement of the trading instrument! Advantages of the indicator The indicator is perfect for scalping and trading binary options. Suitable for beginners and experienced traders. Works on all timeframes. Works on any
FREE
Stratos Pali
Michela Russo
5 (3)
Stratos Pali Indicator   is a revolutionary tool designed to enhance your trading strategy by accurately identifying market trends. This sophisticated indicator uses a unique algorithm to generate a complete histogram, which records when the trend is Long or Short. When a trend reversal occurs, an arrow appears, indicating the new direction of the trend. Important Information Revealed Leave a review and contact me via mql5 message to receive My Top 5 set files for Stratos Pali at no cost! Dow
GMMA Trade X is an EA based on GMMA. GMMA parameters such as MovingAveragePeriod1-24, MovingAverageMAShift1-24, MovingAverageShift1-24 and CandlestickShift1-24 can be adjusted. GMMA Trade X applies BTN TECHNOLOGY's state-of-the-art intelligent technology to help you create optimal results for your trades. May your dreams come true through GMMA Trade X. Good luck. = == == Inquiries = == == E-Mail:support@btntechfx.com
Voenix
Lorentzos Roussos
4.58 (12)
Patrones armónicos , escáner y comerciante  Patrones incluidos: patrón ABCD patrón garley patrón de murciélago patrón de cifrado 3Patrón de unidades patrón de cisne negro Patrón de cisne blanco Patrón Quasimodo o patrón Over Under Patrón de murciélago alternativo patrón de mariposa Patrón de cangrejo profundo patrón de cangrejo patrón de tiburón Patrón FiveO patrón de cabeza y hombros patrón de triángulo ascendente Patrón uno dos tres Y 8 patrones personalizados Voenix es un escáner de patrones
PZ 123 Pattern
PZ TRADING SLU
1 (1)
El patrón 123 es uno de los patrones de gráficos más populares, potentes y flexibles. El patrón se compone de tres puntos de precio: un fondo, un pico o valle, y un retroceso de Fibonacci entre 38.2% y 71.8%. Un patrón se considera válido cuando el precio se rompe más allá del último pico o valle, momento en el que el indicador traza una flecha, levanta una alerta y se puede colocar el comercio. [ Guía de instalación | Guía de actualización | Solución de problemas | FAQ | Todos los productos ]
Fibonacci retracements can be used to draw support lines, identify resistance levels, place stop-loss orders and set target prices. The Advanced Automatic Fibonacci retracements draws automatically all the levels. You have a lot of options to choose. For exemple you can use the tracements of another time frame (MTF) in the current chart, you can also choose between the closest level or less close to draw the retracements. You can also add 2 levels of your choice. You can add levels extensions o
TRADING STRATEGY GUIDE DELIVERY The full Trading Strategy Guide will be sent directly to you after purchase. Just message me on MQL5 and ask for it — you'll receive it instantly, along with priority support and setup help. Powered Market Scanner for Smart Trading Decisions Keypad Support & Resistance is a next-generation MT4 trading system built for serious traders who demand precision, reliability, and clarity. It combines advanced smart filters with real-time price structure logic to genera
Gold Crazy EA   is an Expert Advisor designed specifically for trading Gold H1/ EU M15. It use some indicators to find the good Entry. And you can set SL or you can DCA if you want. It can be an Scalping or an Grid/ Martingale depend yours setting. This EA can Auto lot by Balance, set risk per trade. You also can set TP/ SL for earch trade or for basket of trade. - RSI_PERIOD - if = -1, then the default strategy works, if >0, then the RSI strategy works - MAX_ORDERS - to trade with only 1 order,
El Capturador de Tendencias: La Estrategia del Capturador de Tendencias con Indicador de Alerta es una herramienta versátil de análisis técnico que ayuda a los traders a identificar las tendencias del mercado y los posibles puntos de entrada y salida. Presenta una Estrategia dinámica del Capturador de Tendencias, adaptándose a las condiciones del mercado para una clara representación visual de la dirección de la tendencia. Los traders pueden personalizar los parámetros para que se ajusten a su
FREE
Exit EDGE EA
Nguyen Tran Ha
3 (1)
Exit EDGE EA  is developed base on the PipFinite   Exit EDGE   Indicator, one of the best indicator on the market so far.  This EA open buy/sell orders when the indicator has Exit Sell/Buy Strong signals. You can read more information about PipFinite   Reversal PRO  indicator  here . Important Information   This EA will only work if you purchased  PipFinte Exit EDGE  indicator. To use or test EA must set the   "Use Exit EDGE   Indicator    "   parameter to   TRUE . It works with all symbols. T
EA123 Snipper MACD
Jose Francisco Flores Rojas
MACD Divergence Pro es un robot de trading inteligente y adaptable, diseñado para aprovechar las señales del indicador MACD y detectar patrones de divergencia que comúnmente preceden a reversiones importantes del mercado. El EA coloca operaciones automáticamente cuando: Se detecta divergencia bajista en niveles altos del mercado Se detecta divergencia alcista en niveles bajos del mercado Las señales de cruce MACD confirman puntos de entrada potenciales Características Clave: Trading c
Trendlines Chart Patterns Indicator (MT4) Automated Chart Patterns & Breakout Signals for MT4: Trade with Precision! The "Trendlines Chart Patterns Indicator" is an advanced trading tool for MetaTrader 4 (MT4) , meticulously designed to identify high-probability buy and sell signals based on dynamically forming, robust trend lines and popular chart patterns . This powerful forex indicator automates the complex process of identifying patterns like triangles, flags, ranges, ascending/descending tr
Diamond Trend
Segundo Calvo Munoz
Indicador que identifica la tendencia, así como puntos de entrada. Usar para entradas a favor de tendencia. Aunque este indicador es muy preciso identificando entradas, siempre se recomienda usar otro indicador de soporte para confirmar. Recuerda buscar los Activos y Timeframes que mejor se adapten a tu operativa... Válido tanto para Scalping como para entradas de Largo Plazo Por favor, utiliza un Gráfico de Barras para poder visualizar el indicador correctamente Inputs: EMA Value for Long Term
Goldenclaw EA   is a unique scalping Trading Robot based on multi layered neural network and various default indicators. The algorithm works by calculating values from different timeframes to provide output signal for the current timeframe. This EA does not use dangerous techniques like martingale, averaging, grid or hedging. All orders are protected by stop loss and only one trade direction buy or sell depend on given algorithm. Input Parameters: Expert Name   - EA name and trades comment. M
Introducing to your attention an innovative expert advisor created specifically for the most juicy and volatility    currency     basket: GBPUSD and XAUUSD. This EA is designed using the main features of this market's movement, making it an ideal choice for dynamic trading on high-trending and medium-volatile pairs. The advisor is focused on minimizing trading risks, aiming to reduce losses to a minimum. Main features: EA is designed to open and close orders at the begginning of trading session
The Grid Inside works on a counter trend mode, automatically opens a new order when it hits the price target due to the Fibonacci levels at 23.6 and 73.6. If the price goes the wrong way it opens another order with a calculated lot and position. All the positions are closed when it reaches the target profit defined on settings. As TGI does not use stop loss, I don't recommend you put on your account more than you can afford to lose, the higher the timeframe safer it gets. Once an order is trigge
Gold Titan King Scalper
Dodong Christian Arnon
Indicator Description GOLD TITAN KING SIGNAL INDICATOR High-Precision Gold Scalping Buy/Sell Signals – Manual Trading Assistant Overview The Gold Titan King Signal Indicator is a manual trading assistant tool designed for high-frequency scalping on Gold (XAUUSD) and other major pairs. It generates clear BUY/SELL signals with precise entry levels, along with adjustable Stop Loss and Take Profit levels displayed directly on the chart. ️ This tool is NOT an EA. It does not execute trades
DMS Fibo
Diogo Mitsunaga Dos Santos
Fibonacci retracements are trend lines drawn between two significant points, usually between absolute lows and absolute highs, plotted on a chart. Intersecting horizontal lines are placed at the Fibonacci levels. Fibonacci retracements are useful tools that help traders identify support and resistance levels. With the information gathered, they can place orders, identify stop-loss levels, and set price targets. Although useful, traders often use other indicators to make more accurate assessments
The Icarus Auto Dynamic Support and Resistance  Indicator provides a highly advanced, simple to use tool for identifying high-probability areas of price-action automatically - without any manual input whatsoever. .  All traders and investors understand the importance of marking horizontal levels on their charts, identifying areas of supply and demand, or support and resistance. It is time-consuming and cumbersome to manually update all instruments, across all timeframes, and it requires regular
Koala Fibo Base Time
Ashkan Hazegh Nikrou
3 (1)
Bienvenido a Koala Fibo Base Time     Bienvenido a Koala Fibo Time Zone     Bienvenido a Koala Fibo Time Extention     ¡Bienvenido a Missed Tool For Meta Trade! Introducción simple: Las zonas horarias de Fibonacci son líneas verticales basadas en la secuencia de Fibonacci. Estas líneas se extienden a lo largo del eje X (eje de la fecha) como un mecanismo para pronosticar reversiones basadas en el tiempo transcurrido. A menudo, se elige un mínimo o un máximo importante como punto de partida. L
FREE
Versión MT4: https://www.mql5.com/en/market/product/90395 Versión MT5: https://www.mql5.com/en/market/product/99545 Presentamos el Asesor Experto (EA) "No Marti No Party": el epítome de las estrategias comerciales agresivas. Este EA no es para los pusilánimes, ya que opera según un principio de alto riesgo y alta recompensa que puede generar ganancias sustanciales o pérdidas significativas. El nombre lo dice todo: la estrategia Martingala es el núcleo de este EA. Está diseñado para duplicar a
Gyroscope        professional forex expert   (for EURUSD, GBPUSD, USDJPY, AUDUSD, USDCHF, EURGBP, EURJPY, NZDUSD, USDCAD, EURCHF, AUDJPY, CADJPY pairs)   alyzing the market using the Elliot Wave Index. Elliott wave theory is the interpretation of processes in financial markets through a system of visual models (waves) on price charts. The author of the theory, Ralph Elliott, identified eight variants of alternating waves (of which five are in the trend and three are against the trend). The mov
We present to you a fully automated Expert Advisor designed for trading major currency pairs. The bot uses a set of its own trading algorithms and has protection against crashes. Attention! The bot only works correctly when the spread is less than 6 pips! I ask you to weigh this fact, and if you do not have the appropriate conditions for trading, this bot will not work for you! The robot controls the volume of trading positions, slippage, spread, maintains and protects open orders, can work wit
Zone Crack Alpha
Camila Bernardez Camero
ZONE CRACK ALPHA — DETECCIÓN ESTRATÉGICA DE CAMBIOS DE FASE DEL MERCADO Zone Crack Alpha ha sido desarrollado para identificar transiciones estructurales en el comportamiento del precio mediante un sistema lógico de doble capa. Aprovecha cambios de polaridad en el histograma y señales visuales direccionales para detectar momentos clave de posible ruptura, sin depender de indicadores rezagados ni fórmulas tradicionales. Lógica de Señales La metodología se basa en un cruce del histograma sobre
Monkey EA
Vojtech Svobodnik
Monkey EA is fully automatic Expert Advisor for trading on GBPUSD . It based on Exponential Moving Average and Bollinger Bands. Monkey EA has been tested from year 2003 to March 2021 . You can download the demo and test it yourself. My test used the real tick data with 99,90% accuracy. I made Monte Carlo test with 200 simulations used too. Monkey EA offers hight profit factor  and small drawndown . All trades are covers by TakeProfit  and StopLoss ! Doesn't use Martingale or other dangerous star
KP Grid
Ruben Fernandez Souto
KP Grid  is a robust Expert Advisor specifically designed for grid-based strategies in trending or ranging markets. It intelligently opens and manages buy/sell grids using customizable distance, volume scaling, and profit/loss management logic. With built-in trailing options and optional RSI-based signal filtering, KP Grid adapts to various market scenarios while offering strong control over drawdowns. This EA is suitable for experienced traders who understand the dynamics of grid systems and w
Los compradores de este producto también adquieren
BinaryUniversal
Andrey Spiridonov
BinaryUniversal - indicador de señal para opciones binarias y forex. En su trabajo, el indicador utiliza un complejo algoritmo de generación de señales. Antes de formar una señal, el indicador analiza la volatilidad, los patrones de velas, el soporte importante y los niveles de resistencia. El indicador tiene la capacidad de ajustar la precisión de las señales, lo que hace posible aplicar este indicador tanto para el comercio agresivo como para el conservador. El indicador se configura de la fo
Indicador EasyWayTradePanel para MetaTrader4 , son asistentes comerciales para el comercio manual en cualquier moneda en  F OREX,  CRYPTOCURRENCY como   Bitcoin,  Ethereum,  Lightcoin,   Ripple y más. También es fácil de usar para COMODIDAD como   Oro,  Plata, Petróleo,  Gas ... y  CFDs. Cuando se instala en el gráfico en el marco de tiempo elegido y la herramienta comercial, el indicador dibuja automáticamente los siguientes indicadores personalizados utilizados en la estrategia comercial Easy
Pairs Trading Dashboard - Spearman Correlation and Stationary Z-Score  is a custom indicator designed for the MetaTrader 4 (MT4) platform, developed to assist traders in analyzing and monitoring currency pairs for pairs trading strategies. It utilizes Spearman’s rank correlation coefficient and Z-Score calculations to identify trading signals across multiple timeframes and currency pairs. The indicator integrates various technical filters and stationarity tests to refine signal generation and di
Predictive Levels
Satya Prakash Mishra
Market predictive price levels are key technical analysis tools is my finest invention through mathematics to predict automatically next price is where to reach after break any levels. A unique name quality it automatically calculate price range its my own invention according price value to predict what's is next price came than after it not fixed levels like Fibonacci or pivots Its Naveen's Predictive Levels .used to forecast where an asset's price might find support (stop falling) or resistanc
BinaryIndicator
Andrey Spiridonov
BinaryIndicator is a highly accurate indicator for trading binary options. It shows excellent results in scalping. This indicator is based in multifactor analysis of trend indicators, as well as confirmation oscillators, which in the end gives an increased accuracy of signals. Advantages of the indicator Increased accuracy of signals. Excellent results when trading binary options with a short expiration time from M30 to M1 . It works on any timeframes. Works with any trade symbols. Parameters
WanaScalper MT4
Isaac Wanasolo
1 (1)
A scalping indicator based on mathematical patterns, which on average gives signals with relatively small SL, and also occasionally helps to catch big moves in the markets (more information in the video) This indicator has three main types of notifications: The first type warns of a possible/upcoming signal on the next bar The second type indicates the presence of a ready signal to enter the market/open a position The third type is for SL and TP levels - you will be notified every time price re
FFx Engulfing Setup Alerter gives trade suggestions with Entry, Target 1, Target 2 and StopLoss. Below are the different options available: Entry suggestion - pips to be added over the break for the entry 3 different options to calculate the SL - by pips, by ATR multiplier or at the pattern High/Low 3 different options to calculate the 2 TPs - by pips, by ATR multiplier or at Risk/Reward Offset the dashboard - any place on the chart Remove the suggestion once the price reached the SL line Lines
FFx InsideBar Setup Alerter gives trade suggestions with Entry, Target 1, Target 2 and StopLoss. Below are the different options available: Entry suggestion - pips to be added over the break for the entry Minimum candle size - to avoid too close buy/sell entry suggestions 3 different options to calculate the SL - by pips, by ATR multiplier or at the pattern High/Low 3 different options to calculate the 2 TPs - by pips, by ATR multiplier or at Risk/Reward Offset the dashboard - any place on the c
FFx OutsideBar Setup Alerter gives trade suggestions with Entry, Target 1, Target 2 and StopLoss. Below are the different options available: Entry suggestion - pips to be added over the break for the entry. 3 different options to calculate the SL - by pips, by ATR multiplier or at the pattern High/Low. 3 different options to calculate the 2 TPs - by pips, by ATR multiplier or at Risk/Reward. Offset the dashboard - any place on the chart. Remove the suggestion once the price reached the SL line.
FFx PinBar Setup Alerter gives trade suggestions with Entry, Target 1, Target 2 and StopLoss. Below are the different options available: Entry suggestion - pips to be added over the break for the entry Minimum candle size - to avoid too small candles 3 different options to calculate the SL - by pips, by ATR multiplier or at the pattern High/Low 3 different options to calculate the 2 TPs - by pips, by ATR multiplier or at Risk/Reward Offset the dashboard - any place on the chart Remove the sugges
The purpose of this new version of the MT4 standard indicator provided in your platform is to display in a sub-window multiple timeframes of the same indicator with its divergences. See the example shown in the picture below. But the display isn't like a simple MTF indicator. This is the real display of the indicator on its timeframe. Here's the options available in the FFx divergences indicator: Select the timeframes to be displayed (M1 to Monthly) Define the width (number of bars) for each tim
The purpose of this new version of the MT4 standard indicator provided in your platform is to display in a sub-window multiple timeframes of the same indicator with its divergences. See the example shown in the picture below. But the display isn't like a simple MTF indicator. This is the real display of the indicator on its timeframe. Here's the options available in the FFx divergences indicator: Select the timeframes to be displayed (M1 to Monthly). Define the width (number of bars) for each ti
The FFx Dashboard MTF alerter will show you on a single chart all the timeframes (M1 to Monthly) with their own status for the indicator. 2 Alert Options: Single timeframe: each selected timeframe alert separately when a signal occurs Multi timeframes: all selected timeframes must agree for an alert to be triggered Both options have an input to select the timeframes to be used for the alert(s). How to Understand the Status: Green/Red square: histogram above/below 0 line Green square + Red bord
The FFx Dashboard MTF alerter will show you on a single chart all the timeframes (M1 to Monthly) with their own status for the indicator. 2 Alert Options: Single timeframe: each selected timeframe alert separately when a signal occurs Multi timeframes: all selected timeframes must agree for an alert to be triggered Both options have an input to select the timeframes to be used for the alert(s). How to understand the status: Green/Red square: RSI above/below 50 line Green square + Red border: R
The FFx Dashboard MTF alerter will show you on a single chart all the timeframes (M1 to Monthly) with their own status for the indicator. 2 Alert Options: Single timeframe: each selected timeframe alert separately when a signal occurs Multi timeframes: all selected timeframes must agree for an alert to be triggered Both options have an input to select the timeframes to be used for the alert(s). How to understand the status: Green/Red square: Stoch above/below 50 line Green square + Red border:
The FFx Dashboard MTF alerter will show you on a single chart all the timeframes (M1 to Monthly) with their own status for the indicator. 2 Alert Options: Single timeframe: each selected timeframe alert separately when a signal occurs Multi timeframes: all selected timeframes must agree for an alert to be triggered Both options have an input to select the timeframes to be used for the alert(s). How to understand the status: Green/Red square: Price above/below Cloud (Kumo) Green square + Red bo
The FFx Dashboard MTF alerter will show you on a single chart all the timeframes (M1 to Monthly) with their own status for the indicator. 2 Alert Options: Single timeframe: each selected timeframe alert separately when a signal occurs Multi timeframes: all selected timeframes must agree for an alert to be triggered Both options have an input to select the timeframes to be used for the alert(s). How to understand the status: Green/Red square: MA pointing Up/Down Green square + Red border: MA po
The FFx Dashboard MTF alerter will show you on a single chart all the timeframes (M1 to Monthly) with their own status for the indicator. 2 Alert Options: Single timeframe: each selected timeframe alert separately when a signal occurs. Multi timeframes: all selected timeframes must agree for an alert to be triggered. Both options have an input to select the timeframes to be used for the alert(s). How to understand the status: Green square: Price above PSAR Red square: Price below PSAR Options
The FFx Dashboard MTF alerter will show you on a single chart all the timeframes (M1 to Monthly) with their own status for the indicator. 2 Alert Options: Single timeframe: each selected timeframe alert separately when a signal occurs Multi timeframes: all selected timeframes must agree for an alert to be triggered Both options have an input to select the timeframes to be used for the alert(s). How to understand the status: Green/Red square: CCI above/below levels (ie. 100/-100) Grey square: C
The FFx Dashboard MTF alerter will show you on a single chart all the timeframes (M1 to Monthly) with their own status for the indicator. 2 Alert Options: Single timeframe: each selected timeframe alert separately when a signal occurs Multi timeframes: all selected timeframes must agree for an alert to be triggered Both options have an input to select the timeframes to be used for the alert(s). How to understand the status: Green/Red square: ADX above level Grey square: ADX below level Red bor
The FFx Dashboard MTF alerter will show you on a single chart all the timeframes (M1 to Monthly) with their own status. 2 Alert Options: Single timeframe: each selected timeframe alert separately when a signal occurs Multi timeframes: all selected timeframes must agree for an alert to be triggered Both options have an input to select the timeframes to be used for the alert(s). How to understand the status: Green/Red square: bullish/bearish candle Options available in the FFx Dashboard Alerter
The indicator of a Professional Trader is an arrow indicator for predicting the direction of price movement. I have been working on this indicator since 2014. You can use this indicator as your main indicator, use its entry signals, and use it as your only indicator to find entry points. About the product: Recommended TF [H4-D1-W1]   . The indicator predicts the direction of the next candle. Fits a variety of tools; Flexibility in settings for different instruments and intervals through the MO
The [GRAFF] III manual trading system is based on multiple MetaTrader (MT4) indicators. Together, the entire PACK of GRAFF III indicators makes an advanced trading tool. The system consists of over 20 different custom-built indicators which have been carefully selected and tested in the long term to produce strong and efficient trading signals. The particular indicators are based on different mathematical formulas, so the entire system is calibrated to remove false signals from its own indicator
FFx Universal Strength Meter PRO is more than a basic strength meter. Instead of limiting the calculation to price, it can be based on any of the 19 integrated strength modes + 9 timeframes. With the FFx USM, you are able to define any period for any combination of timeframes. For example, you can set the dashboard for the last 10 candles for M15-H1-H4… Full flexibility! Very easy to interpret... It gives a great idea about which currency is weak and which is strong, so you can find the best pai
Smooth price for Monarch MT4
Konstantin Gruzdev
3.67 (3)
The Smooth Price technical indicator is used for plotting a smoothed line as close to the price of the financial instrument as possible, and serves to eliminate its noise components. The indicator is part of the Monarch trading system, but here it is presented as an independent technical analysis tool. The indicator is based on the cluster digital filter , which, unlike the ClusterSMA , is applied directly to the price time series. Smooth Price does not redraw (except the very last, zero bar) an
Pan PrizMA CD Phase is an analogue of the МetaТrader 5 indicator , and is an option based on the Pan PrizMA indicator. Details . Averaging by a quadric-quartic polynomial increases the smoothness of lines, adds momentum and rhythm. Extrapolation by the sinusoid function near a constant allows adjusting the delay or lead of signals. The value of the phase - wave status parameter (which is close in meaning to the trigonometric phase or the angle of the radius-vector rotation in the trigonometric p
Green Wall Arrows
Daniel Luchinger
1 (1)
El Nombre Green_Wall_Arrows : Usando un Tp pequeño y mucho free margin, nos da la oportunidad de generar una muralla verde de profits que van saliendo, a medida que vamos tomando TP. Sin necesidad de usar SL para equilibrar los Tp pequeños de salida. Esta estrategia es una forma de operar los mercados, creada por mi y el indicador tan solo una herramienta mas. Puede ser Usado en Binarios. Este indicador Funciona en Barras Abiertas, Las flechas desaparecen si el mercado en contra de las flechas.
Otros productos de este autor
Custom Indictor Signal Scanner para escanear su propia cualquier indicador personalizado y la plantilla de un solo clic se puede abrir sus señales deseo (alerta marco de tiempo dado). También puede abrir la misma plantilla con el indicador de entrada en particular sólo escriba el nombre de la plantilla de su creado con el indicador dado y disfrutar de todos los marcos de tiempo de exploración con sus señales lógicas cadena de entrada s2 = "====== Embedded Indicator Settings ======"; input UseEmb
Core Principles Swing Angle Measurement   Swing angles are calculated by measuring the degree of price movement between swing highs and lows over time. Steeper angles (typically 45+ degrees) indicate stronger momentum and potentially more profitable trading opportunities. Traders use various timeframes to identify these patterns, from intraday charts to weekly swings. Momentum Confirmation   High degree swing angles often coincide with strong momentum indicators like RSI breakouts, volume spikes
Predictive Levels
Satya Prakash Mishra
Market predictive price levels are key technical analysis tools is my finest invention through mathematics to predict automatically next price is where to reach after break any levels. A unique name quality it automatically calculate price range its my own invention according price value to predict what's is next price came than after it not fixed levels like Fibonacci or pivots Its Naveen's Predictive Levels .used to forecast where an asset's price might find support (stop falling) or resistanc
Principios básicos Medición del ángulo de oscilación Los ángulos de oscilación se calculan midiendo el grado de movimiento del precio entre los máximos y los mínimos de oscilación a lo largo del tiempo. Los ángulos más pronunciados (normalmente de más de 45 grados) indican un impulso más fuerte y oportunidades de negociación potencialmente más rentables. Los operadores utilizan varios marcos temporales para identificar estos patrones, desde gráficos intradía hasta oscilaciones semanales. Confirm
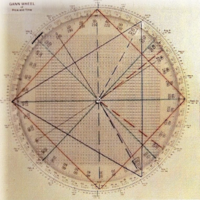
Concepto básico: Los ángulos avanzados de tiempo y precio de Naveen Saroha se trazan a partir de máximos o mínimos significativos en proporciones geométricas específicas que representan la relación entre el movimiento del precio y el tiempo. Los principales ángulos de Gann y el porcentaje conjunto El más importante Ángulo 1x1 : Una unidad de precio por una unidad de tiempo Ángulo 1x2 : Una unidad de precio por dos unidades de tiempo Ángulo 1x3 Ángulo 1x4 Ángulo 1x5 Ángulo 1x6 1x7 Ángulo 1x8
Circle Maker MT5
Satya Prakash Mishra
Su y cajón de círculo para mt4 auto escala puede utilizar múltiples círculos juntos ver mis todos los videos basados en círculo obtener idea cómo utilizar y averiguar las reversiones de los mercados. Es mi concepto central para predecir el tiempo y los niveles de precios utilizando sólo círculos ningún otro indicador necesario para utilizar con los círculos de una estrategia comercial completa. https://youtu.be/VlSIur-LPUs?si=gDtioQyUtXDDw_fi https://youtu.be/-IGp7F9XINQ?si=Q2DB0qKHKQzpl4bv NO
FREE
Circle Maker
Satya Prakash Mishra
Its and Circle drawer for mt4 auto scale can use multiple circles together watch my all videos based on circle get idea how to use and find out reversals of markets. Its my core concept for predict time and price levels using only Circles no other indicator needed to use with circles a complete trading strategy. https://youtu.be/VlSIur-LPUs?si=gDtioQyUtXDDw_fi https://youtu.be/-IGp7F9XINQ?si=Q2DB0qKHKQzpl4bv
FREE
The Naveen Dynamic Square is one of the best known  technical analysis tools  inspired  by WD Gann along with the Gann Fan and Gann Box. It is considered a cornerstone of his trading technique that is based on time and price symmetry. The Naveen Dynamic Square is a powerful tool in finance for determining support and resistance levels based on a stock's extreme price points. It works by extrapolating probable price levels from a central value, typically an all-time or cyclical high or low. This
Advance GannAngles
Satya Prakash Mishra
Core Concept: Naveen Saroha's Advanced time and price angles are drawn from significant highs or lows at specific geometric ratios that represent the relationship between price movement and time. The Main Gann Angles: Most Important: 1x1 Angle : One units of price for one unit of time  1x2 Angle : One unit of price for two units of time  1x3 Angle 1x4 Angle 1x5 Angle 1x6 Angle 1x7 Angle 1x8 Angle: (45) : Eight unit of price for one unit of time - considered the most important trend line Co
Advance Gann Grid and Percentage tool is world's first auto scale dynamic grid  created by Naveen Saroha will new unknown features Key Features of Modern Dynamic Gann Grid Real-time Updates : Unlike traditional static grids, dynamic versions automatically adjust as new price data comes in Multiple Timeframe Analysis : Simultaneous calculation across different timeframes Automated Scaling : Software automatically determines optimal price-to-time ratios Interactive Elements : indicator is create 1
High Gravity Reversal signals made by Naveen Saroha a completely new concept using physics universal law of speed and Gravity. Made a simple signals using complex mathematics to match trading concepts. High accurate sell signals and buy potential of reversal of market one of unique invented by core universal laws. We are working on gravity signals since 2019 consistently...high probability reversals with minimal stop losses. 100% Non repainted no legging tools for mt4/mt5 also can use in binary
Gann time and price reversal signals are sophisticated trading concepts developed by Naveen Saroha using  W.D. Gann concepts that focus on predicting market turning points through the confluence of time cycles and price movements. Here are the key elements: Time-Price Balance : Gann famously stated, "When time is up, the market will reverse regardless of the price. This emphasizes that time cycles often take precedence over price levels in determining market reversals. Key Reversal Signals Price
Gann Time Reversal Signals   are sophisticated trading concepts developed by Naveen Saroha using  W.D. Gann concepts that focus on predicting market turning points through the confluence of time cycles and price movements. Here are the key elements: Time-Balance : Gann famously stated, "When time is up, the market will reverse regardless of the price. This emphasizes that time cycles often take precedence over price levels in determining market reversals. Key Reversal Signals Price-Time Confluen
New idea for market turning forecasts and Swing High degree angle by Geometric and Gann methods. Developed by Naveen Saroha in 2019. to find time and angular forecaster for market direction to reversal/swing. Tool shows time vertical line on chart. Using geometric and mathematical equation to define next turning probability of market  Market swing turning points Technical analysis forecasting Trend reversal predictions
Dynamic Andrew's Pitchfork A technical analysis tool that uses three parallel trendlines to identify potential support and resistance levels. Created by selecting three significant pivot points (two lows and one high, or two highs and one low), then drawing: Median Line : The central line connecting the first point to the midpoint between the second and third points Upper Parallel : A line parallel to the median line, passing through the highest of the second two points Lower Parallel : A line p
Mac-Binary option Signals is unique mathematical concept to trade iqoptions,binary,rocketoptions specter or any other binary options company 1 min 5 expiry run robot 30min everyday and fill profit and loss ratios inside mt2iq/mt2binary and run or 1min to 5min expiry ...go to setting in mt2iq robot allow otc and digital options. and select risk 500and profit 300$ per day it can stop automatically after profit or loss... If it can close after loss restart and Reset profit and loss button run again
Dynamic Gann Box MT4
Satya Prakash Mishra
What is a Dynamic Gann Box? The Dynamic Gann Box, Designed by Mr Naveen Saroha its and  World first in class. World's First auto scale  mt4/mt5 Geometric tools... no matter screen sizes and resolutions its automatically check chart scale with different time and different trading assets like commodities and stocks futures and options.... also known as the Gann Square, is a more complex tool that combines price and time in a squared framework based on W.D. Gann's belief that market movements are
The Naveen Dynamic Square  MT4 Lite. is one of the best known  technical analysis tools  inspired  by WD Gann along with the Gann Fan and Gann Box. It is considered a cornerstone of his trading technique that is based on time and price symmetry. The Naveen Dynamic Square MT5   is a powerful tool in finance for determining support and resistance levels based on a stock's extreme price points. It works by extrapolating probable price levels from a central value, typically an all-time or cyclical h
High Low Reversal
Satya Prakash Mishra
High low Reversal concept by Naveen saroha to find out new tops and new bottoms through mathematical calculations also can get with own calculation inputs available to increase or decrease swing potential,also can use  auto analysis function to calculate  Parameters swing heights and swing percentages. Indicator can apply all time frame and all types of market symbols..... """High-Low Market Signals Overview High-low market signals are technical indicators that analyze the relationship between r
Custom Indictor Signal Scanner for scan your own any custom indicator and template its one click you can open your desire signals(given time frame alert). Also can open same template with particular input indicator just type name of template your created with given indicator and enjoy all time frame scan with your logical signals  What is a Custom Indicator Scanner for MT4? A custom indicator scanner is an Indicator  or script that automatically scans multiple currency pairs and timeframes for
Day High Low Scanner
Satya Prakash Mishra
A day high low scanner is a stock screening tool that helps traders and investors identify stocks based on their daily price movements, specifically focusing on stocks that are hitting new highs or lows within a trading day. Here's how it typically works: Day High Scanner: Identifies stocks that are trading at or near their highest price of the current trading day Shows stocks with strong upward momentum Helps traders spot potential breakout opportunities or stocks with bullish sentiment Day Low
Core Concept: Naveen Saroha's Advanced time and price angles included percentages to find out right time and price equations   are drawn from significant highs or lows at specific geometric ratios that represent the relationship between price movement and time. The Main Gann Angles and Percentage together Most Important: 1x1 Angle : One units of price for one unit of time  1x2 Angle : One unit of price for two units of time  1x3 Angle 1x4 Angle 1x5 Angle 1x6 Angle 1x7 Angle 1x8 Angle: (45)
Multipair Range Percentage Levels Scanner - Technical Description Overview A Fibonacci levels scanner is a technical analysis tool that automatically identifies and plots key Fibonacci retracement and extension levels across multiple financial instruments or timeframes. It helps traders quickly locate potential support and resistance zones based on mathematical relationships derived from the Fibonacci sequence. Core Functionality Automatic Level Detection The scanner identifies significant pric
WD Gann Swing Trading & Market Calculation Mathematics: Decoding the Master's Geometric Approach to Market Prediction Introduction William Delbert Gann (1878-1955) stands as one of the most enigmatic and successful traders in financial history, developing a sophisticated mathematical framework that combined geometry, astronomy, and natural law to predict market movements. His theory was based upon natural geometric shapes and ancient mathematics. Gann theory states that the patterns and angles o
El Naveen Dynamic Square MT5 es una de las herramientas de análisis técnico más conocidas inspirada por WD Gann junto con el Gann Fan y el Gann Box. Se considera una piedra angular de su técnica de trading que se basa en la simetría del tiempo y el precio. El Cuadrado Dinámico Naveen MT5 es una poderosa herramienta en finanzas para determinar niveles de soporte y resistencia basados en los puntos extremos de precio de una acción. Funciona extrapolando probables niveles de precios a partir de un
Advance Gann Grid and Percentage tool es la primera rejilla dinámica de escala automática del mundo creada por Naveen Saroha con nuevas características desconocidas. Características principales de Modern Dynamic Gann Grid Actualizaciones en tiempo real : A diferencia de las rejillas estáticas tradicionales, las versiones dinámicas se ajustan automáticamente a medida que llegan nuevos datos de precios Análisis de múltiples marcos temporales : Cálculo simultáneo en diferentes marcos temporales Esc
Señales de reversión de alta gravedad hechas por Naveen Saroha un concepto completamente nuevo utilizando la ley universal de la física de la velocidad y la gravedad. Hecho un simple señales utilizando las matemáticas complejas para que coincida con los conceptos comerciales. Señales de venta de alta precisión y potencial de compra de reversión del mercado uno de los únicos inventados por las leyes universales básicas. Estamos trabajando en señales de gravedad desde 2019 consistentemente...rever
Nueva idea para las previsiones de giro del mercado y Swing ángulo de alto grado por métodos geométricos y Gann. Desarrollado por Naveen Saroha en 2019. para encontrar el tiempo y el pronosticador angular para la dirección del mercado a la inversión / swing. Herramienta muestra línea vertical de tiempo en el gráfico. Usando la ecuación geométrica y matemática para definir la próxima probabilidad de giro del mercado Puntos de inflexión de la oscilación del mercado Predicción de análisis técnico P
Estrategia de negociación de triángulo equilátero , que es un patrón de análisis técnico utilizado en los mercados financieros. Para encontrar la inversión del mercado ver mi análisis vides basado en tringles sólo una herramienta completa para el comercio. Un triángulo equilátero es un triángulo que tiene tres lados iguales. Es un caso especial de un triángulo isósceles en la definición moderna, afirmando que un triángulo isósceles se define al menos por tener dos lados iguales. [ 1 ] Basándose
Mac-Binario opción Signals es único concepto matemático para el comercio iqoptions, binario, rocketoptions espectro o cualquier otra empresa de opciones binarias 1 min 5 expiración ejecutar robot 30min todos los días y llenar las relaciones de pérdidas y ganancias dentro de mt2iq / mt2binary y ejecutar o 1min a 5min expiración ... ir a la configuración en el robot mt2iq permitir otc y opciones digitales. y seleccione el riesgo 500and beneficio 300 $ por día se puede detener automáticamente despu
Filtro:
No hay comentarios
Respuesta al comentario