• Information
8+ years
experience
34
products
46
demo versions
36
jobs
0
signals
0
subscribers
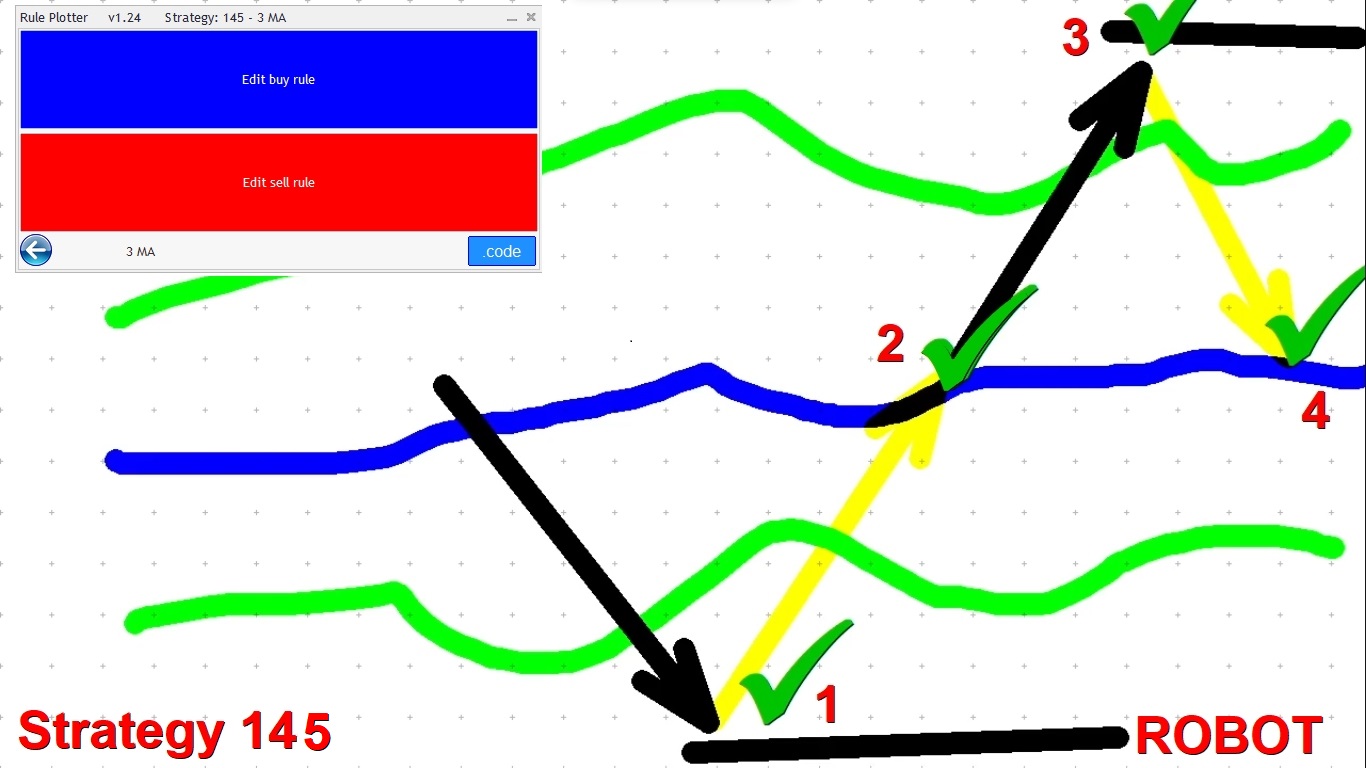
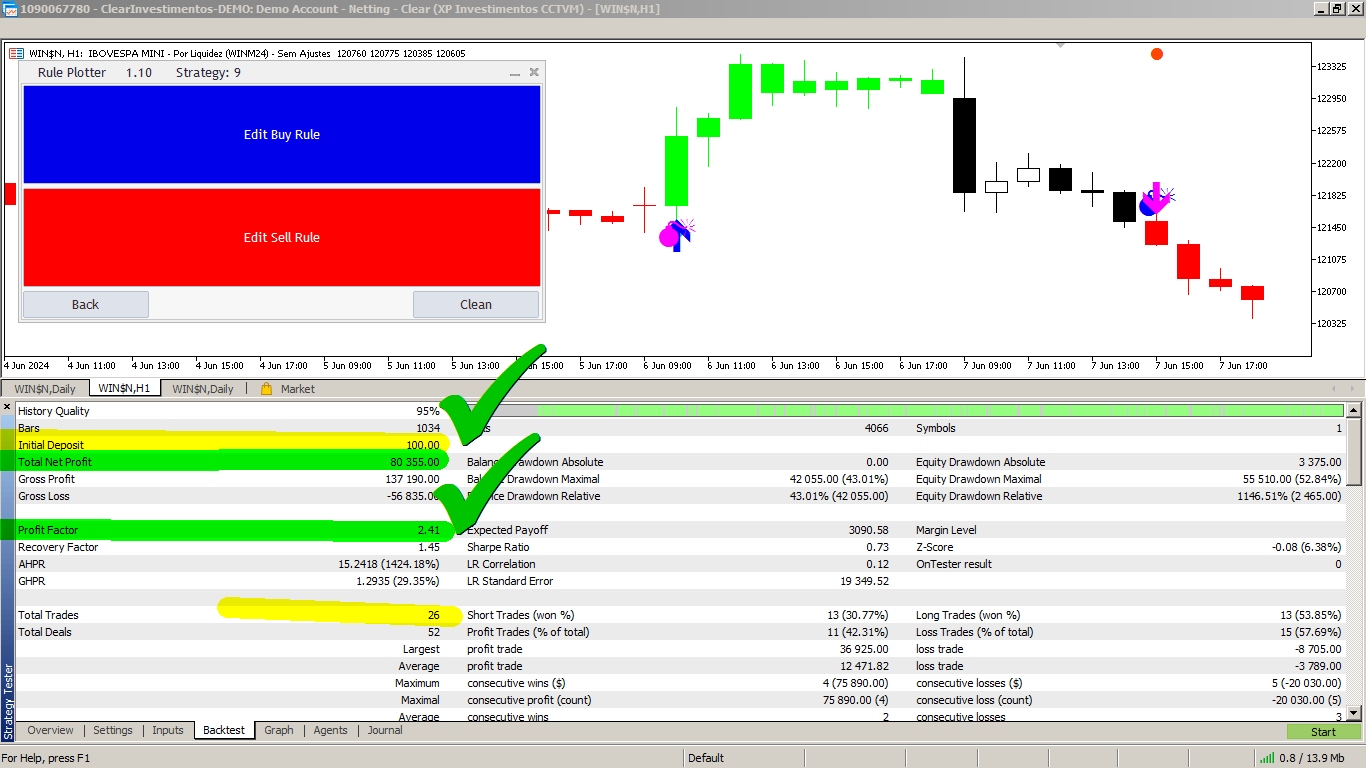
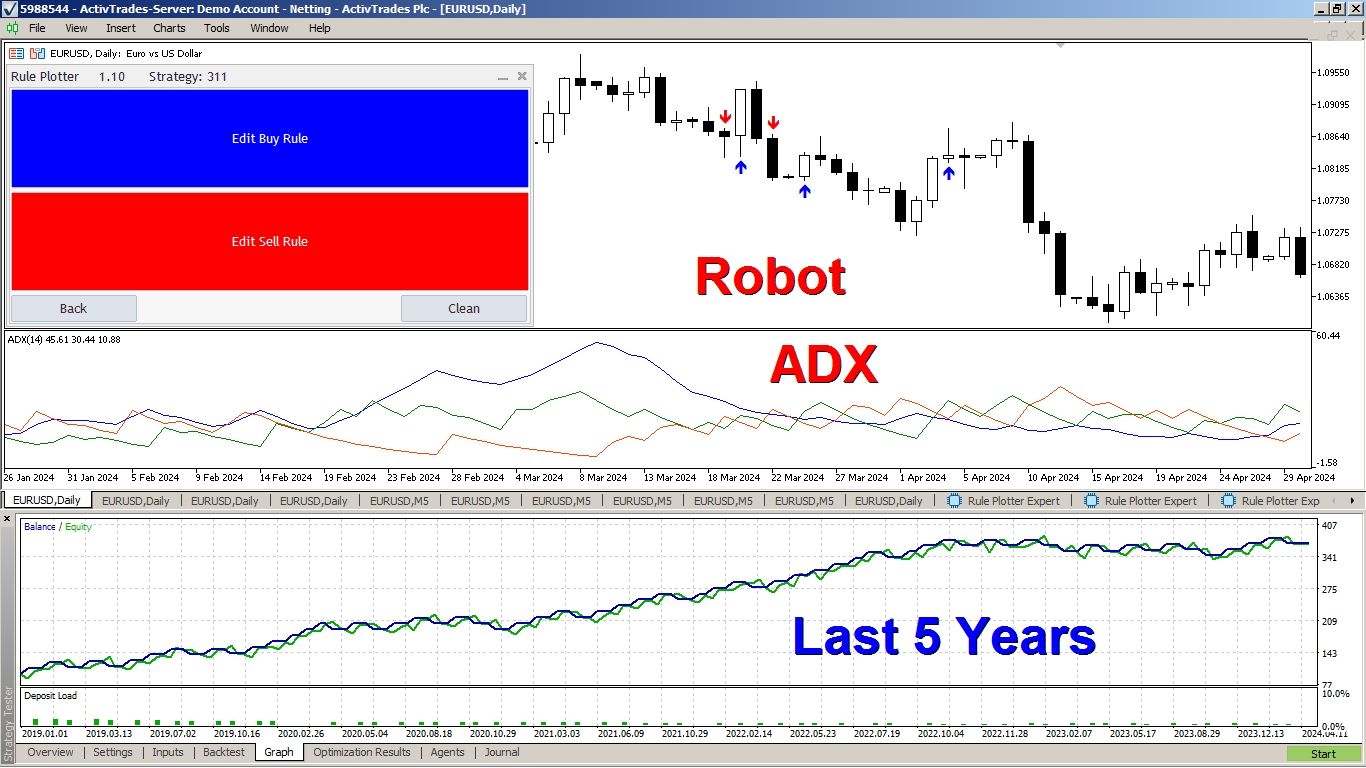
Welcome to my profile, I am a developer of systems and currently I am working only with the language of the metatrade, but I have as goal to create script for tradingview too
Francisco Gomes Da Silva Published product

Scanner for the Agulhadas Strategy This scanner was developed to automate the identification of signals from one of the most popular strategies among Brazilian traders — informally known as “Agulhadas.” The technique uses five main indicators with clear visual rules to identify potential entry and exit points on the chart. With the scanner, you save time and avoid the manual work of finding these opportunities. Download this Scanner Indicator for free here How the Scanner Works The scanner

Francisco Gomes Da Silva Published product

Discover the "Agulhadas" Strategy Inspired by popular concepts in the Brazilian market, this strategy combines five technical indicators to identify potential entry and exit points based on trends, market strength, and momentum. Among the indicators used is the famous Didi Index, developed by Odair Aguiar, widely known for representing moving average crossovers. Download the Stock Scanner Here Indicators Used Didi Index ADX Bollinger Bands Trix Stochastic How This Strategy Works The indicator

Francisco Gomes Da Silva
Published code Custom Fractals
The Standard fractals are 2 candles to the right and 2 candles to the left. With this Custom Fractals you can choose as many candles as you like, both to the left and to the right.
Francisco Gomes Da Silva
Published code RSI Divergence
This indicator takes RSI divergences and plots them in buffers to automate EAs
Francisco Gomes Da Silva Published product
Reviews: 1
FREE

RSI ABCD Pattern Finder: Technical Strategy 1. How the Indicator Works Combines the classic RSI with automatic detection of ABCD harmonic patterns . Key Components Standard RSI (adjustable period) Peak and Trough Markers (arrows) ABCD Patterns (green/red lines) Overbought (70) and Oversold (30) Filters 2. MT5 Setup period = 14 ; // RSI period size = 4 ; // Maximum pattern size OverBought = 70 ; // Overbought level OverSold = 30 ; // Oversold level Filter = USE_FILTER_ YES ; // Confirmation

Francisco Gomes Da Silva
Published code MACD Divergence
MACD Divergence indicator
Francisco Gomes Da Silva
Published code AveragePrice
Indicator for calculating the average price of open positions, you can use the magic number if you want to separate the positions of just one robot, but the zero number is for manual operations.
Francisco Gomes Da Silva
Published code Divergence DeMarker
This indicator picks up the divergence points of the DeMarker indicator
Francisco Gomes Da Silva
Published code False Breakups
The "False Breakouts.mq5" indicator is a tool for MetaTrader 5 that visually identifies and marks buy and sell points based on false breakouts of support and resistance. It uses buffers to display buy (blue) and sell (red) arrows, as well as lines for support (blue) and resistance (red), and additional arrows for market tops and bottoms. The indicator's main logic consists of detecting tops and bottoms based on the high and low prices of the candles, dynamically updating support and resistance levels. When the price breaks through support or resistance and then returns, the indicator generates buy or sell signals respectively. It is a useful tool for traders who operate strategies based on false breakouts.
Francisco Gomes Da Silva
Published code Divergence Awesome Ocilator
This MQL5 custom indicator detects divergences between price action and the Awesome Oscillator (AO), signalling potential market reversals or continuations. It plots buy/sell arrows on the chart, displays the AO as a histogram, and draws trendlines to highlight divergences.
Francisco Gomes Da Silva
Learn how to create a profitable business using Rule Plotter without any programming knowledge


https://youtu.be/N6msT4OPLtw
Francisco Gomes Da Silva
Left feedback to customer for job Supertrend Channel based on LuxAlgo
Francisco Gomes Da Silva

Sweet VWAP Demo

19 June 2024, 03:29
How to Install the Sweet VWAP Demo Version on MetaTrader The Sweet VWAP is an system that helps traders anchor VWAPs to their charts, saving time on manual configuration of MIDAS VWAPs, also known as AVWAPs...
Francisco Gomes Da Silva
How to Import Strategies into Rule Plotter for MetaTrader How to Import Strategies into Rule Plotter for MetaTrader The Rule Plotter is a powerful tool for traders that allows visualization and application of trading strategies in MetaTrader...
Francisco Gomes Da Silva
How to create a ADX Robot


In the latest video on our channel, we performed a detailed backtest of an investment robot using the ADX indicator native to MetaTrader, developed by Welles Wilder in 1979.

The ADX (Average Directional Index) has proven to be a robust and reliable indicator over the decades, establishing itself as an essential tool for traders on various platforms. Its ability to measure the strength of a trend has made it a native indicator on major trading platforms.

In this video, we show how to configure and backtest this strategy using Rule Plotter. You will see how this powerful combination can be used to effectively and intuitively test and validate your trading strategies.

Watch the video to see how the ADX remains a valuable tool for traders and how Rule Plotter facilitates the creation and testing of automated investment robots.

https://youtu.be/c7ywwYSV-BI
Francisco Gomes Da Silva
Rule Plotter is like a wizard for trading strategies in MetaTrader. With just a few clicks, you can craft your own strategies effortlessly. The best part? It's not just about creating them; Rule Plotter lets you export your ingenious strategies too. And here's the cherry on top – it won't cost you a dime! Get your hands on Rule Plotter by clicking the link and start building strategies without breaking a sweat. It's your ticket to strategic trading without the need for programming know-how.
https://www.mql5.com/en/market/product/107361
shared product
Reviews: 1
50.00 USD

Trading Your Strategies Created with Rule Plotter Indicator with Rule Plotter Expert: Now that you have created your custom strategies using the Rule Plotter Indicator and visualized the arrows indicating entry and exit points on the chart, it's time to bring these strategies to life in the financial markets. With the Rule Plotter Expert, you can trade autonomously and accurately based on these arrows, making the most of the potential of your strategies Turning Arrows into Actions: The arrows

Francisco Gomes Da Silva
Video Tutorial of how create a robot with Rule Plotter using the indicator Super Trend Line:
https://youtu.be/D93igot0FkU

Rule Plotter: program to create robots with no code
https://www.mql5.com/en/market/product/107361

SuperTrendLine indicator:
https://www.mql5.com/en/market/product/73264