Pivots

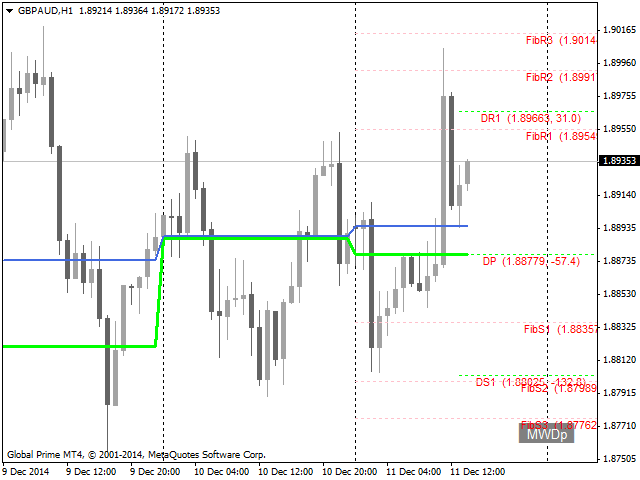
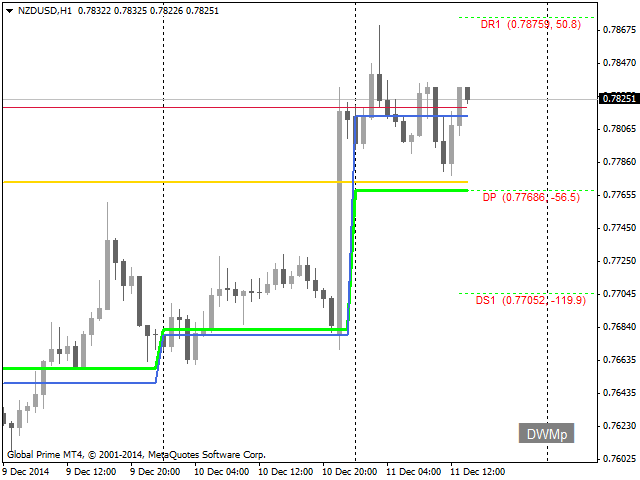
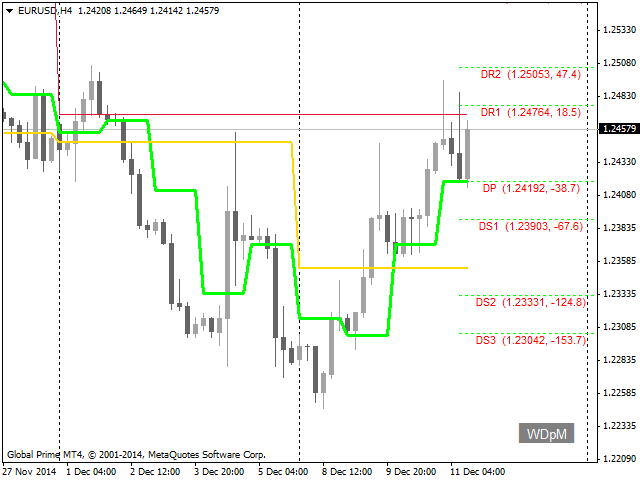
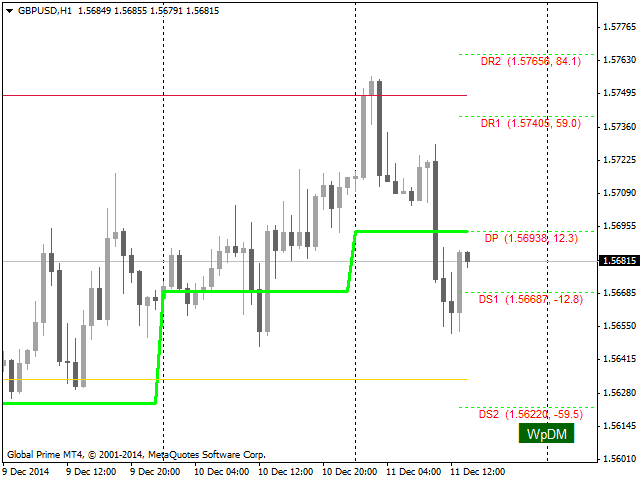
Pivots is an indicator to show pivots for relevant time frames. Besides the pivots the indicator can also show daly open line, the resistance and support levels, the ADR Fibonacci levels and the order of the pivots.

Pivots includes an intelligent algorithm to eliminate Sunday candles, but only if your broker provides those.

Pivots are significant price levels that may serve as support, resistance or breakout levels

Settings

  • textFont - font to use for the labels.
  • textSize - font size.
  • textColor - you know what to do.
  • maxBars - the number of candles Pivots shows information for, decrease if necessary.
  • addSundayToMonday - set to true to add Sunday candles, if any, to the following Monday candle, useful for D1 only.
  • showDailyLine - set to true to show the daily pivot.
  • showDailyOpenLine - set to true to show the daily open line.
  • showWeekLine - set to true to show the weekly pivot.
  • showMonthLine - set to true to show the monthly pivot.
  • showDailySR - set to true to show the daily pivot support & resistance lines.
  • showDailyOpenSR - set to true to show the daily open support & resistance lines.
  • showWeeklySR - set to true to show the weekly pivot support & resistance lines.
  • showMonthlySR - set to true to show the monthly pivot support & resistance lines.
  • showSRAtOwnBar - set to true to start the support & resistance line at the close of the pivot candle.
  • showFibonacci - set to true to show the Fibonacci levels based on the daily ADR.
  • includeDistance - set to true to include the distance to price in the labels.
  • includeValue - set to true to include the value of the level in its label.
  • shiftText... - number of pixels to shift labels to the right.
  • showOrder - set to true to show the order of the main pivots (D, W, M) and price (P).
  • showOrderBackground - set to true to show a background to the order.
  • orderX - X number of pixels of the order from the bottom right corner.
  • orderY - Y number of pixels of the order from the bottom right corner.
  • style... - pick your favorite line style.
  • width... - set line widths.
  • color... - choose your favorite.

If in doubt, start with the default options.

Loose Ends

If you run in any problems, try to load some history for all your symbols before dropping Pivots on your chart.

Do not hesitate to contact me. Let me know what you think of Pivots. Only with your help, I can create better tools for MT4.
Recommended products
KT Auto Trendline MT4
KEENBASE SOFTWARE SOLUTIONS
KT Auto Trendline draws the upper and lower trendlines automatically using the last two significant swing highs/lows. Trendline anchor points are found by plotting the ZigZag over X number of bars. Features No guesswork requires. It instantly draws the notable trendlines without any uncertainty. Each trendline is extended with its corresponding rays, which helps determine the area of breakout/reversal. It can draw two separate upper and lower trendlines simultaneously. It works on all timeframe
The price is moving between two curve tunnel lines in a trend. The two lines of a tunnel represent support and resistance. In an uptrend, for instance, a trade might be entered at the support of the trend line (shown by the red line in the chart) and exited at resistance of the upper tunnel line (shown by the blue line). Tunnel show trend direction for any timeframe (if you have enough bars on the chart for higher timeframes). Trend, or price tunnel, can be up, down or sideways. If the current p
AutoPivot
Hafis Mohamed Yacine
This indicator will draw monthly, weekly, and daily pivot. Pivot line will be calculated automatically again when the period ends. Auto Pivot Metatrader 4 Indicator The Auto Pivot indicator for Metatrader 4 automatically updates the pivot point (PP), support (S1,S2,S3) and resistance levels (r1,r2,r3) every day. Price above the pivot point means positive while price below the pivot point means negative. S3 indicates extremely oversold while price above resistance r3 means extremely overbought.
Smart Trendlines
Suvashish Halder
5 (1)
Smart Trendlines – No.1 Trendlines Indicator Smart Trendlines is a precision tool that automatically draws trendlines based on every valid pivot point, helping traders identify key support and resistance zones. It continuously adjusts as new market pivots form, providing a live and accurate reflection of price structure. Whether you’re tracking trends, preparing for reversals, or anticipating breakouts — this indicator keeps you one step ahead. It works seamlessly across all assets including For
support resistance levels indicator mt4: This tool is a multi-timeframe indicator that identifies and plots support and resistance lines, as well as Fibonacci levels, on a chart with the same accuracy as the human eye. TW support and resistance levels for forex has complex algorithm that scans the chart to identify previous levels of price stabilization and rebounds, recording the number of touches. Are you tired of manually drawing support and resistance levels and Fibonacci retracements? Ch
Pivots indicator
Mahmoud Helmy Sedik Mohamed Mansour
Pivots Points are price levels chartists can use to determine intraday support and resistance levels. Pivot Points use the previous days Open, High, and Low to calculate a Pivot Point for the current day. Using this Pivot Point as the base, three resistance and support levels are calculated and displayed above and below the Pivot Point.     and below the Pivot Point.
Possible Price reversals levels - based on  Fibonacci + Support +  Resistance Levels Auto levels drawn based on input index (Bars Count )  ---->>> Price Over 50% Fibo line ---> UP TREND ---> BUY when price drop near Support Lines  ---->>> Price Down 50% Fibo line ---> DOWN TREND ---> SELL when price goes up  near Resistance Lines  --->>> The more close price levels ----> the more possibility for price reversals --->>> are you a scalper --> try it on M1 charts with big index like 5000 bars  or
5TT Pivot Lines is a visual display of pivot lines. These are primarily support and resistance points with the 'Blue' Pivot Point. Pivot points are useful for determining key levels for entry or exits (setting targets and stop loss levels). Having these support & resistance lines visually displayed on the chart is very useful for intraday traders. 5TT Pivot Lines come with some user-friendly settings to decide if to display the lines or connectors on the chart Settings CandlesBack: This gives th
Optimized Version of the Pivot-Based Adaptive Support, Resistance, and Signal Line Indicator No Parameters, Simple and Easy to Use, Suitable for Daily and Lower Timeframes. Advantages: Applicable to all instruments. Suitable for all timeframes. The indicator automatically adjusts with changing data, providing more accurate signals. Instructions for Use: If the current price breaks above the signal line, the trend is bullish, with the initial target being the upper resistance line. If the price
The indicator draws trend lines based on Thomas Demark algorithm. It draws lines from different timeframes on one chart. The timeframes can be higher than or equal to the timeframe of the chart, on which the indicator is used. The indicator considers breakthrough qualifiers (if the conditions are met, an additional symbol appears in the place of the breakthrough) and draws approximate targets (target line above/below the current prices) according to Demark algorithm. Recommended timeframes for t
Pivots MT4
Denis Luchinkin
Pivots MT4 - Простой и удобный индикатор уровней pivot , рассчитывает уровни по методам  Classic , Fibonacci , DeMark , Camarilla , WooDie , Central Pivot Range . Индикатор выгодно отличается следующим Рассчитывает уровни pivot по методам  Classic ,  Fibonacci ,  DeMark ,  Camarilla ,  WooDie ,  Central Pivot Range ; Выводит на графике текущие уровни и уровни на предыдущих периодах; Выводит на графике выбранные метод и период, названия уровней и их ценовые значения. Параметры Pivot Method - Выпа
This support and resistance indicator gives u a)support level b)resistance level c)direction(trend) all in one.The indicator is based on the top 3 best levels there are!Red dots are sell direction and green dots are buy direction,if candles dont break these levels u get in after the 3rd dot,always use higher time frames from h1 up so its more clear where direction is going,also u can set the indicator to your time frame that u are lookin at.
Pivot Points Multi
Professoft Limited
Pivot Points Indicator Features: Send alerts when a pivot line is hit Displays Daily, Weekly, Monthly Indicators at the same time on the chart Restricting the time during the day when the alerts are sent Adjust the styling settings for the Pivot lines Settings: Show Daily Pivots Show Weekly Pivots Show Monthly Pivots Weekly Pivots Hit Notification Enabled Monthly Pivots Hit Notification Enabled Hit Check Frequency Time Restriction Enabled From Hour To Hour PP Color R1 Color R2 Color R3 Color S1
Pivot levels Auto V1
Hafis Mohamed Yacine
What Is a Pivot Point? A pivot point is a technical analysis indicator, or calculations, used to determine the overall trend of the market over different time frames. The pivot point itself is simply the average of the intraday high and low, and the closing price from the previous trading day. On the subsequent day, trading above the pivot point is thought to indicate ongoing bullish sentiment, while trading below the pivot point indicates bearish sentimen How to Use Pivot Points The very ess
Raymond Cloudy Day Indicator for MT4 – Pivot-Based Reversal and Trend Levels Raymond Cloudy Day Indicator is a pivot-based level indicator for MetaTrader 4 (MT4). It was developed by Ngo The Hung based on Raymond’s original idea and is designed to give a structured view of potential reversal zones, trend extensions and support/resistance levels directly on the chart. The default settings are optimised for XAUUSD on the H1 timeframe, but the indicator can be tested and adjusted for other symbols
Leo Fibonacci
Dmitriy Zaytsev
The indicator is designed for determining Fibonacci levels. Does not repaint/redraw The blue level shows the zero Fibonacci value (it is also the Pivot level) Red levels show calculated Fibonacci levels (used as a rollback or reversal point) Automatic period detection (periods can be entered manually) Adjustable display calculation method. Settings BarsHistory - the number of bars to be used to display the indicator. Method - method of calculation. AutoPeriod - automated period calculation (true
FiboZag
Andriy Sydoruk
Indicator FiboZag - transfer the indicator to the chart and the Fibonacci levels will be built automatically on the last ZigZag turn. The main advantage lies in the correct construction of Fibonacci levels and markup of price levels. Simple, visual and effective use. The indicator is not redrawn and does not lag. Works on all currency pairs and on all timeframes.
Pivot Points MT4
KEENBASE SOFTWARE SOLUTIONS
KT Pivot Points automatically plots the daily, weekly, and monthly pivot levels on a chart with the precise calculation based on the latest data. Pivot points is a widely used indicator in technical analysis, particularly in the Forex market. Features Send alerts when the price touches the pivot level.  It offers complete customization for each kind of pivot level.   Shows daily, weekly, and monthly pivot levels without any fuss. It uses minimum CPU resources for faster calculation. Compatible
Introduction Professional traders use pivot points as support/resistance levels or as an indicator of a trend. Basically, a pivot point are areas at which the direction of price movement can  possibly  change. What makes pivot points so popular is their objectivity as they are recalculated each time the price moves further. The pivot points indicator implements 5 popular pivot points calculation and drawing: Standard –  The most basic and popular type of the pivots, each point serve as an indica
Camarilla Pivot Points is a math-based price action analysis tool that generates potential   intraday support and resistance levels.  Pivot price values are stored in output buffers within this indicator, enabling any Expert Advisor to utilize this indicator's data for trading purposes. This indicator offers the potential for developing numerous strategies. To explore some of these strategies, please visit the following websites:  https://www.babypips.com/forexpedia/camarilla-pivot-points https:
NAM Divergences
NAM TECH GROUP, CORP.
5 (1)
MT4 Multi-timeframe Divergence and Overbougt/Oversold detection indicator. Features - Fully customizable on chart control panel, provides complete interaction. - Hide and show control panel wherever you want. - Real time information about non-capitalized divergences. - Real time information about overbougt / oversold situations. - Real time information about regular divergences. - Real time information about hidden divergences. - Oscillators available for divergences detection: AO, RSI, CCI, MA
Overview This is the WOODIE version in the Verdure Pivot Trail Series. Verdure Woodie Pivot Trail plots WOODIE pivot levels for every bar on the chart. Pivot levels are great at determining turning points in the market and when period pivot levels are compared to daily pivot level, these turns can be accurately predicted and timed. Features Dynamically calculates and draws Pivot levels for every bar on the chart (Central Pivot Point, R1, R2, R3, S1, S2 and S3) Pivot level can be used to trail p
Created by imjesstwoone and mickey1984, this trade model attempts to capture the expansion from the 10:00-14:00 EST 4h candle using just 3 simple steps. All of the information presented in this description has been outlined by its creators, all I did was translate it to MQL4. All core settings of the trade model may be edited so that users can test several variations, however this description will cover its default, intended behavior using NQ 5m as an example. Step 1 is to identify our Price Ra
Auto Fibo mw
DMITRII GRIDASOV
"Auto FIBO" Crypto_Forex indicator - is great auxiliary tool in trading! - Indicator automatically calculate and place on chart Fibo levels and local trend lines (red color). - Fibonacci levels indicate key areas where price can reverse. - Most important levels are 23.6%, 38.2%, 50% and 61.8%. - You can use it for reversal scalping or for zone grid trading. - There are plenty of opportunities to improve your current system using Auto FIBO indicator as well. Click here to see high quality Trad
This indicators automatically draws the Support and resistances levels for you once you've dropped it on a chart.  It reduces the hustle of drawing and redrawing these levels every time you analysis prices on a chart. With it, all you have to do is dropped it on a chart, adjust the settings to your liking and let the indicator do the rest.  But wait, it gets better; the indicator is absolutely free!  Get the new and improved version here:  https://youtu.be/rTxbPOBu3nY Parameters Time-frame  -> T
FREE
This indicator will draw Support and Resistance lines calculated on the nBars distance. The Fibonacci lines will appear between those 2 lines and 3 levels above or under 100%. You may change the value of each level and hide one line inside 0-100% range and all levels above or under 100%. Input Parameters: nBars = 24; - amount of bars where the calculation of Support and Resistance will be done. Fibo = true; if false then only Support and Resistance will be shown. Level_1 = true; - display of th
Indicator Support and Resistence plain in your chart seven lines; Red line=Resistence 3. Red line=Resistence 2. Red line=Resistence 1. Yellow line= Pivot. Green line= Support 1. Green line= Support 2. Green line= Support 3. adattable in all timeframe (minute 1, minute   5, minute   15, minute   30, Hour 1, Hour 4,Day 1,Week 1,Mounth 1); Buy under support and sell over the resistence;
The Morning Star PRT indicator uses the morning flat breakout principle. The indicator displays morning flat levels and shows possible targets. An additional Fibonacci level has been added to the indicator, as well as sound alerts about the intersection of both target levels specified in the settings and the night flat level. The Morning Star PRT indicator builds a night flat channel at the end of the night, as well as two Fibonacci price levels up and down. These levels can be considered both
Magic Pivot
Evgeny Belyaev
Magic Pivot is a professional indicator for finding the support and resistance lines; it has been developed by a group of professional traders. The indicator plots three support lines and three resistance lines, where a price reversal is highly probable. Magic Pivot is an excellent tool for scalping and intraday trading.   Advantages High accuracy of signals. Suitable for scalping and intraday trading. The indicator does not redraw. Simple indicator setup, minimum parameters. Works on any financ
Vertical time lines
Bekhterev Sergey
5 (1)
Vertical time lines. A simple indicator that draws on the graph vertical lines of time. 1,3,5,10,12,15,20,30,60 minutes. You can change the line color, line style, select a time period from 1 to 60 minutes. Applies to any chart, timeframe. Incoming parameters: Minute_Num = 20;           // step 3,5,12,10,20,15,30,60 minutes color Line_Color = clrYellow; // color line Line_Dash = 2;                //0,1,2,3,4... solid, dash, dot, dash dot,dash dot dot
FREE
Buyers of this product also purchase
Gann Made Easy
Oleg Rodin
4.83 (162)
Gann Made Easy is a professional and easy to use Forex trading system which is based on the best principles of trading using the theory of W.D. Gann. The indicator provides accurate BUY and SELL signals including Stop Loss and Take Profit levels. You can trade even on the go using PUSH notifications. PLEASE CONTACT ME AFTER PURCHASE TO GET TRADING  INSTRUCTIONS AND GREAT EXTRA INDICATORS   FOR FREE! Probably you already heard about the Gann trading methods before. Usually the Gann theory is a ve
M1 Sniper
Oleg Rodin
5 (22)
M1 SNIPER is an easy to use trading indicator system. It is an arrow indicator which is designed for M1 time frame. The indicator can be used as a standalone system for scalping on M1 time frame and it can be used as a part of your existing trading system. Though this trading system was designed specifically for trading on M1, it still can be used with other time frames too. Originally I designed this method for trading XAUUSD and BTCUSD. But I find this method helpful in trading other markets a
Market Makers
Mohamed Hassan
5 (3)
After purchase, contact me privately to receive 1 month of free testing with EA Forex Proton! This advanced MT4 trading robot automatically executes signals from any MT4 indicator, including Market Makers. The latest version also includes AI integration, allowing each trade signal to be analyzed using Artificial Intelligence. Live Signal with EA Forex Proton: Click here Market Makers is a powerful price action trading system designed to identify high-probability Buy and Sell opportunities based
PRO Renko System
Oleg Rodin
5 (30)
PRO Renko System is a highly accurate trading system specially designed for trading RENKO charts. The ARROWS and Trend Indicators DO NOT REPAINT! The system effectively neutralizes so called market noise giving you access to accurate reversal signals. The indicator is very easy to use and has only one parameter responsible for signal generation. You can easily adapt the tool to any trading instrument of your choice and the size of the renko bar. I am always ready to provide extra support to help
Ultimate Sniper Dashboard
Hispraise Chinedum Abraham
4.82 (22)
Currently on massive July Discount! Prices will increase in the future! Read description below! Once you purchase, send a message to my inbox for manual and starter kit. Best Entry System for Ultimate Sniper Dashboard: ULTIMATE DYNAMIC LEVELS. (Please Check my products) The Ultimate Sniper Dashboard ONLY works on live markets due to MT4 multicurrency testing limits. Introducing the Ultimate-Sniper Dashboard! Our very best which contains both HA-Sniper, MA-Sniper. and many special modes. The Ul
Trend Screener
STE S.S.COMPANY
4.79 (95)
Trend Screener Indicator --Professional Trend Trading & Market Scanning System for MetaTrader Unlock the true power of trend trading with Trend Screener Indicator — a complete multi-currency, multi-timeframe trend analysis solution   powered by Fuzzy Logic,Trend Pulse Technology  and advanced market structure algorithms.   Trend Screener transforms your MetaTrader platform into a professional-grade Trend Analyzer and Market Scanner, helping you identify high-probability trend opportunities, ear
GoldRush Trend Arrow Signal V1.6 The GoldRush Trend Arrow Signal indicator V1.6 continues to provide precise, real-time trend analysis tailored for high-speed, short-term scalpers in XAU/USD , but it now has additional features and improved efficiency and reliability. Built specifically for the 1-minute time frame, this tool displays directional arrows for clear entry points, allowing scalpers to navigate volatile market conditions with confidence. The indicator consists of PRIMARY and SECONDARY
Super Signal – Skyblade Edition Professional No-Repaint / No-Lag Trend Signal System with Exceptional Win Rate | For MT4 / MT5 It works best on lower timeframes, such as 1-minute, 5-minute, and 15-minute charts. Core Features: Super Signal – Skyblade Edition is a smart signal system designed specifically for trend trading. It applies a multi-layered confirmation mechanism to detect only strong, directional moves supported by real momentum. This system does not attempt to predict tops or bottoms
The " Dynamic Scalper System " indicator is designed for the scalping method of trading within trend waves. Tested on major currency pairs and gold, compatibility with other trading instruments is possible. Provides signals for short-term opening of positions along the trend with additional price movement support. The principle of the indicator. Large arrows determine the trend direction. An algorithm for generating signals for scalping in the form of small arrows operates within trend waves.
Ultimate Dynamic Levels
Hispraise Chinedum Abraham
4.7 (10)
Discounted at $199 for early birds! Prices may increase in the future. Read description below. Once you purchase, send a message to my inbox for manual. Introducing Ultimate Dynamic Levels - the BEST Entry Indicator for the Ultimate Sniper Dashboard! Extremely Low-Risk timely entries and high RR! Find the Ultimate Sniper Dashboard Here The most important ability for both beginner and pro traders is to tell exactly where and when a market is most likely to turn, and how to get in safely and ex
Scalper Inside PRO
Alexey Minkov
4.74 (69)
Scalper Inside PRO – Since 2020. An exclusive indicator that utilizes an innovative algorithm to swiftly and accurately determine the market trend. The indicator automatically calculates opening, closing, and profit levels, providing detailed trading statistics. With these features, you can choose the most appropriate trading instrument for the current market conditions. Additionally, you can easily integrate your own arrow indicators into Scalper Inside Pro to quickly evaluate their statistics
Advanced Supply Demand
Bernhard Schweigert
4.91 (299)
Trading Special – 40% OFF Best Solution for any Newbie or Expert Trader! This indicator is a unique, high quality and affordable trading tool because we have incorporated a number of proprietary features and a new formula. With this update, you will be able to show double timeframe zones. You will not only be able to show a higher TF but to show both, the chart TF, PLUS the higher TF: SHOWING NESTED ZONES. All Supply Demand traders will love it. :) Important Information Revealed Maximize the pot
Route Lines Prices is an indicator designed for finding price directions. Its simple interface contains multiple algorithms for price behavior and future direction calculations. These algorithms include volatility calculations and price smoothing based on the timeframes used. The indicator has a single parameter for changing the " Calculating Price Values " value. The default value of 1 provides a balanced automatic calculation, which can be used without manually configuring the indicator. By m
Auto Optimized Parabolic RSI: Advanced 3D Momentum Engine Most retail indicators fail because they rely on static inputs that break the moment market volatility shifts. Auto Optimized Parabolic RSI solves the problem of "indicator decay" by continuously recalculating its own mathematical edge, bringing institutional-grade quantitative adaptation directly to your MT5 terminal. The Core Advantage: Custom In-Memory 3D Optimization   Standard auto-optimizers often freeze the MT5 platform because the
Apollo SR Master is a Support/Resistance indicator with special features which make trading with Support/Resistance zones easier and more reliable. The indicator calculates Support/Resistance zones in real-time without any time lag by detecting local price tops and bottoms. Then to confirm the newly formed SR area, the indicator shows special signal which signalizes that the SR zone can be taken into consideration and used as an actual SELL or BUY signal. In this case the strength of the SR zone
Trading Special –40% OFF Best Solution for any Newbie or Expert Trader! This Indicator is a unique, high quality and affordable trading tool because we have incorporated a number of proprietary features and a new formula. With only ONE chart you can read Currency Strength for 28 Forex pairs! Imagine how your trading will improve because you are able to pinpoint the exact trigger point of a new trend or scalping opportunity? User manual: click here That's the first one, the original! Don't buy a
Currency Strength Exotics
Bernhard Schweigert
4.88 (33)
CURRENTLY 20% OFF ! Best Solution for any Newbie or Expert Trader! This Indicator is specialized to show currency strength for any symbols like Exotic Pairs Commodities, Indexes or Futures. Is first of its kind, any symbol can be added to the 9th line to show true currency strength of Gold, Silver, Oil, DAX, US30, MXN, TRY, CNH etc. This is a unique, high quality and affordable trading tool because we have incorporated a number of proprietary features and a new formula. Imagine how your trading
BTMM State Engine Pro is a MetaTrader 4 indicator for traders who use the Beat The Market Maker approach: Asian session context, kill zone timing, level progression, peak formation detection, and a multi-pair scanner from a single chart. It combines cycle state logic with a built-in scanner dashboard so you do not need the same tool on many charts at once. What it does Draws the Asian session range; session times can follow broker server offset or be set in inputs. Tracks level progression (L
- Real price is 80$ - 50% Discount (It is 39$ now) - just for 2 purchases. Contact me for instruction, add group and any questions! - Non-repaint - I just sell my products in Elif Kaya profile, any other websites are stolen old versions, So no any new updates or support. - Lifetime update free Related product:   Bitcoin Expert Introduction The breakout and retest strategy is traded support and resistance levels. it involves price breaking through a previous level.  The break and retest strateg
Atomic Analyst
Issam Kassas
5 (5)
First of all Its worth emphasizing here that this Trading Indicator is   Non-Repainting , Non Redrawing and Non Lagging Indicator   Indicator, Which makes it ideal from both manual and robot trading.  User manual: settings, inputs and strategy . The Atomic Analyst  is a PA Price Action Indicator that uses Strength and Momentum of the price to find a better edge in the market. Equipped with Advanced filters which help remove noises and false signals, and Increase Trading Potential. Using Multiple
Dynamic Forex28 Navigator
Bernhard Schweigert
4.43 (7)
Specials Discount now. The Next Generation Forex Trading Tool. Dynamic Forex28 Navigator is the evolution of our long-time, popular indicators, combining the power of three into one: Advanced Currency Strength28 Indicator (695 reviews) + Advanced Currency IMPULSE with ALERT (520 reviews) + CS28 Combo Signals (recent Bonus) Details about the indicator  https://www.mql5.com/en/blogs/post/758844 What Does The Next-Generation Strength Indicator Offer? Everything you loved about the originals, now
TPSpro RFI Levels
Roman Podpora
4.86 (28)
INSTRUCTIONS RUS   /   INSTRUCTIONS   ENG   -   VERSION  MT5 Main functions: Displays active zones of sellers and buyers! The indicator displays all the correct first impulse levels/zones for purchases and sales. When these levels/zones are activated, where the search for entry points begins, the levels change color and are filled with certain colors. Arrows also appear for a more intuitive perception of the situation. LOGIC AI - Display of zones (circles) for searching entry points when activa
GOLD Impulse with Alert
Bernhard Schweigert
4.67 (12)
This indicator is a super combination of our 2 products  Advanced Currency IMPULSE with ALERT  and  Currency Strength Exotics . It works for all time frames and shows graphically impulse of strength or weakness for the 8 main currencies plus one Symbol! This Indicator is specialized to show currency strength acceleration for any symbols like Gold, Exotic Pairs, Commodities, Indexes or Futures. Is first of its kind, any symbol can be added to the 9th line to show  true currency strength accelerat
Cycle Sniper
Elmira Memish
4.39 (36)
Please contact us after your purchase and we will send you the complimentary indicators to complete the system Cycle Sniper is not a holy grail but when you use it in a system which is explained in the videos, you will feel the difference. If you are not willing to focus on the charts designed with Cycle Sniper and other free tools we provide, we recommend not buying this indicator. We recommend watching the videos about the indiactor and system before purchasing. Videos, settings  and descri
KT Alpha Hunter Arrows MT4
KEENBASE SOFTWARE SOLUTIONS
Most arrow indicators give you a signal and leave you to figure out the rest. KT Alpha Hunter Arrows gives you the full trading plan. Every signal arrow prints with a full plan already drawn: entry line, stop-loss, four take-profit levels, and a live edge verdict telling you whether this symbol and time-frame is worth trading right now. An included Trade Manager EA handles the execution after you enter, so discipline stays intact when the market gets loud. Non-repaint. Closed-bar signals only. B
Easy Reversal is designed to help traders spot turning points in the market with clear buy and sell signals. The indicator is based on the Keltner Channel but improved with a custom calculation that uses ATR and EMA confirmation. This makes it more reliable and less noisy than standard reversal tools.  The signals from Easy Reversal appear directly from peak candlestick behavior, showing you when price action is reaching exhaustion. A buy signal is generated when a candlestick forms a strong r
Volatility Trend System - a trading system that gives signals for entries. The volatility system gives linear and point signals in the direction of the trend, as well as signals to exit it, without redrawing and delays. The trend indicator monitors the direction of the medium-term trend, shows the direction and its change. The signal indicator is based on changes in volatility and shows market entries. The indicator is equipped with several types of alerts. Can be applied to various trading ins
Linear Trend Predictor - A trend indicator that combines entry points and direction support lines. It works on the principle of breaking through the High/Low price channel. The indicator algorithm filters market noise, takes into account volatility and market dynamics. Indicator capabilities Using smoothing methods, it shows the market trend and entry points for opening BUY or SELL orders. Suitable for determining short-term and long-term market movements by analyzing charts on any timeframes.
Trend indicator AI
Ramil Minniakhmetov
4.53 (83)
Trend Ai indicator is great tool that will enhance a trader’s market analysis by combining trend identification with actionable entry points and reversal alerts.  This indicator empowers users to navigate the complexities of the forex market with confidence and precision Beyond the primary signals, Trend Ai indicator identifies secondary entry points that arise during pullbacks or retracements, enabling traders to capitalize on price corrections within the established trend. Important Advantage
MBFX Timing
Mohamed Hassan
5 (3)
After purchase, contact me in private to get 7 days of FREE testing with EA Forex Proton where the robot automatically takes the trade alerts from MBFX Timing! MBFX Timing is an indicator that was developed and created by Mostafa Belkhayate, one of the best traders in the world. We decided to create a modified version that takes inspiration from the Stochastic Oscillator and the Relative Strength Quality Index indicators to improve your trading.  One of the main reasons we released MBFX Timing
More from author
Monster Harmonics Indicator is a harmonic pattern indicator. It recognizes Gartley, Bat, Crab, Butterfly, Cypher, White Swan, Black Swan, Shark and AB=CD patterns. Projected patterns that are not yet completed are recognized, too. Monster even shows the PRZ (Potential Reversal Zone). Users can add their own user defined patterns to Monster. Besides the current pattern, Monster also shows all patterns in the symbols history. Monster will provide alerts for developing patterns. Introduced by H.M.
Monster Harmonic Indicator
Paul Geirnaerdt
4.59 (29)
Monster Harmonics Indicator is a harmonic pattern indicator. It recognizes Gartley, Bat, Crab, Butterfly, Cypher, White Swan, Black Swan, Shark and several other patterns. Projected patterns that are not yet completed are recognized, too. Monster even shows the PRZ (Potential Reversal Zone). Users can add their own user defined patterns to Monster. Besides the current pattern, Monster also shows all patterns in the symbols history. Monster will provide alerts for developing patterns. Introduced
TMA Currency Meter
Paul Geirnaerdt
4.14 (7)
TMA Currency Meter is the ultimate currency meter. Based on the Triangular Moving Average of all available symbols, this indicator shows which currencies are strong, strengthening, weak or weakening. Experienced as well as novice traders will see the strong and weak currencies in the blink of an eye, and know which trade possibilities to explore further. TMA Currency Meter is a true Multi Timeframe indicator. It is easy to show the currency strengths for a higher timeframe than the chart timefra
MonsterDash Harmonic Indicator is a harmonic pattern dashboard. It recognizes all major patterns. MonsterDash is a dashboard that displays all detected patterns for all symbols and (almost) all timeframes in sortable and scrollable format. Users can add their own user defined patterns . MonsterDash can open and update charts with the pattern found. Settings MonsterDash's default settings are good enough most of the time. Feel free to fine tune them to your needs. The color settings are for thos
Riskscope
Paul Geirnaerdt
Riskscope shows all relevant information about your trades on screen. Information on Stop Loss and Take Profit can be shown as price, pips or exposure. Besides, Riskscope can display a high- and low-watermark of the total of your basket of trades. Settings Riskscope's default settings are good enough most of the time. Nearly all of them are fairly standard. Here are the ones that need some explanation. Monospaced font - set this to the (name of) the font you want to use. A monospaced font looks
Inside Bars
Paul Geirnaerdt
The Inside Bars indicator shows Inside Bars, the Breakout Zone and Breakouts thereof. Inside Bars are an important price action pattern. The price action of an Inside Bar is completely covered by the price action of the previous bar. Inside Bars are most often used on higher timeframes. Settings Inside Bars default settings are good enough most of the time. Feel free to fine tune them to your needs. ATR factor to skip large candles - very large candles should be filtered as they often cover othe
Candle Patterns
Paul Geirnaerdt
5 (2)
The Candle Patterns indicator shows popular candle patterns on the chart. The possible patterns are Inside Bar, Large Wick, Engulfing, Marubozu, Hammer, Shooting Star, Three White Soldiers and Three Black Crows. Candles are colored to easily identify the patterns. Also, a point and click function displays the pattern found. Settings Message box - when a candle is clicked, the pattern identified will be shown in a Message Box on the charts. All 'Message Box' settings pertain to the box. Show Ins
Better Support Resistance
Paul Geirnaerdt
4.4 (5)
Better Support & Resistance shows the best support and resistance lines and zones. It is based on Fractals with the factor of your choice. All fractals are assembled, weighted, extended and merged into a clear set of support and resistance lines. The immediate nearby lines are shown as zones when price is in that zone. Better Support & Resistance gives you the best overview of the important price levels. Settings Better Support & Resistance's default settings are good enough most of the time. N
The Engulfing Bars indicator shows Engulfing Bars, the signal and the suggested stoploss and take profit. Engulfing Bars are an important price action pattern. The price action of an Engulfing Bar completely covers the price action of the previous bar. Engulfing Bars are most often used on higher timeframes. Settings Engulfing Bars default settings are good enough most of the time. Feel free to fine tune them to your needs. Show Engulfing Bars - Set to true to show Engulfing Bars. Body size per
Flying Volume
Paul Geirnaerdt
1 (1)
The Flying Volume indicator is a specialized volume indicator. It deciphers the volume data after heavy proprietary number crunching. When a main signal is found Flying Volume will look for possible continuation points. The main signal is shown by arrows, the continuation points by dots. Volume indicators are most often used on higher timeframes. Features Main Buy or Sell signals Continuation signals No repainting One signal per bar Settings Flying Volume default settings are good enough most
Fractalicious
Paul Geirnaerdt
Fractalicious shows Fractals of any length, higher or lower highs and lower of higher lows, the fractal channel and the breakout of the channel. Fractals are an important trend and price action pattern. Fractalicious can be used on any timeframe and symbol. Settings Fractalicious default settings are good enough most of the time. Feel free to fine tune them to your needs. Show last fractal - Set to true to show fractals from the last completed bar. (This could move the fractal if the current ba
Breakout Hero
Paul Geirnaerdt
2.64 (11)
Breakout Hero is a Multi Symbol , Auto Timeframe , Breakout Expert Advisor . It recognizes breakout patterns and will set pending trades. When triggered Breakout Hero will monitor trades and adjust the stop loss. Breakout Hero is a multi symbol EA, it will trade EURUSD, GBPUSD, USDJPY and USDCAD. Also, Breakout Hero is auto timeframe. Just drop Breakout Hero on any chart and start trading. Only one chart is needed, Breakout Hero will trade the symbols you pick from the settings. You can monitor
Dark Rider
Paul Geirnaerdt
1 (2)
Dark Rider  is a Night Scalper Expert Advisor . It recognizes overbought and oversold conditions in the hours after close of the New York Exchange and trades accordingly. Dark Rider features an on screen monitor and settings panel on which you can monitor your status and progress.  A signal for Dark Rider can be found here . New in version 1.5 The option 'Stay in trending trades' is new for version 1.5. It will keep you in trending trades. Profitability has been increased while drawdown has bee
Divergence Dash
Paul Geirnaerdt
3 (2)
Diverence Dash is a MACD, RSI, OBV, Momentum, Stochastic or Standard Deviaviation Divergence Dashboard. It will scan all symbols and timeframes you want. Also, Divergence Dash can open charts with the divergence found using the template of your choice. Divergences are often used as a leading indicator and, by using Divergence Dash, are easy to spot. The risk/reward ratio in divergence trading is very low. What can Divergence Dash for you: Find MACD, RSI, OBV, Momentum, Stochastic or Standard Dev
Fusion Trader
Paul Geirnaerdt
5 (1)
NEWS Price increased to $249 from $149 on September 16th. Buy Fusion Trader v2 and get Donchian Trader for free. (limited to 3 account numbers) Fusion Trader v2  is a  Multi Symbol ,  Auto Timeframe ,  Expert Advisor . It features several strategies for different symbols and timeframes. Fusion Trader will monitor trades and adjust the stop loss. Fusion Trader v2  is a complete rewrite from v1, it trades different and more symbols. With default settings Fusion Trader has gained 5% monthly on ave
Donchian Trader
Paul Geirnaerdt
Donchian Trader is a   Multi Index ,   Auto Timeframe ,   Expert Advisor . It features a Donchian Channel strategy for different indices on the daily timeframe. Donchian Trader will monitor trades and adjust to market conditions. Donchian Trader is a multi index EA, For now, it will trade the Dow Jones (US30), S&P 500 (US500) and DAX (GER30). Also, Donchian Trader is auto timeframe. Just drop the EA on any chart and start trading. Only one chart is needed, Donchian Trader will trade the indices
MonsterDash Harmonics Indicator is a harmonic pattern dashboard. It recognizes all major patterns. MonsterDash is a dashboard that displays all detected patterns for all symbols and (almost) all timeframes in sortable and scrollable format. Users can add their own user defined patterns . MonsterDash can open and update charts with the pattern found. Settings MonsterDash's default settings are good enough most of the time. Feel free to fine tune them to your needs. The color settings are for tho
NEWS Price v4 now $799 for a limited period. Fusion Trader v4  is a  Multi Symbol ,  Auto Timeframe ,  Expert Advisor . It features several strategies for different symbols and timeframes. Fusion Trader will monitor trades and adjust the stop loss. Fusion Trader v4  is a partial rewrite from v3, it trades differently and more symbols. The Scalping system now uses market orders instead of stop orders. It is 100% Metatrader 5 compatible. Fusion Trader v4 is a multi symbol EA, For now, it will tra
TMA Currency Meter is the ultimate currency meter. Based on the Triangular Moving Average of all available symbols, this indicator shows which currencies are strong, strengthening, weak or weakening. Experienced as well as novice traders will see the strong and weak currencies in the blink of an eye, and know which trade possibilities to explore further. TMA Currency Meter is a true Multi Timeframe indicator. It is easy to show the currency strengths for a higher timeframe than the chart timefra
Momentum Horizon
Paul Geirnaerdt
Momentum Horizon is a fully automated trading system built for MetaTrader 5, designed to capture high-probability breakout moves in the Gold market. It focuses on two of the most time-tested price action patterns: the daily breakout of yesterday’s high/low, and the powerful 'London session' breakout, where volatility often surges as global markets overlap. By combining these setups, the system seeks to position itself right where momentum is most likely to accelerate. The EA can operate with pre
Filter:
Aravind Kolanupaka
10089
Aravind Kolanupaka 2019.04.12 04:12 
 

User didn't leave any comment to the rating

raiinzen
727
raiinzen 2019.01.28 13:32 
 

User didn't leave any comment to the rating

Артем Козлов
202
Артем Козлов 2017.12.18 10:21 
 

User didn't leave any comment to the rating

khanet Kitpawongchanok
408
khanet Kitpawongchanok 2015.06.18 13:34 
 

User didn't leave any comment to the rating

wuthisant
26
wuthisant 2015.06.03 20:51 
 

User didn't leave any comment to the rating

Rabbitpips
299
Rabbitpips 2015.04.19 00:54 
 

User didn't leave any comment to the rating

shkipperr
297
shkipperr 2015.03.10 17:58 
 

User didn't leave any comment to the rating

Danilo Telic
47
Danilo Telic 2015.03.10 10:01 
 

User didn't leave any comment to the rating

Reply to review