Pivots
- Indikatoren
-
Paul Geirnaerdt
 For most of my years I have been a software developer, analyzing and coding complex systems such as large scale risk analysis and management projects.
This was a great advantage when I started to develop indicators and EA's for Metatrader in 2007. - Version: 1.1
- Aktualisiert: 17 November 2021
- Aktivierungen: 8
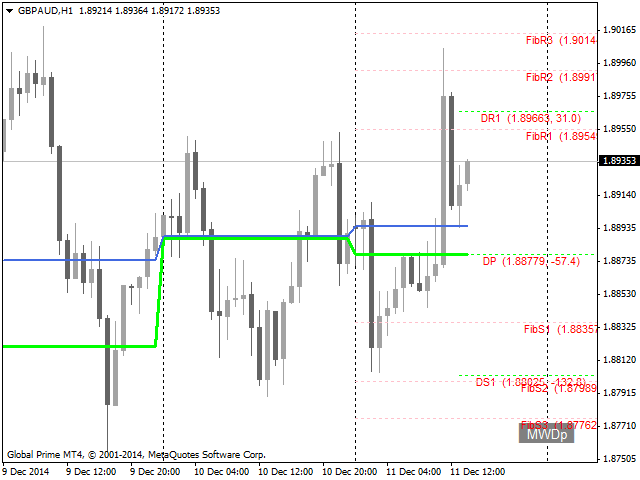
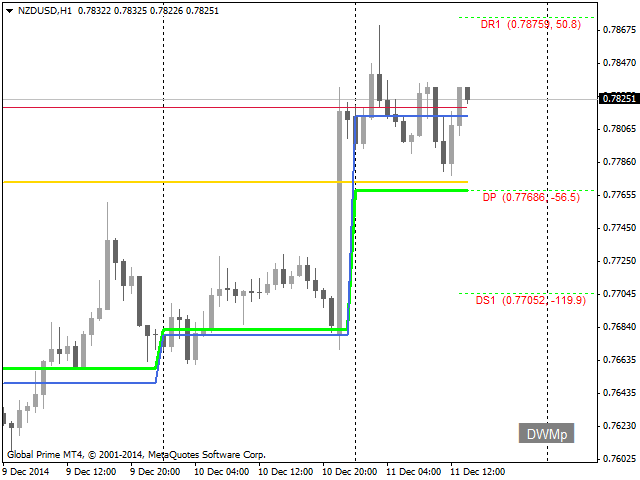
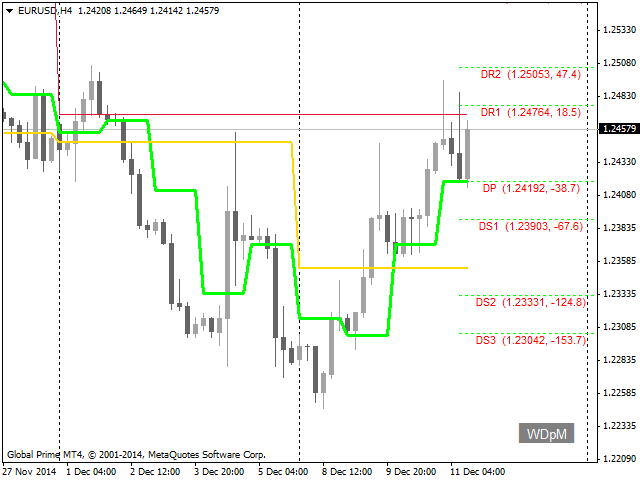
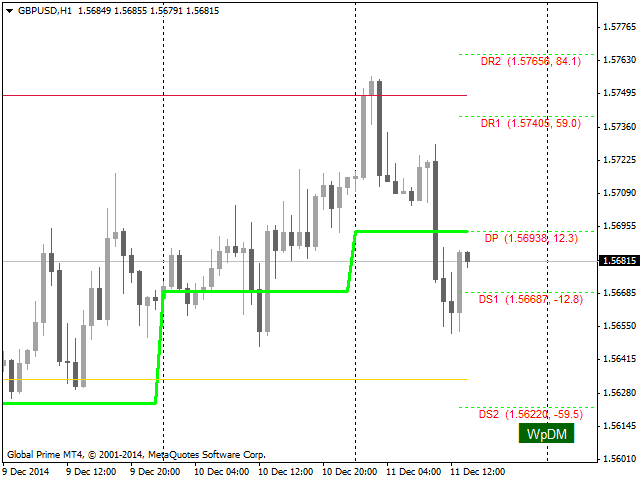
Pivots ist ein Indikator, der Pivots für relevante Zeitrahmen anzeigt. Neben den Pivots kann der Indikator auch die offene Daly-Linie, die Widerstands- und Unterstützungsniveaus, die ADR-Fibonacci-Niveaus und die Reihenfolge der Pivots anzeigen.
Pivots enthält einen intelligenten Algorithmus zur Eliminierung von Sonntagskerzen, allerdings nur, wenn Ihr Broker diese anbietet.
Pivots sind wichtige Kursniveaus, die als Unterstützung, Widerstand oder Ausbruchsniveau dienen können
Einstellungen
- textFont - Schriftart, die für die Beschriftungen verwendet werden soll.
- textSize - Schriftgröße.
- textColor - Sie wissen, was zu tun ist.
- maxBars - die Anzahl der Kerzen, für die Pivots Informationen anzeigt, bei Bedarf verringern.
- addSundayToMonday - auf true gesetzt, um Sonntagskerzen, falls vorhanden, zur folgenden Montagskerze hinzuzufügen, nur für D1 nützlich.
- showDailyLine - wird auf true gesetzt, um den täglichen Pivot anzuzeigen.
- showDailyOpenLine - wird auf true gesetzt, um die tägliche Eröffnungslinie anzuzeigen.
- showWeekLine - wird auf true gesetzt, um den wöchentlichen Pivot anzuzeigen.
- showMonthLine - wird auf true gesetzt, um den monatlichen Pivot anzuzeigen.
- showDailySR - auf true gesetzt, um die täglichen Pivot Unterstützungs- und Widerstandslinien anzuzeigen.
- showDailyOpenSR - wird auf true gesetzt, um die täglichen offenen Unterstützungs- und Widerstandslinien anzuzeigen.
- showWeeklySR - wird auf true gesetzt, um die wöchentlichen Pivot-Unterstützungs- und Widerstandslinien anzuzeigen.
- showMonthlySR - wird auf true gesetzt, um die monatlichen Pivot-Unterstützungs- und Widerstandslinien anzuzeigen.
- showSRAtOwnBar - wird auf true gesetzt, um die Unterstützungs- und Widerstandslinien am Ende der Pivot-Kerze zu starten.
- showFibonacci - wird auf true gesetzt, um die Fibonacci-Levels basierend auf dem täglichen ADR anzuzeigen.
- includeDistance - setzen Sie diese Option auf true, um den Abstand zum Preis in die Beschriftung aufzunehmen.
- includeValue - wird auf true gesetzt, um den Wert des Levels in die Beschriftung aufzunehmen.
- shiftText... - Anzahl der Pixel, um die Beschriftungen nach rechts zu verschieben.
- showOrder - wird auf true gesetzt, um die Reihenfolge der Hauptdrehpunkte (D, W, M) und des Preises (P) anzuzeigen.
- showOrderBackground - wird auf true gesetzt, um einen Hintergrund für die Reihenfolge anzuzeigen.
- orderX - X-Anzahl der Pixel der Order von der rechten unteren Ecke.
- orderY - Y-Anzahl der Pixel der Bestellung von der unteren rechten Ecke.
- style... - wählen Sie Ihren bevorzugten Linienstil.
- width... - Linienbreiten festlegen.
- Farbe... - Wählen Sie Ihre bevorzugte Farbe.
Im Zweifelsfall sollten Sie mit den Standardoptionen beginnen.
Lose Enden
Wenn Sie auf Probleme stoßen, versuchen Sie, eine Historie für alle Symbole zu laden, bevor Sie Pivots auf Ihr Diagramm anwenden.
Zögern Sie nicht, mich zu kontaktieren. Lassen Sie mich wissen, was Sie von Pivots halten. Nur mit Ihrer Hilfe kann ich bessere Tools für MT4 entwickeln.


Der Benutzer hat keinen Kommentar hinterlassen