MonsterDash Harmonic Indicator

4.54

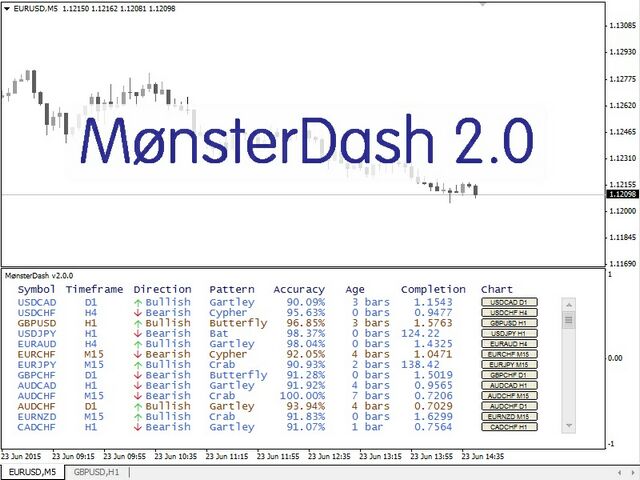
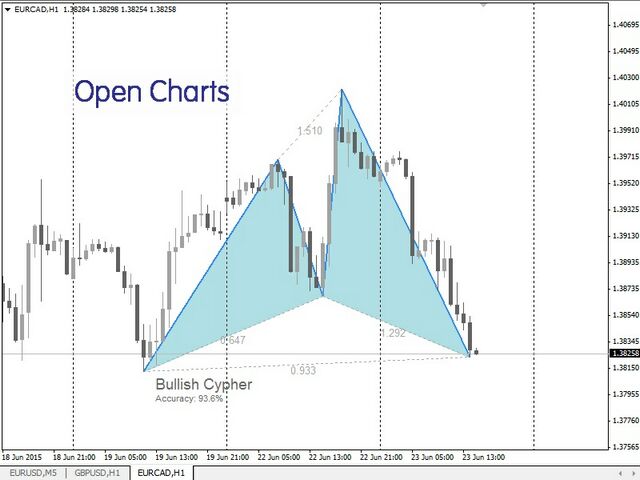
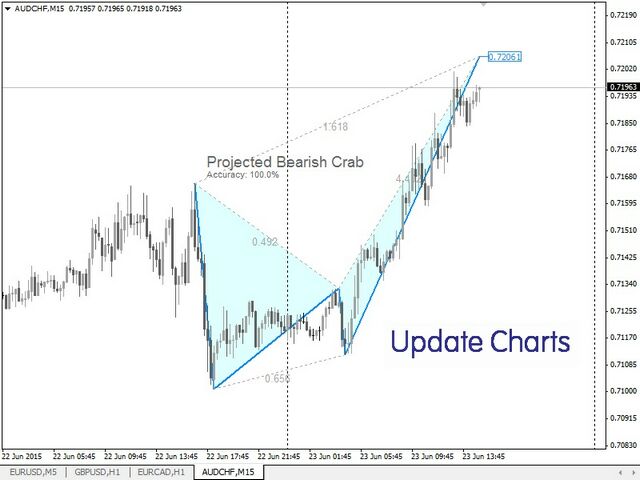
MonsterDash Harmonic Indicator is a harmonic pattern dashboard. It recognizes all major patterns. MonsterDash is a dashboard that displays all detected patterns for all symbols and (almost) all timeframes in sortable and scrollable format. Users can add their own user defined patterns. MonsterDash can open and update charts with the pattern found.


Settings

MonsterDash's default settings are good enough most of the time. Feel free to fine tune them to your needs. The color settings are for those who 'gone to the dark side' (black backgrounds), they are less suitable for white backgrounds.

  • Check pattern every - Set to the frequency to detect and refresh the patterns. This is independent of the chart timeframe.
  • Symbols to exclude - This is a comma delimited list of symbols to exclude from pattern recognition. MonsterDash looks at all symbols in the Market Watch window.
  • Minimum AccuracyPercent - Minimum accuracy percentage for pattern recognition.
  • Price Must Touch All Minimum Ratios - Set to true to force MonsterDash to touch all minimum ratios, set this if you want the price to touch all minimum ratios and provide even better patterns.
  • Show Pattern Projections - Show/hide projected patterns.
  • Check M1, M5, M15, M30, H1, H4, D1, W1, MN1 - Set to true to include the timeframe in the harmonic pattern recognition.
  • Offline timeframes, comma separated - Set to a comma separated list of all offline timeframes (e.g. 2,3). Useful for Renko of Median charts
  • Show Command Column - Set to true to show an column with a button to open a chart.
  • Chart Template - Set to the name of the template (include '.tpl') to apply to the chart to open.
  • Show Alerts - Set to false to disable all alerts.
  • Show Screen Alerts - Set to true to show screen alerts.
  • Email Alerts - Set to true to email alerts.
  • Push Alert Notifications - Set to true to push alerts.
  • Show 'PatternName' Patterns - Show/hide specific pattern.
  • Sort Patterns By - Column to sort the information grid to (one of: NoSort, Pattern, Symbol, Timeframe, Direction, Accuracy, Age, Completion, IsProjected).
  • Sort Direction - Ascending of Descending.
  • monospacedFont - Pick your favorite font, monospaced is best.
  • fontSize - Font size.
  • Show Pattern Label - Set to true to show the pattern name on opened charts.
  • Show Pattern Accuracy - Set to true to show the pattern accuracy label on opened charts.
  • Show Initialization User Patterns? - set to true to show the results of the intialization of the user patterns in the Experts tab.
  • Color Palette - Pick Color Palette for 'Dark' or 'Light' Backgrounds.
  • Colo(u)rs - You know what to do.
  • Zigzag parameters - set ZigZag parameters.


User Patterns

Users can add their own patterns to MonsterDash. Just modify the Monster_UserPatterns.csv to include your patterns. The .csv file can be found in the files folder of the User Data Directory. A sample pattern is already included in the file.


Offline Charts

MonsterDash will read and detect offline charts. Renko or Median charts among others can be used this way. However, offline charts cannot be automatically opened through MonsterDash to show the pattern found, this is a limitation of MetaTrader 4.


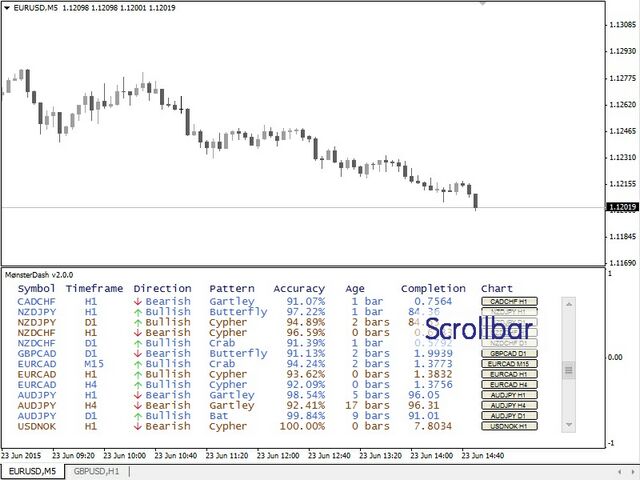
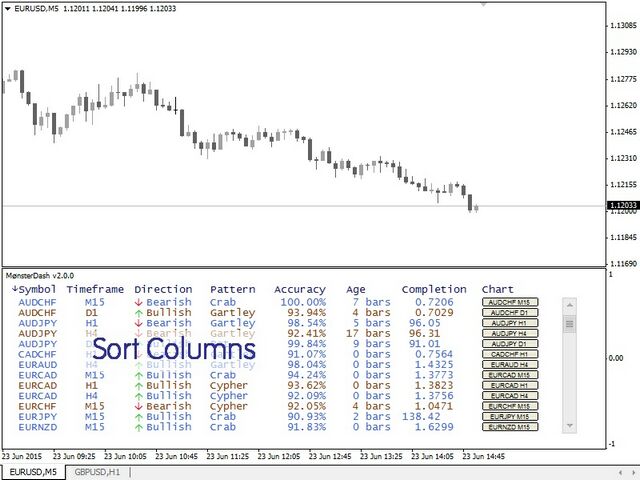
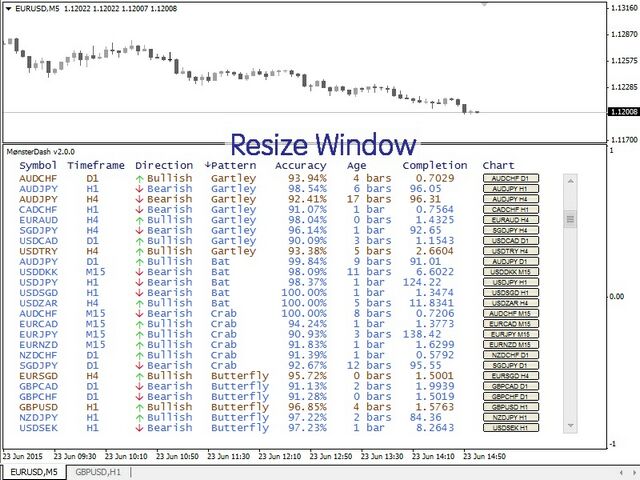
Sorting, Scrolling, Opening Charts

The patterns can be sorted on all columns. Click the column headers to sort the grid to the information in the column, click again to reverse the sort. The grid containing all patterns can be scrolled using a standard scrollbar. Clicking the button in the last column of the grid will open or update a chart containing the pattern found.


Full Description

Read this blog post for more information on MonsterDash.

Reviews 32
Suvashish Halder
167892
Suvashish Halder 2021.10.21 12:37 
 

It works and I become a fan of Harmonic Patterns 😍 Very good indicator. Thank you, Paul 🙂

Gursimran Singh Bharaj
114
Gursimran Singh Bharaj 2018.06.22 11:43 
 

I have rented this indicator. I had already bought the monster harmonic indicator a long time back. I missed a dashboard where multiple patterns are detected on a time frame. this does the job well. I am giving it 5 stars for the way it performs.

don't expect that if a pattern forms you just open a trade. you have to take other factors into account.

reo4ua
157
reo4ua 2018.03.29 22:43 
 

Paul,

What a fantastic time saver you have here. Honestly - one could trade using only your indicator and key levels and make all the money they want. Thank you for sharing this with us. Two requests if you would consider them for the next version: the ability to remove a signal from the list to keep it as clutter free as possible (for instance if you wake up to patterns where the optimal trade entry level has already come and gone - no sense in seeing it anymore) and a free-form notes column to the right of the "chart" button. Since I trade mainly with weekly pivots, noting point "d"'s proximity to the closest weekly fib pivot would be nice too.

Thanks again for what you do for the MT community!

Recommended products
Alpha Trend sign has been a very popular trading tool in our company for a long time. It can verify our trading system and clearly indicate trading signals, and the signals will not drift. Main functions: Based on the market display of active areas, indicators can be used to intuitively determine whether the current market trend belongs to a trend market or a volatile market. And enter the market according to the indicator arrows, with green arrows indicating buy and red arrows indicating se
Day Pattern
Oleksandr Martsynyshen
Description: - D ay Pattern - an indicator that helps to identify patterns of price changes for the development of trading algorithms and strategies. For whom this tool? - For developers of trading strategies and algorithms. - Medium- and long-term traders. Time frames H1-W1. Features of the indicator: - There is a function of exporting indicator values to a file of the csv format. - Using the information panel, you can conduct an express analysis of trading tool. - The indicator is sui
The indicator detects and displays М. Gartley's Butterfly pattern. The pattern is plotted by the extreme values of the ZigZag indicator (included in the resources, no need to install). After detecting the pattern, the indicator notifies of that by the pop-up window, a mobile notification and an email. The pattern and wave parameters are displayed on the screenshots. The default parameters are used for demonstration purposes only in order to increase the amount of detected patterns. Parameters z
ZigZag Professional
Dmitriy Kashevich
5 (1)
the zigzag indicator draws lines on the chart from the highest point to the lowest There are built-in fibonacci levels built-in sound alert the indicator highlights trends on small timeframes with a thin line and trends highlights with a coarse line Fibonacci levels can be turned on and off in the settings settings are very simple and clear the same sound alert can be turned on and off, you can change the colors of the lines.
Harmonic based indicator. Recognizes several patterns: ABCD, 3 Drives, Gartley, Butterfly, Bat, Atlternative Bat, Deep Bat, Crab, Deep Crab, Cypher and Shark. Able to set SL and three levels of TP based on Fibonacci Levels. Three types of alerts are available: PopUp, Email and Push. Trade advices on chart and stats also printed for visual estimation. All patterns are formed by not repainting ZigZiag. Parameters for it are classic: InpDepth, InpDeviation,InpBackstep. MinComplete means the level
The indicator detects and displays 3 Drives harmonic pattern (see the screenshot). The pattern is plotted by the extreme values of the ZigZag indicator (included in the resources, no need to install). After detecting the pattern, the indicator notifies of that by a pop-up window, a mobile notification and an email. The indicator highlights the process of the pattern formation and not just the complete pattern. In the former case, it is displayed in the contour triangles. After the pattern is com
The indicator detects and displays Shark harmonic pattern (see the screenshot). The pattern is plotted by the extreme values of the ZigZag indicator (included in the resources, no need to install). After detecting the pattern, the indicator notifies of that by a pop-up window, a mobile notification and an email. The indicator highlights the process of the pattern formation and not just the complete pattern. In the former case, it is displayed in the contour triangles. After the pattern is comple
Price Magnet — Price Density and Attraction Levels Indicator Price Magnet is a professional analytical tool designed to identify key support and resistance levels based on statistical Price Density. The indicator analyzes a specified historical period and detects price levels where the market spent the most time. These zones act as “magnets,” attracting price action or forming a structural base for potential reversals. Unlike traditional Volume Profile tools, Price Magnet focuses on price-time d
Pipsurfer
Clinton Keenan Obinna Butler
Overview: With so much noise and distraction in the markets I wanted to create clarity for traders to have a simple, efficient, and fun trading experience. This is why I created Pipsurfer. Pipsurfer is an trend following indicator that visually shows you important Institutional Smart Money levels in the market and helps you to trace Market Structure in the markets. Most traders find it difficult to visually see trading elements such as trend, structure and momentum which are key for understandin
Gartley Projection D
Oleksandr Medviediev
3.71 (7)
The indicator identifies the harmonic patterns (XABCD) according to developments of H.M.Gartley ( "Profits in the Stock Market" , 1935г). It projects D-point as a point in the perspective projection (specify ProjectionD_Mode = true in the settings). Does not redraw. When a bar of the working timeframe closes, if the identified pattern point has not moved during Patterns_Fractal_Bars bars, an arrow appears on the chart (in the direction of the expected price movement). From this moment on, the ar
Introduction to X3 Chart Pattern Scanner X3 Cherart Pattern Scanner is the non-repainting and non-lagging indicator detecting X3 chart patterns including Harmonic pattern, Elliott Wave pattern, X3 patterns, and Japanese Candlestick patterns. Historical patterns match with signal patterns. Hence, you can readily develop the solid trading strategy in your chart. More importantly, this superb pattern scanner can detect the optimal pattern of its kind. In addition, you can switch on and off individu
Auto Fibo Pro m
DMITRII GRIDASOV
"Auto FIBO Pro"   Crypto_Forex  indicator  - is great auxiliary tool in trading! Indicator automatically calculate and place on chart Fibo levels and local trend lines (red color). Fibonacci levels indicate key areas where price can reverse. Most important levels are 23.6%, 38.2%, 50% and 61.8%. You can use it   for reversal scalping  or for zone grid trading. There are plenty of opportunities to  improve your current system using Auto FIBO Pro indicator as well. It has Info Spread Swap Displa
PZ Harmonacci Patterns
PZ TRADING SLU
3.17 (6)
Trade smarter, not harder: Empower your trading with Harmonacci Patterns This is arguably the most complete harmonic price formation auto-recognition indicator you can find for the MetaTrader Platform. It detects 19 different patterns, takes fibonacci projections as seriously as you do, displays the Potential Reversal Zone (PRZ) and finds suitable stop-loss and take-profit levels. [ Installation Guide | Update Guide | Troubleshooting | FAQ | All Products   | Get Help ] It detects 19 differen
Upgrade your charts instantly. Smart Round Levels draws powerful .00 and .50 round-number zones automatically on  any forex pair — including  JPY pairs  like USDJPY — and features a dynamic  live price tracker  that follows price in real time. Features: • Automatic round-number detection (.00 & .50) • Auto-adjusts for JPY and non-JPY pairs • Perfect precision with customizable spacing & scale • Fully customizable colors, line widths, font sizes • Real-time yellow price label tha
The CCI Divergence is a reasonably useful indicator in itself, but it is even more effective when used with divergence pattern trading. The CCI Divergence indicator signal is one of the most potent signals among the indicators that exist in the market. Here is new version for Divergence Indicator using CCI method, with more improvements. Divergences indicate a potential investment point because the directional moment does not confirm the price. A bullish divergence occurs when the underlying va
The indicator builds current quotes, which can be compared with historical ones and on this basis make a price movement forecast. The indicator has a text field for quick navigation to the desired date. Options: Symbol - selection of the symbol that the indicator will display; SymbolPeriod - selection of the period from which the indicator will take data; IndicatorColor - indicator color; Inverse - true reverses quotes, false - original view; Next are the settings of the text field, in w
Trend Ray
Andriy Sydoruk
The indicator shows the potential trend direction by cyclical-wave dependence. Thus, all the rays of the intersection will be optimal rays, in the direction of which the price is expected to move, taking into account the indicator period. Rays can be used as a direction for potential market movement. But we must not forget that the approach must be comprehensive, the indicator signals require additional information to enter the market.
The   Fibonacci Confluence Toolkit   is a technical analysis tool designed to help traders identify potential price reversal zones by combining key market signals and patterns. It highlights areas of interest where significant price action or reactions are anticipated, automatically applies Fibonacci retracement levels to outline potential pullback zones, and detects engulfing candle patterns. Its unique strength lies in its reliance solely on price patterns, eliminating the need for user-define
Gold Phoenix
Yaroslav Varankin
The perfect tool for Scalng in the Forex markets You can trade both from signal to signal and using take profit  The algorithm does not use Zigzag!  No redrawing!  This is a channel instrument that uses a moving average as a filter. Moving Average  There are 2 parameters for the settings Ma Period = 5 period Moving Average  Channel 1.0 distance of channel lines from the chart Price Signal Filter - calculation of signal opening and filter There is a complete set of Alert There is a multi-timefram
1. Going offline means that the market is in a wait-and-see state. In this situation, it is common to choose to wait and see rather than taking immediate action to wait for more market information or trend confirmation in order to make wiser decisions. 2.When there is a trend of going up and down, the market shows a bullish signal. At this point, investors may consider entering the market in hopes of future price increases and profits. 3.When the market situation is online, it will once again t
Happy Scalping Indicator
Leandro Bernardez Camero
This indicator was designed for aggressive scalping and quick entries in binary options , generating signals on every candle , so you can know exactly what is happening at all times. Join the Happy Scalping channel: MQL5 It does not repaint : the current candle's signal is generated in REAL TIME , which means it may change while the candle is still forming, depending on whether the price rises or falls compared to the previous candle's close. But once the candle closes , the signal color becom
Reversal Prices is an indicator that has a fairly powerful and effective mechanism for adapting to changing market conditions. Reversal Prices - the new word in trend detection! With the development of information technology and a large number of participants, financial markets are less and less amenable to analysis by outdated indicators. Conventional technical analysis tools, such as the Moving Average or Stochastic, in their pure form are not able to determine the direction of the trend or it
Enigmera
Ivan Stefanov
5 (8)
ENIGMERA: The core of the market (This is a manual indicator and contains features that may not supported by the MetaTrader current testing environment) Introduction This indicator and trading system is a remarkable approach to the financial markets . ENIGMERA uses the fractal cycles to accurately calculate support and resistance levels. It shows the authentic accumulation phase and gives direction and targets.  A system that works whether we are in a trend or a correction.   How It Works Most
The indicator plots a fan of trend lines (after clicking on a certain candle), similar to the classic Gann angles. A feature of the indicator is that it plots angles not only on a fixed scale, but also uses the average statistical price of a certain number of bars (to choose from). The indicator has two ways to calculate the average price for corners (optional): 1) calculation of the average price movement (for a certain number of bars) from High to Low; 2) calculation of the average price movem
Last 50 Pips
Martin Alejandro Bamonte
The Last 50 Pips indicator is designed to quickly identify buying and selling opportunities based on recent price behavior. It measures price changes in the last candles to highlight in yellow moments when the price may be changing direction. Buy signal: You should open a BUY position when the indicator changes from RED to YELLOW , suggesting a change from a downtrend to an uptrend. Please refer to the images to see how easy it is. Sell signal: You should open a SELL position when the indicato
TripleFusion
Rami Fatmi Fernandez
It is a technical indicator that combines three of the most popular oscillators in technical analysis: MACD, RSI, and Stochastic. The integrated advanced formula combines their signals to provide a single, clear and effective line, eliminating noise and helping you make quick, visual decisions. What makes this indicator unique? Integrates the difference between the MACD, RSI, and Stochastic into a single combined formula. It displays the result in a separate window, like the ATR, making i
Очень точный индикатор, с  его помощью очень легко определять барные паттерны. Это очередная разновидность ЗигЗага, за исключением, он не рисует текущую линию, которая может перерисоваться,если нарисовал конечную точку, по закрытому бару, то больше ее не изменяет - это означает смену направления и следующая точка будет другого цвета. Может быть применен как для определения основного движения, при использовании увеличенных параметров, так и непосредственно для входа с минимальным риском. Очень х
STRUCTURAL TREND LINES - MT4 Indicator Simple indicator that automatically draws trend lines based on market structure. Features: - 3 degrees of structure detection (short, medium, long term) - Configurable swing strength for each degree - Single color per degree for clean visualization - Adjustable number of lines per degree - Customizable colors and line widths How it works: The indicator identifies swing highs and lows based on the strength parameter, then connects these points to create t
Trend PA
Mikhail Nazarenko
5 (3)
The Trend PA indicator uses   Price Action   and its own filtering algorithm to determine the trend. This approach helps to accurately determine entry points and the current trend on any timeframe. The indicator uses its own algorithm for analyzing price changes and Price Action. Which gives you the advantage of recognizing, without delay, a new nascent trend with fewer false positives. Trend filtering conditions can be selected in the settings individually for your trading style. The indicator
Gioteen Volatility Index (GVI)   - your ultimate solution to overcoming market unpredictability and maximizing trading opportunities. This revolutionary indicator helps you in lowering your losing trades due to choppy market movements. The GVI is designed to measure market volatility, providing you with valuable insights to identify the most favorable trading prospects. Its intuitive interface consists of a dynamic red line representing the volatility index, accompanied by blue line that indicat
Buyers of this product also purchase
Ultimate Sniper Dashboard
Hispraise Chinedum Abraham
4.82 (22)
Currently on massive July Discount! Prices will increase in the future! Read description below! Once you purchase, send a message to my inbox for manual and starter kit. Best Entry System for Ultimate Sniper Dashboard: ULTIMATE DYNAMIC LEVELS. (Please Check my products) The Ultimate Sniper Dashboard ONLY works on live markets due to MT4 multicurrency testing limits. Introducing the Ultimate-Sniper Dashboard! Our very best which contains both HA-Sniper, MA-Sniper. and many special modes. The Ul
Super Signal – Skyblade Edition Professional No-Repaint / No-Lag Trend Signal System with Exceptional Win Rate | For MT4 / MT5 It works best on lower timeframes, such as 1-minute, 5-minute, and 15-minute charts. Core Features: Super Signal – Skyblade Edition is a smart signal system designed specifically for trend trading. It applies a multi-layered confirmation mechanism to detect only strong, directional moves supported by real momentum. This system does not attempt to predict tops or bottoms
Introducing ON Trade Waves Patterns Harmonic Elliot Wolfe, an advanced indicator designed to detect various market patterns using both manual and automated methods. Here's how it works: Harmonic Patterns: This indicator can identify harmonic patterns that appear on your chart. These patterns are essential for traders practicing harmonic trading theory, as popularized by Scott Carney's book "Harmonic Trading vol 1&2." Whether you draw them manually or rely on automated detection, ON Trade Waves
The " Dynamic Scalper System " indicator is designed for the scalping method of trading within trend waves. Tested on major currency pairs and gold, compatibility with other trading instruments is possible. Provides signals for short-term opening of positions along the trend with additional price movement support. The principle of the indicator. Large arrows determine the trend direction. An algorithm for generating signals for scalping in the form of small arrows operates within trend waves.
BTMM State Engine Pro is a MetaTrader 4 indicator for traders who use the Beat The Market Maker approach: Asian session context, kill zone timing, level progression, peak formation detection, and a multi-pair scanner from a single chart. It combines cycle state logic with a built-in scanner dashboard so you do not need the same tool on many charts at once. What it does Draws the Asian session range; session times can follow broker server offset or be set in inputs. Tracks level progression (L
Linear Trend Predictor - A trend indicator that combines entry points and direction support lines. It works on the principle of breaking through the High/Low price channel. The indicator algorithm filters market noise, takes into account volatility and market dynamics. Indicator capabilities Using smoothing methods, it shows the market trend and entry points for opening BUY or SELL orders. Suitable for determining short-term and long-term market movements by analyzing charts on any timeframes.
GOLD Impulse with Alert
Bernhard Schweigert
4.67 (12)
This indicator is a super combination of our 2 products  Advanced Currency IMPULSE with ALERT  and  Currency Strength Exotics . It works for all time frames and shows graphically impulse of strength or weakness for the 8 main currencies plus one Symbol! This Indicator is specialized to show currency strength acceleration for any symbols like Gold, Exotic Pairs, Commodities, Indexes or Futures. Is first of its kind, any symbol can be added to the 9th line to show  true currency strength accelerat
Trading Special – 40% OFF Best Solution for any Newbie or Expert Trader! This dashboard software is working on 28 currency pairs plus one. It is based on 2 of our main indicators (Advanced Currency Strength 28 and Advanced Currency Impulse). It gives a great overview of the entire Forex market plus Gold or 1 indices. It shows Advanced Currency Strength values, currency speed of movement and signals for 28 Forex pairs in all (9) timeframes. Imagine how your trading will improve when you can watch
Miraculous Indicator – 100% Non-Repaint Forex and Binary Tool Based on Gann Square of Nine This video introduces the Miraculous Indicator , a highly accurate and powerful trading tool specifically developed for Forex and Binary Options traders. What makes this indicator unique is its foundation on the legendary Gann Square of Nine and Gann's Law of Vibration , making it one of the most precise forecasting tools available in modern trading. The Miraculous Indicator is fully non-repaint, meaning t
First of all Its worth emphasizing here that this Trading Tool is Non-Repainting Non-Redrawing and Non-Lagging Indicator Which makes it ideal for professional trading . [Online course] ,   and   [manual] The Smart Price Action Concepts Indicator is a very powerful tool for both new and experienced traders . It packs more than 20 useful indicators into one combining advanced trading ideas like Inner Circle Trader Analysis and Smart Money Concepts Trading Strategies . This indicator focuses on Sm
Technical indicator that structures charts and identifies cyclical price movements. Can work on any charts. Several types of alerts. There are additional arrows on the chart itself. Without redrawing on history, works on closing a candle. Recommended TF from M5 and higher. Easy to use and configure parameters. When using 2 indicators with different parameters, you can use without other indicators. Has 2 input parameters Cyclicality and Signal duration These 2 parameters work with the processin
Crosskalp1
Mikhail Bilan
Добрый День уважаемые трейдеры!  Вашему вниманию индикатор созданный и работающий на базе трендовика ADX,  для торговли на смене направления движения который учитывает коррекцию и даёт возможность на ней заработать.  Применяю этот индикатор для скальпинга. Рекомендую таймфреймы от 15 ти минутного(М15) до часового (Н1) периодов.  Красный кружок сигнал на продажу- Sell) Зелёный кружок  сигнал на покупку Buy) Чем меньше ваш таймфрейм тем меньше пунктов вы зарабатываете.   Важно выставлять стопы! !В
NAM Order Blocks
NAM TECH GROUP, CORP.
3.67 (3)
MT4 Multi-timeframe Order Blocks detection indicator. Features - Fully customizable on chart control panel, provides complete interaction. - Hide and show control panel wherever you want. - Detect OBs on multiple timeframes. - Select OBs quantity to display. - Different OBs user interface. - Different filters on OBs. - OB proximity alert. - ADR High and Low lines. - Notification service (Screen alerts | Push notifications). Summary Order block is a market behavior that indicates order collection
Quantum Breakout Indicator PRO
Bogdan Ion Puscasu
4.96 (26)
Introducing   Quantum Breakout PRO , the groundbreaking MQL5 Indicator that's transforming the way you trade Breakout Zones! Developed by a team of experienced traders with trading experience of over 13 years, Quantum Breakout PRO is designed to propel your trading journey to new heights with its innovative and dynamic breakout zone strategy. Quantum Breakout Indicator will give you signal arrows on breakout zones with 5 profit target zones and stop loss suggestion based on the breakout box. I
Dynamic Forex28 Navigator
Bernhard Schweigert
4.43 (7)
Specials Discount now. The Next Generation Forex Trading Tool. Dynamic Forex28 Navigator is the evolution of our long-time, popular indicators, combining the power of three into one: Advanced Currency Strength28 Indicator (695 reviews) + Advanced Currency IMPULSE with ALERT (520 reviews) + CS28 Combo Signals (recent Bonus) Details about the indicator  https://www.mql5.com/en/blogs/post/758844 What Does The Next-Generation Strength Indicator Offer? Everything you loved about the originals, now
The Super Arrow Indicator provides non-repainting buy and sell signals with exceptional accuracy. Key Features No repainting – confirmed signals remain fixed Clear visual arrows: green for buy, red for sell Real-time alerts via pop-up, sound, and optional email Clean chart view with no unnecessary clutter Works on all markets: Forex, gold, oil, indices, crypto Adjustable Parameters TimeFrame Default: "current time frame" Function: Sets the time frame for indicator calculation Options: Can be set
Precautions for subscribing to indicator This indicator only supports the computer version of MT4 Does not support MT5, mobile phones, tablets The indicator only shows the day's entry arrow The previous history arrow will not be displayed (Live broadcast is for demonstration) The indicator is a trading aid Is not a EA automatic trading No copy trading function The indicator only indicates the entry position No exit (target profit)  The entry stop loss point is set at 30-50 PIPS Or the front hi
MTF Supply Demand Zones
Georgios Kalomoiropoulos
4.82 (22)
Next Generation Of Automated Supply And Demand Zones. New and Innovative Algorithm that Works At Any Chart. All Zones Are Being Created Dynamically According To Price Action Of The Market. AMAZING OFFER --> Activations from 5 to 20 for "MTF Supply Demand Zones" and "Automated Trendlines" If you get the MTF Supply Demand Zones you can join the " Trade Like Me " Video Series. It contains 14 Live Sessions where  i am placing trades on Forex, Stocks, Indices and Metals. You will be able to see ho
Meravith
Ivan Stefanov
5 (3)
Market makers' tool. Meravith will: Analyze all timeframes and display the current trend in force. Highlight liquidity zones (volume equilibrium) where bullish and bearish volumes are equal. Display all liquidity levels across different timeframes directly on your chart. Generate and present text-based market analysis for your reference. Calculate targets, support levels, and stop-loss points based on the current trend. Compute the risk/reward ratio for your trades. Determine position size accor
Introducing the Delta Volume Profile Indicator - Unleash the Power of Institutional Precision!  Technical Indicator: Are you ready to trade like the pros? The Delta Volume Profile Indicator is no ordinary tool. It’s a high-precision, cutting-edge indicator that puts the power of institutional-grade trading in your hands. This unique indicator analyses delta volume distribution in real-time, revealing the market's hidden buy/sell imbalances that the biggest financial institutions rely on to antic
GoldRush Trend Arrow Signal V1.6 The GoldRush Trend Arrow Signal indicator V1.6 continues to provide precise, real-time trend analysis tailored for high-speed, short-term scalpers in XAU/USD , but it now has additional features and improved efficiency and reliability. Built specifically for the 1-minute time frame, this tool displays directional arrows for clear entry points, allowing scalpers to navigate volatile market conditions with confidence. The indicator consists of PRIMARY and SECONDARY
Pulse Scalping Line - an indicator for identifying potential pivot points. Based on this indicator, you can build an effective Martingale system. According to our statistics, the indicator gives a maximum of 4 erroneous pivot points in a series. On average, these are 2 pivot points. That is, the indicator shows a reversal, it is erroneous. This means that the second signal of the indicator will be highly accurate. Based on this information, you can build a trading system based on the Martingale
El indicador "MR BEAST ALERTAS DE LIQUIDEZ" es una herramienta avanzada diseñada para proporcionar señales y alertas sobre la liquidez del mercado basándose en una serie de indicadores técnicos y análisis de tendencias. Ideal para traders que buscan oportunidades de trading en función de la dinámica de precios y los niveles de volatilidad, este indicador ofrece una visualización clara y detallada en la ventana del gráfico de MetaTrader. Características Principales: Canal ATR Adaptativo: Calcula
Adaptive Volatility Range [AVR] is a powerful tool for identifying key trend reversal points. AVR accurately reflects the Average True Range (ATR) of volatility, taking into account the Volume-Weighted Average Price (VWAP). The indicator adapts to any market volatility by calculating the average volatility over a specific period, ensuring a stable rate of profitable trades. You receive not just an indicator but a professional automated trading system , AVR-EA . Advantages: 100% No Repaint –
Binary Volume Edge – Martingale Stats  Binary options indicator with live pre-signals and full martingale stats Binary Volume Edge – Martingale Stats is a professional tool that combines powerful signal filtering, smart martingale analysis and a unique early alert system. ** Binary Volume Edge – Martingale Stats indicator analysis The indicator is designed for trading binary options on the MetaTrader 4 platform. Its logic is based on a combination of volume analysis, bull/bear strength ind
Introducing the F-16 Plane Indicator, a cutting-edge MT4 tool designed to revolutionize your trading experience. Inspired by the unmatched speed and precision of the F-16 fighter jet, this indicator combines advanced algorithms and state-of-the-art technology to deliver unparalleled performance in the financial markets. With the F-16 Plane Indicator, you'll soar above the competition as it provides real-time analysis and generates highly accurate trading signals. Its dynamic features are engin
No Repaint Bext
Andrey Kozak
1 (1)
No Repaint Bext is a ready-made trading system. Shows when to open and when to close trades, as well as in which direction. Every time a green arrow appears, you need to open a buy trade. Close all buy trades when a red arrow appears. The same goes for the opposite direction, every time a red arrow appears, open sell trades and close them all when a green arrow appears. We use the M5 timeframe for trading. You can trade on any cozy pair. This indicator does not repaint and practically does not
Presenting one-of-a-kind Gann Indicator for XAUUSD IQ Gold Gann Levels is a non-repainting, precision tool designed exclusively for XAUUSD/Gold intraday trading. It uses W.D. Gann’s square root method to plot real-time support and resistance levels, helping traders spot high-probability entries with confidence and clarity. William Delbert Gann (W.D. Gann) was an exceptional market analyst whose trading technique was based on a complex blend of mathematics, geometry, astrology, and ancient calcul
This indicator is an indicator for automatic wave analysis that is perfect for practical trading! Case... Note:   I am not used to the Western name for wave classification. Influenced by the naming habit of Chaos Theory (Chanzhongshuochan), I named the basic wave as   pen   , the secondary wave band as   segment   , and the segment with trend direction   as main trend segment   (this naming method will be used in future notes, let me tell you in advance), but the algorithm is not closely relat
Ultimate Market Master Trend Master the Market’s Direction with Precision The Ultimate Market Master Trend indicator is an all-in-one market sentiment analyser designed for traders who demand clarity, accuracy, and confidence in every move. It combines smart trend detection, multi-timeframe stochastic momentum, and dynamic visual cues to help you identify high-probability entries and exits with ease.  Key Features  1. Smart Trend System (Main Chart) Uses a 200-period LWMA baseline to determine
More from author
Monster Harmonic Indicator
Paul Geirnaerdt
4.59 (29)
Monster Harmonics Indicator is a harmonic pattern indicator. It recognizes Gartley, Bat, Crab, Butterfly, Cypher, White Swan, Black Swan, Shark and several other patterns. Projected patterns that are not yet completed are recognized, too. Monster even shows the PRZ (Potential Reversal Zone). Users can add their own user defined patterns to Monster. Besides the current pattern, Monster also shows all patterns in the symbols history. Monster will provide alerts for developing patterns. Introduced
TMA Currency Meter
Paul Geirnaerdt
4.14 (7)
TMA Currency Meter is the ultimate currency meter. Based on the Triangular Moving Average of all available symbols, this indicator shows which currencies are strong, strengthening, weak or weakening. Experienced as well as novice traders will see the strong and weak currencies in the blink of an eye, and know which trade possibilities to explore further. TMA Currency Meter is a true Multi Timeframe indicator. It is easy to show the currency strengths for a higher timeframe than the chart timefra
Monster Harmonics Indicator is a harmonic pattern indicator. It recognizes Gartley, Bat, Crab, Butterfly, Cypher, White Swan, Black Swan, Shark and AB=CD patterns. Projected patterns that are not yet completed are recognized, too. Monster even shows the PRZ (Potential Reversal Zone). Users can add their own user defined patterns to Monster. Besides the current pattern, Monster also shows all patterns in the symbols history. Monster will provide alerts for developing patterns. Introduced by H.M.
Riskscope
Paul Geirnaerdt
Riskscope shows all relevant information about your trades on screen. Information on Stop Loss and Take Profit can be shown as price, pips or exposure. Besides, Riskscope can display a high- and low-watermark of the total of your basket of trades. Settings Riskscope's default settings are good enough most of the time. Nearly all of them are fairly standard. Here are the ones that need some explanation. Monospaced font - set this to the (name of) the font you want to use. A monospaced font looks
Pivots
Paul Geirnaerdt
Pivots is an indicator to show pivots for relevant time frames. Besides the pivots the indicator can also show daly open line, the resistance and support levels, the ADR Fibonacci levels and the order of the pivots. Pivots includes an intelligent algorithm to eliminate Sunday candles, but only if your broker provides those. Pivots are significant price levels that may serve as support, resistance or breakout levels Settings textFont - font to use for the labels. textSize - font size. textColor -
Inside Bars
Paul Geirnaerdt
The Inside Bars indicator shows Inside Bars, the Breakout Zone and Breakouts thereof. Inside Bars are an important price action pattern. The price action of an Inside Bar is completely covered by the price action of the previous bar. Inside Bars are most often used on higher timeframes. Settings Inside Bars default settings are good enough most of the time. Feel free to fine tune them to your needs. ATR factor to skip large candles - very large candles should be filtered as they often cover othe
Candle Patterns
Paul Geirnaerdt
5 (2)
The Candle Patterns indicator shows popular candle patterns on the chart. The possible patterns are Inside Bar, Large Wick, Engulfing, Marubozu, Hammer, Shooting Star, Three White Soldiers and Three Black Crows. Candles are colored to easily identify the patterns. Also, a point and click function displays the pattern found. Settings Message box - when a candle is clicked, the pattern identified will be shown in a Message Box on the charts. All 'Message Box' settings pertain to the box. Show Ins
Better Support Resistance
Paul Geirnaerdt
4.4 (5)
Better Support & Resistance shows the best support and resistance lines and zones. It is based on Fractals with the factor of your choice. All fractals are assembled, weighted, extended and merged into a clear set of support and resistance lines. The immediate nearby lines are shown as zones when price is in that zone. Better Support & Resistance gives you the best overview of the important price levels. Settings Better Support & Resistance's default settings are good enough most of the time. N
The Engulfing Bars indicator shows Engulfing Bars, the signal and the suggested stoploss and take profit. Engulfing Bars are an important price action pattern. The price action of an Engulfing Bar completely covers the price action of the previous bar. Engulfing Bars are most often used on higher timeframes. Settings Engulfing Bars default settings are good enough most of the time. Feel free to fine tune them to your needs. Show Engulfing Bars - Set to true to show Engulfing Bars. Body size per
Flying Volume
Paul Geirnaerdt
1 (1)
The Flying Volume indicator is a specialized volume indicator. It deciphers the volume data after heavy proprietary number crunching. When a main signal is found Flying Volume will look for possible continuation points. The main signal is shown by arrows, the continuation points by dots. Volume indicators are most often used on higher timeframes. Features Main Buy or Sell signals Continuation signals No repainting One signal per bar Settings Flying Volume default settings are good enough most
Fractalicious
Paul Geirnaerdt
Fractalicious shows Fractals of any length, higher or lower highs and lower of higher lows, the fractal channel and the breakout of the channel. Fractals are an important trend and price action pattern. Fractalicious can be used on any timeframe and symbol. Settings Fractalicious default settings are good enough most of the time. Feel free to fine tune them to your needs. Show last fractal - Set to true to show fractals from the last completed bar. (This could move the fractal if the current ba
Breakout Hero
Paul Geirnaerdt
2.64 (11)
Breakout Hero is a Multi Symbol , Auto Timeframe , Breakout Expert Advisor . It recognizes breakout patterns and will set pending trades. When triggered Breakout Hero will monitor trades and adjust the stop loss. Breakout Hero is a multi symbol EA, it will trade EURUSD, GBPUSD, USDJPY and USDCAD. Also, Breakout Hero is auto timeframe. Just drop Breakout Hero on any chart and start trading. Only one chart is needed, Breakout Hero will trade the symbols you pick from the settings. You can monitor
Dark Rider
Paul Geirnaerdt
1 (2)
Dark Rider  is a Night Scalper Expert Advisor . It recognizes overbought and oversold conditions in the hours after close of the New York Exchange and trades accordingly. Dark Rider features an on screen monitor and settings panel on which you can monitor your status and progress.  A signal for Dark Rider can be found here . New in version 1.5 The option 'Stay in trending trades' is new for version 1.5. It will keep you in trending trades. Profitability has been increased while drawdown has bee
Divergence Dash
Paul Geirnaerdt
3 (2)
Diverence Dash is a MACD, RSI, OBV, Momentum, Stochastic or Standard Deviaviation Divergence Dashboard. It will scan all symbols and timeframes you want. Also, Divergence Dash can open charts with the divergence found using the template of your choice. Divergences are often used as a leading indicator and, by using Divergence Dash, are easy to spot. The risk/reward ratio in divergence trading is very low. What can Divergence Dash for you: Find MACD, RSI, OBV, Momentum, Stochastic or Standard Dev
Fusion Trader
Paul Geirnaerdt
5 (1)
NEWS Price increased to $249 from $149 on September 16th. Buy Fusion Trader v2 and get Donchian Trader for free. (limited to 3 account numbers) Fusion Trader v2  is a  Multi Symbol ,  Auto Timeframe ,  Expert Advisor . It features several strategies for different symbols and timeframes. Fusion Trader will monitor trades and adjust the stop loss. Fusion Trader v2  is a complete rewrite from v1, it trades different and more symbols. With default settings Fusion Trader has gained 5% monthly on ave
Donchian Trader
Paul Geirnaerdt
Donchian Trader is a   Multi Index ,   Auto Timeframe ,   Expert Advisor . It features a Donchian Channel strategy for different indices on the daily timeframe. Donchian Trader will monitor trades and adjust to market conditions. Donchian Trader is a multi index EA, For now, it will trade the Dow Jones (US30), S&P 500 (US500) and DAX (GER30). Also, Donchian Trader is auto timeframe. Just drop the EA on any chart and start trading. Only one chart is needed, Donchian Trader will trade the indices
MonsterDash Harmonics Indicator is a harmonic pattern dashboard. It recognizes all major patterns. MonsterDash is a dashboard that displays all detected patterns for all symbols and (almost) all timeframes in sortable and scrollable format. Users can add their own user defined patterns . MonsterDash can open and update charts with the pattern found. Settings MonsterDash's default settings are good enough most of the time. Feel free to fine tune them to your needs. The color settings are for tho
NEWS Price v4 now $799 for a limited period. Fusion Trader v4  is a  Multi Symbol ,  Auto Timeframe ,  Expert Advisor . It features several strategies for different symbols and timeframes. Fusion Trader will monitor trades and adjust the stop loss. Fusion Trader v4  is a partial rewrite from v3, it trades differently and more symbols. The Scalping system now uses market orders instead of stop orders. It is 100% Metatrader 5 compatible. Fusion Trader v4 is a multi symbol EA, For now, it will tra
TMA Currency Meter is the ultimate currency meter. Based on the Triangular Moving Average of all available symbols, this indicator shows which currencies are strong, strengthening, weak or weakening. Experienced as well as novice traders will see the strong and weak currencies in the blink of an eye, and know which trade possibilities to explore further. TMA Currency Meter is a true Multi Timeframe indicator. It is easy to show the currency strengths for a higher timeframe than the chart timefra
Momentum Horizon
Paul Geirnaerdt
Momentum Horizon is a fully automated trading system built for MetaTrader 5, designed to capture high-probability breakout moves in the Gold market. It focuses on two of the most time-tested price action patterns: the daily breakout of yesterday’s high/low, and the powerful 'London session' breakout, where volatility often surges as global markets overlap. By combining these setups, the system seeks to position itself right where momentum is most likely to accelerate. The EA can operate with pre
Filter:
ohyman
311
ohyman 2023.08.07 14:37 
 

I would like the developer to do a detail video on how to take trades with the completed pattern and also another filter indicator to avaoid frequesnt stop out and pattern disappearing

Suvashish Halder
167892
Suvashish Halder 2021.10.21 12:37 
 

It works and I become a fan of Harmonic Patterns 😍 Very good indicator. Thank you, Paul 🙂

faithdefender
1736
faithdefender 2021.01.27 22:42 
 

So far, in my trading experiences with this scanner, it has not been the reliable scanner everyone says in the reviews. I have been going back and forth asking questions to Paul, but I am getting general answers. It may be because I am not communicating the issue properly? I recently complained about the scanner showing 1 price for the Daily GBPJPY with a "C" for complete, and when the price went past the D point, it changed to a different value. I entered the trade when it hit the D point @142.26, but I was stopped out. I looked at the scanner to make sure of the price, and the scanner now showed the D point at 142.85. Before I posted this review, I looked to see if anyone else had this problem and sure enough, I read above that @Doaa Elwy said almost the same thing I am complaining about. ((Please note this was back in Mar 2016 and still the same problem)) He wrote ""I just rented it, it does something very strange, it was showing bearish patterns in GBPJPY.. and it showed it completed .. then the market move up, The completion price changed .. then after 5 minutes, the GBPJPY disappeared from the dash board. for me this is exactly like an indicator that repaints.."I can't rely on it."" What's odd is that it was the same pair as he spoke of. I have hope for this indicator scanner, but not at this time. The price was not terrible, but the functionality is a concern and cannot be trusted at the moment. At least, with his Monster Indicator, he provides a stop and a target once the pattern is identified. Maybe he could do this on the scanner as well? But I am not hopeful because I see where someone had make recommendations in 8-19-2018 for changes to his harmonic indicator but there have been no additions/changes made since 7-24-2018. This is my 3rd indicator I have purchased. I forgot to mention also that the print is very small and I like to highlight the symbol to make sure I hit the right chart to open up, but if the chart you want to open is highlighted, it does nothing when you click on the pair. I have to highlight the one above or the one below to get my bearings and then I can click on the right chart. Once it opens, I then have to zoom in for the chart to display the prospective pattern. It can work, but inconvenient. UPDATE 1-28-21 The scanner has now (again) replaced the completed price on the same pattern, GBPJPY AB=CD daily, and is now142.92. At 10:17 hrs it is now 143.21 showing "Complete." The point I am making is the scanner identifies what is "C" and what is "P". You cannot trade when the scanner is discarding "complete" prices for new "complete" prices. Update-1-28-21 @1202 hrs, "completed" price is now at 143.24. Again, my point is this should show a P and not a C. It is either completed or projected. Update. 1-28-21 1520 hrs= Daily Ab=CD GBPJPY now @ 143.26....Update 2-1-21--so far not a word about the problem I encountered. (The GBPJPY finally fell off the scanner line-up) I would like to see this resolved for the money I paid, but there has not been a word of communication regarding the problem. I would like to provide a good review in the future. Update; As of 2-7-21 no communication from the vendor. No attempt to solve the problem. UPDATE; as of 6-27-21, no communication from the Vendor. As of 1/29/22 the Vendor has not reached out. Please note the indicator does identify patterns. That is not the problem. The problem is the indicator does not identify patterns as Scott Carney's instructions would. There is more to harmonics then just drawing Fibonacci's.

Mehdi Faraz Fard
2370
Mehdi Faraz Fard 2018.11.19 17:14 
 

User didn't leave any comment to the rating

Gursimran Singh Bharaj
114
Gursimran Singh Bharaj 2018.06.22 11:43 
 

I have rented this indicator. I had already bought the monster harmonic indicator a long time back. I missed a dashboard where multiple patterns are detected on a time frame. this does the job well. I am giving it 5 stars for the way it performs.

don't expect that if a pattern forms you just open a trade. you have to take other factors into account.

reo4ua
157
reo4ua 2018.03.29 22:43 
 

Paul,

What a fantastic time saver you have here. Honestly - one could trade using only your indicator and key levels and make all the money they want. Thank you for sharing this with us. Two requests if you would consider them for the next version: the ability to remove a signal from the list to keep it as clutter free as possible (for instance if you wake up to patterns where the optimal trade entry level has already come and gone - no sense in seeing it anymore) and a free-form notes column to the right of the "chart" button. Since I trade mainly with weekly pivots, noting point "d"'s proximity to the closest weekly fib pivot would be nice too.

Thanks again for what you do for the MT community!

Morard Kevin
1506
Morard Kevin 2017.11.08 21:00 
 

very good thank you

pnutfx503
1530
pnutfx503 2017.07.08 03:03 
 

Great work

sasans
877
sasans 2017.04.13 01:14 
 

very good indicator, few trades till now all was accurate

Jiahao Peng
35
Jiahao Peng 2017.03.14 20:37 
 

User didn't leave any comment to the rating

Julian Lo
713
Julian Lo 2017.02.16 05:13 
 

Very nice piece of work. I only look at completed patterns with young age. Together with other confluences for confirmation it becomes unbeatable. There are a few bugs, but nothing that I cannot live with. I am sure Paul will fix them soon.

Kevin Manrrique
467
Kevin Manrrique 2017.01.30 23:33 
 

January 30, 2017.

Just bought the monthly trial. I love the indicator so far, kinda confusing since very slow and so much writing. Just made a trade, hopefully, it goes well. Accuracy is 100%, so let's see. If this goes well, I really want to get in touch with the builder/ author. I want this indicator to grow, and help people all over and try to reach them!

January 30, 2017 (UPDATE)

Have been using indicator, and it's amazing how such a software works. I only have one problem... The dashboard for the patterns always refreshes randomly and loses some signals throughout the process. The other thing is, Instead of showing 0 bars, can we show the bars starting at 1?

I like the dashboard but I think the software will be better and not lag as much if the indicator used for each pair separately giving each screen (pair) a signal then having all these signals on a dashboard. I think this will stop the lagging and the reset/ refreshed.

david.l
514
david.l 2016.09.09 09:35 
 

work as it is, but you need strategy to confirm the pattern, not all completed pattern bring you profit.

Bruce Parker
148
Bruce Parker 2016.05.22 06:19 
 

the first step to winning trades is understanding which harmonic patterns have the highest the probability for success. there are 2 types of harmonic patterns. the first type is a reversal harmonic pattern that I stay away from because trying to call tops and bottoms is DEFINITELY not for me TRYING TO MAKE THOSE TYPE OF CALLS, UNLESS YOU ARE GOD. the second type of harmonic pattern is a continuation harmonic pattern and for me that's money in the bank; especially on a 5 minute chart playing a harmonic continuation pattern using one of my favorite weapons , binary options that expire in 10 to 25 minutes. I bought monster dash last month, but just really started using it 2 weeks ago and turned my 500 deposit in my binary account into over $3,000.00 in the past 2 weeks. that means I'm up 2500 the past 2 weeks trading just 100 per trade. it would have been nice if i was trading 500 per trade and would be up 10,000 instead, but i choose to start small and work my way up the ladder to 500 per trade.

HERE ARE MY STATS

I placed a total of 109 trades in the last 2 weeks... I won 66 trades and lost 43 trades hitting over 60%.

however I would have done much better if I was not mixing in the 1 minute chart harmonic continuation patterns and the winning ration on those only appears to be in the 50% range.

so the last 2 days I cut out the 1 minute chart and only used the 5 minute chart harmonic continuation patterns going 13-3 with a winning rate of over 80%!!! I also went back to all my 5 minute chart plays I made over the last 2 weeks pulling out the actual harmonic continuation plays and saw they were also all hitting close to 80 % if it had a binary option expiration date of 10 to 25 minutes.

if you are trading with a regular Forex broker i would not recommend using a 5 minute chart unless you are scalping; I would go with a 15 minute chart or higher using only harmonic continuation patterns and staying away from harmonic reversal patterns. as a general rule of thumb, if you are going long, than the MA(200) line should be moving up and the 5 day average should be moving up, otherwise its not a continuation pattern and would be considered a harmonic reversal pattern ; it does not matter if the price is above or below the MA(200) or the 5 day moving average as long as both lines are moving up.

and vice versa if you are going short, than than the MA(200) line should be moving down and the 5 day average should be moving down, otherwise its not a harmonic continuation pattern but considered a harmonic reversal pattern instead.

BASED ON WHAT I HAVE SEEN SO FAR, THE DIFFERENCE IN WINNING PERCENT BETWEEN A HARMONIC CONTINUATION PATTERN AND A HARMONIC REVERSAL PATTERN IS HUGE BY AT LEAST 10 TO 20 % OR BETTER. SO INSTEAD OF STRUGGLING TO HIT 50 TO 60% WITH A HARMONIC REVERSAL PATTERN TRYING TO CALL TOPS AND BOTTOMS THERE IS A MUCH BETTER WAY... INSTEAD YOU CAN REALLY KICK SOME ASS WITH A HARMONIC CONTINUATION PATTERN HITTING MORE LIKE 60% TO 70% OR BETTER WITH YOU TRADES; OR IF YOU ARE AS GOOD AS I AM THAT NOW MASTERS THE 5 MINUTE HARMONIC CONTINUATION PATTERN HIT 80% OR BETTER. I know its only been 2 weeks but it looks very promising by me just focusing all my efforts on the 5 minute chart harmonic continuation patterns that expires in the next 10 to 25 minutes. it also helps if you are using a binary broker that will pay you at least an 80% return for binary options that expire in 10 to 25 minutes and pay you back 5% on your losses, that way even if you only hit 55% you still will do slightly better than break even. than again if you are only hitting 55% with harmonic continuation patterns, than those are really not harmonic continuation patterns you thought you were trading.

Amjad Muhaisen
1366
Amjad Muhaisen 2016.04.20 12:30 
 

User didn't leave any comment to the rating

darktideac2
246
darktideac2 2016.04.08 11:20 
 

Insanely great (as Steve Jobs would have put it). Tops some of the paid saas offerings out there that I am also signed up for - and at a much lower price.

Doaa Elwy
637
Doaa Elwy 2016.03.28 00:55 
 

User didn't leave any comment to the rating

Jonathan Paul Maithai
2038
Jonathan Paul Maithai 2016.01.22 10:29 
 

great indicator - used with other confirmations for entry, very useful. from lots of charts open, this makes life so much easier

Harmonictrader7
38
Harmonictrader7 2016.01.05 08:53 
 

User didn't leave any comment to the rating

frederic gaspari
60
frederic gaspari 2015.10.13 10:05 
 

fantastic indicator, better than all these expert advisors scams, buy eyes closed

12
Reply to review