Moving Ribbon Force

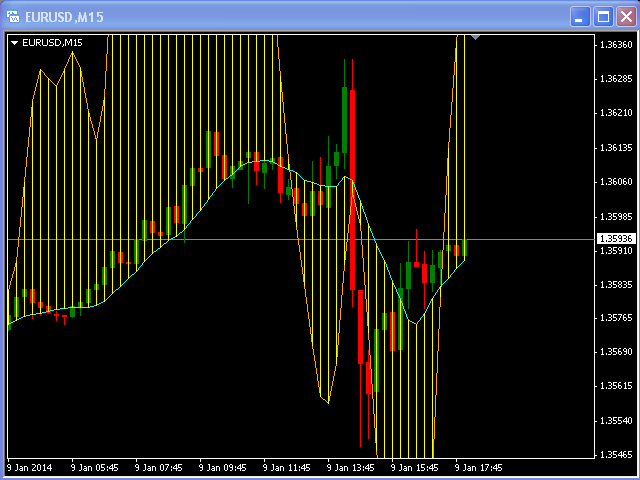
This indicator is a combination of 2 classical indicators: MA and Force Index.

The input parameter counted_bars determines on how many bars the indicator lines will be visible.

The input parameter MaForcePeriod is used for MA and Force calculation.

You may go Long if the current price crossed Up the Ribbon (HISTOGRAM) 

and

you may go Short if the current price crossed Down the Ribbon (HISTOGRAM)

Recommended products
Daily Candle Predictor is an indicator that predicts the closing price of a candle. The indicator is primarily intended for use on D1 charts. This indicator is suitable for both traditional forex trading and binary options trading. The indicator can be used as a standalone trading system, or it can act as an addition to your existing trading system. This indicator analyzes the current candle, calculating certain strength factors inside the body of the candle itself, as well as the parameters of
VR Cub
Vladimir Pastushak
VR Cub is an indicator for getting high-quality entry points. The indicator was developed to facilitate mathematical calculations and simplify the search for entry points into a position. The trading strategy for which the indicator was written has been proving its effectiveness for many years. The simplicity of the trading strategy is its great advantage, which allows even novice traders to successfully trade with it. VR Cub calculates position opening points and Take Profit and Stop Loss targe
Trend Oscillator - is an advanced custom  Crypto_Forex indicator, efficient trading tool! Advanced new calculation method is used - 20 options for parameter "Price for calculation". Smoothest oscillator ever developed. Green color for upward trends,  Red color for downward trends. Oversold values: below 5, O verbought values: over 95. There are plenty of opportunities to upgrade even standard strategies with this indicator. With PC and Mobile alerts. Click here to see high quality Trading Robot
Noize Absorption Index MT4
Ekaterina Saltykova
5 (1)
Noize Absorption Index - is the manual trading system that measures the difference of pressure between bears forces and bulls forces. Green line - is a noize free index that showing curent situation. Zero value of index shows totally choppy/flat market.Values above zero level shows how powerfull bullish wave is and values below zero measures bearish forces.Up arrow appears on bearish market when it's ready to reverse, dn arrow appears on weak bullish market, as a result of reverse expectation. S
Infinity Trend Pro
Yaroslav Varankin
1 (1)
This is a trend indicator without redrawing Developed instead of the binary options strategy (by the color of the Martingale candlestick) Also works well in forex trading When to open trades (binary options) A signal will appear in the place with a candle signaling the current candle It is recommended to open a deal for one candle of the current timeframe M1 and M5 When a blue dot appears, open a deal up When a red dot appears, open a trade down. How to open trades on Forex. When a signal is rec
HMA Trend Professional MT4
Pavel Zamoshnikov
4.57 (7)
Improved version of the free HMA Trend indicator (for MetaTrader 4) with statistical analysis. HMA Trend is a trend indicator based on the Hull Moving Average (HMA) with two periods. HMA with a slow period identifies the trend, while HMA with a fast period determines the short-term movements and signals in the trend direction. The main differences from the free version: Ability to predict the probability of a trend reversal using analysis of history data. Plotting statistical charts for analyzi
The Th3Eng PipFinite indicator is based on a very excellent analysis of the right trend direction with perfect custom algorithms. It show the true direction and the best point to start trading. With StopLoss point and Three Take Profit points. Also it show the right pivot of the price and small points to order to replace the dynamic support and resistance channel, Which surrounds the price. And Finally it draws a very helpful Box on the left side on the chart includes (take profits and Stop loss
Owl smart levels
Sergey Ermolov
4.26 (38)
MT5 version  |  FAQ The Owl Smart Levels Indicator  is a complete trading system within the one indicator that includes such popular market analysis tools as  Bill Williams' advanced fractals , Valable ZigZag which builds  the correct wave structure  of the market, and  Fibonacci levels  which mark the exact levels of entry into the market and places to take profits. Detailed description of the strategy Instructions for working with the indicator Advisor-assistant in trading Owl Helper Private
Super Reversal Pattern
Parfait Mujinga Ndalika
Super Reversal Pattern Indicator Unlock the power of advanced pattern recognition with our Super Reversal Pattern Indicator. Designed for traders seeking precision and reliability, this indicator identifies one of the most effective reversal patterns in technical analysis, offering a significant edge in your trading strategy. Key Features: Non-Repainting Accuracy: Enjoy the confidence of non-repainting technology. Once a Super Reversal Pattern is detected, it remains static, providing consiste
EZZ Zig Zag MT4
Paulo Rocha
5 (1)
EZZ Elite Zig Zag is an indicator for the MetaTrader 4 terminal. This indicator traces the peak of the trend based on the market reversal, thus showing various opportunities in the financial market. EZZ Elite Zig Zag is a visual tool, intuitive, and easy to understand and use.  Test it Yourself by Downloading it for Free. Author Paulo Rocha all rights reserved
"Dynamic Flow Oscillator" - is an advanced custom Crypto_Forex indicator - efficient Trading tool for MT4!  - New generation of Oscillators - see pictures to check how to use it. - Dynamic Flow Oscillator has adaptive Oversold/Overbought zones. - Indicator uses   price and volume data   for identifying oversold and overbought zones. - Oscillator is an auxiliary tool to find exact entry points from OverSold/OverBought areas. - Oversold values: below Green line, Overbought values: over Red line
The indicator displays the data of the Stochastic oscillator from a higher timeframe on the chart. The main and signal lines are displayed in a separate window. The stepped response is not smoothed. The indicator is useful for practicing "manual" forex trading strategies, which use the data from several screens with different timeframes of a single symbol. The indicator uses the settings that are identical to the standard ones, and a drop-down list for selecting the timeframe. Indicator Paramet
Trade with Gann on your side!! MASTER CIRCLE 360 CIRCLE CHART, originally created by Gann admitted that this is “The Mother of all charts”. It is one of the last studies that this great trader left for us. The numeric tab le is apparently quite simple like all the tables and is based on square numbers, the SQUARE OF 12 and is by evolution, one of the most important square numbers. Here we can find CYCLE, PRICE AND TIME thanks to angles and grades, to show past and future support and resistance.
Alpha Trend sign has been a very popular trading tool in our company for a long time. It can verify our trading system and clearly indicate trading signals, and the signals will not drift. Main functions: Based on the market display of active areas, indicators can be used to intuitively determine whether the current market trend belongs to a trend market or a volatile market. And enter the market according to the indicator arrows, with green arrows indicating buy and red arrows indicating se
TWO PAIRS SQUARE HEDGE METER INDICATOR Try this brilliant 2 pairs square indicator It draws a square wave of the relation between your two inputs symbols when square wave indicates -1 then it is very great opportunity to SELL pair1 and BUY Pair2 when square wave indicates +1 then it is very great opportunity to BUY pair1 and SELL Pair2 the inputs are : 2 pairs of symbols         then index value : i use 20 for M30 charts ( you can try other values : 40/50 for M15 , : 30 for M30 , : 10 for H1 ,
What are Heiken Ashi Candles? Heiken Ashi, derived from the Japanese term 'Heikin Ashi,' translates to average price bars. It's an indicator depicting price bars on a chart. Formula for Heiken Ashi candles: - Heiken Ashi opening price: (previous candle's opening + closing price) / 2 - Closing price Heiken Ashi: (opening + high + low + closing) / 4 - Heiken Ashi peak: Max of high, opening, or closing price - Heiken Ashi bottom price: Min of low, opening, or closing price How to Read Heiken A
Auto Fibo Pro m
DMITRII GRIDASOV
"Auto FIBO Pro"   Crypto_Forex  indicator  - is great auxiliary tool in trading! Indicator automatically calculate and place on chart Fibo levels and local trend lines (red color). Fibonacci levels indicate key areas where price can reverse. Most important levels are 23.6%, 38.2%, 50% and 61.8%. You can use it   for reversal scalping  or for zone grid trading. There are plenty of opportunities to  improve your current system using Auto FIBO Pro indicator as well. It has Info Spread Swap Displa
The "MR Volume Profile Rectangles 4" indicator is a charting tool that displays trading volume at different price levels rather than time intervals. A key concept in volume profile is the point of control (POC) —the price level with the highest volume traded during the session or time range. While tools like VWAP or OBV provide volume trends, the "MR Volume Profile Rectangles 4" indicator offers granular detail about where the most market activity occurs at specific price levels. This makes it a
[ZhiBiCCI] indicators are suitable for all cycle use, and are also suitable for all market varieties. [ZhiBiCCI] Green solid line is a reversal of bullish divergence. The green dotted line is a classic bullish divergence. [ZhiBiCCI] The solid line to the red is a reverse bearish divergence. The red dotted line is a classical bearish divergence. [ZhiBiCCI] can be set in the parameters (Alert, Send mail, Send notification), set to (true) to send instant signals to the alarm window, email, insta
Matrixs
Andriy Sydoruk
Matrix is a Forex arrow indicator. Displays signals simply and clearly! The arrows show the direction of the transaction, and are colored accordingly, which can be seen in the screenshots. As you can see, trading with such an indicator is easy. I waited for an arrow to appear in the desired direction - I opened a deal. An arrow formed in the opposite direction - closed the deal. The indicator also displays the lines with the help of which the arrow signals are formed, taking into account the int
The Perspective Trend indicator tracks the market trend with very high reliability. All intersection points will be ideal points at which the direction of the trend changes. Sharp price fluctuations, as well as noise around averaged prices, are ignored. Signal points, places where color changes, can be used as points of potential market reversal. The indiuctor algorithm implements a kind of technical analysis based on the idea that the market is cyclical in nature. This development can be used b
Bermaui Bands
Muhammad Elbermawi
4.97 (68)
Bermaui Bands (BB) is a technical analysis tool that helps filter between ranging and trending price movements. The idea behind this indicator can be explained in the next steps: Calculate Standard Deviation as an oscillator that moves between 0 and 100. I will name it Bermaui Deviation percent (BD %). If "BD %" is near zero then volatility is at its extreme. In addition, if "BD %" is near 100 then volatility is very low. High volatility means a great probability for a trending market, while low
Fibonacci retracement and extension line drawing tool Fibonacci retracement and extended line drawing tool for MT4 platform is suitable for traders who use  golden section trading Advantages: There is no extra line, no too long line, and it is easy to observe and find trading opportunities Trial version: https://www.mql5.com/zh/market/product/35884 Main functions: 1. Multiple groups of Fibonacci turns can be drawn directly, and the relationship between important turning points can be seen
Wave Wolf MT4
Andrei Salanevich
The Wave Wold MT4 Forex indicator is designed to search for Wolf waves and display them in the current window of the trading terminal. An excellent indicator for traders who use Wolf waves in trading. Its application in trading strategies will significantly increase their efficiency and profitability. INFORMATION ABOUT THE INDICATOR Unlike other Wolf wave indicators, the Wave Wold MT4 forex indicator has a number of features that significantly increase its effectiveness: The first is the Ope
First of all Its worth emphasizing here that this Trading Tool is Non-Repainting Non-Redrawing and Non-Lagging Indicator Which makes it ideal for professional trading . [Online course] ,   and   [manual] The Smart Price Action Concepts Indicator is a very powerful tool for both new and experienced traders . It packs more than 20 useful indicators into one combining advanced trading ideas like Inner Circle Trader Analysis and Smart Money Concepts Trading Strategies . This indicator focuses on Sm
Trend Monitor
Pavel Zamoshnikov
4 (4)
The indicator generates early signals basing on ADX reading data combined with elements of price patterns. Works on all symbols and timeframes. The indicator does not redraw its signals. You see the same things on history and in real time. For better visual perception signals are displayed as arrows (in order not to overload the chart). Features Easy to use. Filter configuration only requires selection of sensitivity in the " Sensitivity of the indicator " input. Signals can be filtered using
Heiken Ashi candle chart is an improved version of The Japanese candle chart, which can effectively filter the market "noise" of the Japanese candle chart. It is favored by many traders for its simplicity and intuition. For trend traders, the HA candle chart is a magic tool. Unlike the traditional Japanese candle chart, Heikenashi does not reflect the opening price, high price, low price and closing price of the market. Instead, Heikenashi calculates the value of a single K line in the dominant
An indicator of pattern #31 ("Long Island") from Encyclopedia of Chart Patterns by Thomas N. Bulkowski. The second gap is in the opposite direction. Parameters: Alerts - show alert when an arrow appears   Push - send a push notification when an arrow appears (requires configuration in the terminal) GapSize - minimum gap size in points ArrowType - a symbol from 1 to 17 ArrowVShift - vertical shift of arrows in points   ShowLevels - show levels ColUp - color of an upward line ColDn - color of a
Point61 Indicator
Evgeniy Machok
5 (1)
The Point61 indicator is the result of many years of monitoring of price behavior of currency pairs and metals. It is not a secret, that in times of uncertainty, traders are looking for possible levels of support and resistance - the point, where price should stop its movement. There are 2 possible scenarios at these points: 1. Reverse (correction) to the opposite direction; 2. Breakthrough to continue movement. Very often these points are used to set stop orders - TakeProfit or StopLoss
Trendiness Index
Libertas LLC
5 (3)
"The trend is your friend" is one of the best known sayings in investing, because capturing large trendy price movements can be extremely profitable. However, trading with the trend is often easier said than done, because many indicators are based on price reversals not trends. These aren't very effective at identifying trendy periods, or predicting whether trends will continue. We developed the Trendiness Index to help address this problem by indicating the strength and direction of price trend
Buyers of this product also purchase
Gann Made Easy
Oleg Rodin
4.83 (156)
Gann Made Easy is a professional and easy to use Forex trading system which is based on the best principles of trading using the theory of W.D. Gann. The indicator provides accurate BUY and SELL signals including Stop Loss and Take Profit levels. You can trade even on the go using PUSH notifications. PLEASE CONTACT ME AFTER PURCHASE TO GET TRADING TIPS, BONUSES  AND GANN EA ASSISTANT + MT5 VERSION OF THE GANN MADE EASY INDICATOR  FOR FREE! Probably you already heard about the Gann trading method
Scalper Inside PRO
Alexey Minkov
4.74 (69)
An exclusive indicator that utilizes an innovative algorithm to swiftly and accurately determine the market trend. The indicator automatically calculates opening, closing, and profit levels, providing detailed trading statistics. With these features, you can choose the most appropriate trading instrument for the current market conditions. Additionally, you can easily integrate your own arrow indicators into Scalper Inside Pro to quickly evaluate their statistics and profitability. Scalper Inside
Game Changer Indicator
Vasiliy Strukov
4.6 (20)
Game Changer is a revolutionary trend indicator designed to be used on any financial instrument to transform your metatrader in a powerful trend analyzer.   It works on any time frame and assists in trend identification, signals potential reversals, serves as a trailing stop mechanism, and provides real-time alerts for prompt market responses.  Whether you’re a seasoned, professional or a beginner seeking an edge, this tool empowers you to trade with confidence, discipline and a clear understand
M1 Sniper
Oleg Rodin
5 (19)
M1 SNIPER is an easy to use trading indicator system. It is an arrow indicator which is designed for M1 time frame. The indicator can be used as a standalone system for scalping on M1 time frame and it can be used as a part of your existing trading system. Though this trading system was designed specifically for trading on M1, it still can be used with other time frames too. Originally I designed this method for trading XAUUSD and BTCUSD. But I find this method helpful in trading other markets a
Volatility Trend System - a trading system that gives signals for entries. The volatility system gives linear and point signals in the direction of the trend, as well as signals to exit it, without redrawing and delays. The trend indicator monitors the direction of the medium-term trend, shows the direction and its change. The signal indicator is based on changes in volatility and shows market entries. The indicator is equipped with several types of alerts. Can be applied to various trading ins
RFI levels PRO
Roman Podpora
5 (1)
The indicator accurately shows the reversal points and price return zones where the   Major players . You see where new trends are forming and make decisions with maximum precision, maintaining control over every trade. VERSION MT5     -     Reveals its maximum potential when combined with the   TREND LINES PRO   indicator What the indicator shows: Reversal structures and reversal levels with activation at the beginning of a new trend. Display of   TAKE PROFIT   and   STOP LOSS   levels with mi
Dynamic Forex28 Navigator
Bernhard Schweigert
4.43 (7)
Specials Discount now. The Next Generation Forex Trading Tool. Dynamic Forex28 Navigator is the evolution of our long-time, popular indicators, combining the power of three into one: Advanced Currency Strength28 Indicator (695 reviews) + Advanced Currency IMPULSE with ALERT (520 reviews) + CS28 Combo Signals (recent Bonus) Details about the indicator  https://www.mql5.com/en/blogs/post/758844 What Does The Next-Generation Strength Indicator Offer? Everything you loved about the originals, now
Precautions for subscribing to indicator This indicator only supports the computer version of MT4 Does not support MT5, mobile phones, tablets The indicator only shows the day's entry arrow The previous history arrow will not be displayed (Live broadcast is for demonstration) The indicator is a trading aid Is not a EA automatic trading No copy trading function The indicator only indicates the entry position No exit (target profit)  The entry stop loss point is set at 30-50 PIPS Or the front hi
GOLD Impulse with Alert
Bernhard Schweigert
4.64 (11)
This indicator is a super combination of our 2 products  Advanced Currency IMPULSE with ALERT  and  Currency Strength Exotics . It works for all time frames and shows graphically impulse of strength or weakness for the 8 main currencies plus one Symbol! This Indicator is specialized to show currency strength acceleration for any symbols like Gold, Exotic Pairs, Commodities, Indexes or Futures. Is first of its kind, any symbol can be added to the 9th line to show  true currency strength accelerat
Currency Strength Wizard is a very powerful indicator that provides you with all-in-one solution for successful trading. The indicator calculates the power of this or that forex pair using the data of all currencies on multiple time frames. This data is represented in a form of easy to use currency index and currency power lines which you can use to see the power of this or that currency. All you need is attach the indicator to the chart you want to trade and the indicator will show you real str
Trend Lines PRO
Roman Podpora
5 (1)
TREND LINES PRO    helps understand where the market is truly changing direction. The indicator shows real trend reversals and points where major players re-enter. You see   BOS lines   Trend changes and key levels on higher timeframes — without complex settings or unnecessary noise. Signals don't repaint and remain on the chart after the bar closes. VERSION MT 5     -     Reveals its maximum potential when paired with the   RFI LEVELS PRO  indicator What the indicator shows: Real shifts   tren
Trend Screener
STE S.S.COMPANY
4.79 (95)
Trend Screener Indicator --Professional Trend Trading & Market Scanning System for MetaTrader Unlock the true power of trend trading with Trend Screener Indicator — a complete multi-currency, multi-timeframe trend analysis solution   powered by Fuzzy Logic,Trend Pulse Technology  and advanced market structure algorithms.   Trend Screener transforms your MetaTrader platform into a professional-grade Trend Analyzer and Market Scanner, helping you identify high-probability trend opportunities, ear
Currency Strength Exotics
Bernhard Schweigert
4.88 (33)
CURRENTLY 20% OFF ! Best Solution for any Newbie or Expert Trader! This Indicator is specialized to show currency strength for any symbols like Exotic Pairs Commodities, Indexes or Futures. Is first of its kind, any symbol can be added to the 9th line to show true currency strength of Gold, Silver, Oil, DAX, US30, MXN, TRY, CNH etc. This is a unique, high quality and affordable trading tool because we have incorporated a number of proprietary features and a new formula. Imagine how your trading
New Update of Smart Trend Trading System MT5 For  2026 Market: If You Buy this Indicator you will Get my Professional   Trade Manager + EA  for   FREE . First of all Its worth emphasizing here that this Trading System is   Non-Repainting   , Non Redrawing and Non Lagging Indicator   Which makes it ideal from both manual and robot trading .  [Online course] ,   [manual]   and   [download presets] . The Smart Trend Trading System MT5 is a comprehensive trading solution tailored for   new   and   e
FX Power MT4 NG
Daniel Stein
4.95 (21)
FX Power: Analyze Currency Strength for Smarter Trading Decisions Overview FX Power is your go-to tool for understanding the real strength of currencies and Gold in any market condition. By identifying strong currencies to buy and weak ones to sell, FX Power simplifies trading decisions and uncovers high-probability opportunities. Whether you’re looking to follow trends or anticipate reversals using extreme delta values, this tool adapts seamlessly to your trading style. Don’t just trade—trade
Advanced Supply Demand
Bernhard Schweigert
4.91 (299)
Trading Special – 40% OFF Best Solution for any Newbie or Expert Trader! This indicator is a unique, high quality and affordable trading tool because we have incorporated a number of proprietary features and a new formula. With this update, you will be able to show double timeframe zones. You will not only be able to show a higher TF but to show both, the chart TF, PLUS the higher TF: SHOWING NESTED ZONES. All Supply Demand traders will love it. :) Important Information Revealed Maximize the pot
Looking for a powerful yet lightweight swing detector that accurately identifies market structure turning points? Want clear, reliable buy and sell signals that work across any timeframe and any instrument? Buy Sell Arrow MT Swing is built exactly for that — precision swing detection made simple and effective. This indicator identifies Higher Highs (HH) , Higher Lows (HL) , Lower Highs (LH) , and Lower Lows (LL) with remarkable clarity. It is designed to help traders easily visualize market stru
Trading Special – 40% OFF Best Solution for any Newbie or Expert Trader! This dashboard software is working on 28 currency pairs plus one. It is based on 2 of our main indicators (Advanced Currency Strength 28 and Advanced Currency Impulse). It gives a great overview of the entire Forex market plus Gold or 1 indices. It shows Advanced Currency Strength values, currency speed of movement and signals for 28 Forex pairs in all (9) timeframes. Imagine how your trading will improve when you can watch
Atomic Analyst
Issam Kassas
5 (3)
First of all Its worth emphasizing here that this Trading Indicator is   Non-Repainting , Non Redrawing and Non Lagging Indicator   Indicator, Which makes it ideal from both manual and robot trading.  User manual: settings, inputs and strategy . The Atomic Analyst  is a PA Price Action Indicator that uses Strength and Momentum of the price to find a better edge in the market. Equipped with Advanced filters which help remove noises and false signals, and Increase Trading Potential. Using Multiple
El indicador "MR BEAST ALERTAS DE LIQUIDEZ" es una herramienta avanzada diseñada para proporcionar señales y alertas sobre la liquidez del mercado basándose en una serie de indicadores técnicos y análisis de tendencias. Ideal para traders que buscan oportunidades de trading en función de la dinámica de precios y los niveles de volatilidad, este indicador ofrece una visualización clara y detallada en la ventana del gráfico de MetaTrader. Características Principales: Canal ATR Adaptativo: Calcula
Gold Scalper Super
Aleksandr Makarov
5 (2)
Gold Scalper Super is an easy-to-use trading system. The indicator can be used as a standalone scalping system on the M1 time frame, as well as part of your existing trading system. Bonus: when purchasing an indicator, Trend Arrow Super is provided free of charge, write to us after purchase. The indicator 100% does not repaint!!! If a signal appears, it does not disappear! Unlike indicators with redrawing, which lead to the loss of a deposit, because they can show a signal and then remove it.
PRO Renko System
Oleg Rodin
5 (30)
PRO Renko System is a highly accurate trading system specially designed for trading RENKO charts. The ARROWS and Trend Indicators DO NOT REPAINT! The system effectively neutralizes so called market noise giving you access to accurate reversal signals. The indicator is very easy to use and has only one parameter responsible for signal generation. You can easily adapt the tool to any trading instrument of your choice and the size of the renko bar. I am always ready to provide extra support to help
IQ FX Gann Levels a precision trading indicator based on W.D. Gann’s square root methods . It plots real-time, non-repainting support and resistance levels to help traders confidently spot intraday and scalping opportunities with high accuracy. William Delbert Gann (W.D. Gann) was an exceptional market analyst, whose trading technique was based on a complex blend of mathematics, geometry, astrology, and ancient mathematics which proved to be extremely accurate. Setup & Guide:  Download  MT5 Ver
PZ Harmonacci Patterns
PZ TRADING SLU
3.17 (6)
Trade smarter, not harder: Empower your trading with Harmonacci Patterns This is arguably the most complete harmonic price formation auto-recognition indicator you can find for the MetaTrader Platform. It detects 19 different patterns, takes fibonacci projections as seriously as you do, displays the Potential Reversal Zone (PRZ) and finds suitable stop-loss and take-profit levels. [ Installation Guide | Update Guide | Troubleshooting | FAQ | All Products ] It detects 19 different harmonic pric
Step into the world of Forex trading with confidence, clarity, and precision using   Gold Indicator   a next-generation tool engineered to take your trading performance to the next level. Whether you’re a seasoned professional or just beginning your journey in the currency markets, Gold Indicator equips you with powerful insights and help you trade smarter, not harder. Built on the proven synergy of three advanced indicators, Gold Indicator focuses exclusively on medium and long-term trends eli
Introduction Harmonic Patterns are best used to predict potential turning point. Traditionally, Harmonic Pattern was identified manually connecting peaks and troughs points in the chart. Manual harmonic pattern detection is painfully tedious and not suitable for everyone. You are often exposed under subjective pattern identification with manual pattern detection. To avoid these limitations, Harmonic Pattern Plus was designed to automate your harmonic pattern detection process. The functionality
Pips Stalker
Abdulkarim Karazon
5 (2)
The Pips Stalker is a long short arrow type indicator, the indicator helps traders of all levels to take better decisions trading the market,the indicator never repaints and uses RSI as main signal logic, once an arrow is given it will never repaint or back paint and arrows are not delayed. MAIN GOLD SET FILE <----Click to see. MT5 Version <---- FEATURES OF THE PIPS STALKER ARROW : STATS PANEL a unique info dashboard that shows overall win rate % and useful stats such as max win and lost trades
CRT Multi-Timeframe Market Structure & Liquidity Sweep Indicator Non-Repainting | Multi-Asset | MT5 Version Available MT5 Version:   https://www.mql5.com/en/market/product/162075 Full User Guide — explains what each feature does and why:   https://www.mql5.com/en/blogs/post/767525 Quick Start User Guide  — explains how to configure and in what order:  https://www.mql5.com/en/blogs/post/767540 Indicator Overview CRT Ghost Candle HTF Fractal is a complete institutional-grade market structure too
Meravith
Ivan Stefanov
5 (3)
Market makers' tool. Meravith will: Analyze all timeframes and display the current trend in force. Highlight liquidity zones (volume equilibrium) where bullish and bearish volumes are equal. Display all liquidity levels across different timeframes directly on your chart. Generate and present text-based market analysis for your reference. Calculate targets, support levels, and stop-loss points based on the current trend. Compute the risk/reward ratio for your trades. Determine position size accor
Apollo Secret Trend is a professional trend indicator which can be used to find trends on any pair and time frame. The indicator can easily become your primary trading indicator which you can use to detect market trends no matter what pair or time frame you prefer to trade. By using a special parameter in the indicator you can adapt the signals to your personal trading style. The indicator provides all types of alerts including PUSH notifications. The signals of the indicator DO NOT REPAINT! In
More from author
This indicator is based on a classic  DeMarker indicator. Multi TimeFrame indicator MTF-DeMarker shows data from the 4 timeframes by your choice. By default this indicator has external parameters: TF1 = 1; TimeFrame2b = true; TF2 = 5; TimeFrame3b = true; TF3 = 15; TimeFrame4b = true; TF4 = 60; InpPeriod = 14; You can change TF1-TF4 in the next limits: TF1 from M1 (1) to H4 (240) TF2 from M5 (5) to D1 (1440) TF3 from M15 (15) to W1 (10080) TF4 from M30 (30) to MN1 (43200) All chosen TFs should be
This is a self-explanatory indicator - do nothing when the current price in the "fence" (flat) mode. Definition of a flat market: A market price that is neither Up nor Down. The input parameter  counted_bars  determines on how many bars the indicator's lines will be visible starting from the current Bar backward. The input parameter  barsNum  is used as a Period for aqua "fence" calculation.
This Multi TimeFrame indicator is based on the "Fractals" classical indicator. 2 Inputs: TimeFrame1; TimeFrame2; You can put any available TimeFrame values (from M1 (Period_M1) to MN1 (Period_MN1)) equal or greater ( >= ) than the Period of the current Time Frame. The last Fractals will shown as color lines (Dots Line) of Support and Resistance for the Price moving.
This is a Multi-Time indicator which allows to display RSI and Stochastic indicators from upper timeframes on a single chart. As an example: a single chart EURUSD M5 and RSI (blue line) and Stochastic (yellow line) from H1. Red Histogram is representing Lower trend and Green Histogram is representing Upper trend.
When you put this Multi TimeFrame Parabolic SAR indicator on the chart it will automatically use Parabolic SAR from next available 3 timeframes. Green arrow will show the beginning of Up trend and Red arrow will show the beginning of Down trend. If AlertsEnabled = true, the indicator will show the Alert (message window) with a text like this: "Price going Down on ", Symbol(), " - ", Period(), " min", " price = ", Bid; If eMailEnabled = true the Indicator will send you an eMail with the same text
The zero line is characterized the Flat trend. V-shaped impulse indicates the entrance to the opposite direction. U-shaped impulse = entry orders in the same direction. If AlertsEnabled = true, the indicator will show the Alert (message window) with a text like this: "Price going Down on ", Symbol(), " - ", Period(), " min", " price = ", Bid; If eMailEnabled = true the indicator will send you an eMail with the same text an Alert message with subject: "Trinity-Impolse" (of course you have to chec
The indicator displays the usual Moving Average with input parameters: maPeriod_1; maMethod_1; maAppPrice_1. Then it calculates and displays MA on MA1 with input parameters: maPeriod_2; maMethod_2. Then it calculates and displays MA on MA2 with input parameters: maPeriod_3; maMethod_3. If AlertsEnabled = true the Indicator will show the Alert (message window) with a text like this: "Price going Down on ", Symbol(), " - ", Period(), " min", " price = ", Bid; If eMailEnabled = true the Indicator w
Multi TimeFrame Indicator "MTF CCI Trigger" based on the Commodity Channel Index from the upper TF (input parameter "TimeFrame") yellow line. Aqua line is representing ATR envelopes from the current TF. Green and Red arrows is triggered by CCI and represented UP and DOWN trends accordingly.
The BBImpulse indicator is based on the standard Moving Average indicator. You have MA input parameters: maPeriod - Moving Average period; maMODE - Moving Average mode (0 = MODE_SMA; 1 = MODE_EMA; 2 = MODE_SMMA; 3 = MODE_LWMA); maPRICE - Applied price (0=PRICE_CLOSE; 1=PRICE_OPEN; 2=PRICE_HIGH; 3=PRICE_LOW; 4=PRICE_MEDIAN; 5=PRICE_TYPICAL; 6=PRICE_WEIGHTED). Green Histogram is representing an UP-trend, Red Histogram is representing a Down-trend.
Multi TimeFrame indicator MTF ADX with Histogram shows ADX indicator data from the TF by your choice. You may choose a TimeFrame equal or greater than current TF. Yellow line is representing a price trend from the upper TF. Green line is representing +DI from the upper TF. Red line is representing -DI from the upper TF. Green histogram is displaying an Up-trend. Red histogram is displaying a Down-trend.
This Indicator creates 2 white lines based on Exponential Moving Averag e of High and Low prices. You can regulate how many bars will be involved in the calculation with input parameter HL_Period. Red and Blue arrows are displaying the moment to go Short and Long trades accordingly.
The most common way to interpreting the price Moving Average is to compare its dynamics to the price action. When the instrument price rises above its Moving Average, a buy signal appears, if the price falls below its moving average, what we have is a sell signal. To avoid a spontaneous entries one may use this update from Moving Average Indicator = Stepper-MA.
Envelopes technical Indicator is formed with two Moving Averages one of which is shifted upward and another one is shifted downward. Envelopes define the upper and the lower margins of the price range. Signal to sell appears when the price reaches the upper margin of the band; signal to buy appears when the price reaches the lower margin. To avoid a spontaneous entries one may use this update from Envelopes Indicator = Envelopes-Stepper.
The interpretation of the Bollinger Bands is based on the fact that the prices tend to remain in between the top and the bottom line of the bands. Abrupt changes in prices tend to happen after the band has contracted due to decrease of volatility; If prices break through the upper band, a continuation of the current trend is to be expected; If the pikes and hollows outside the band are followed by pikes and hollows inside the band, a reverse of trend may occur; The price movement that has starte
Fibonacci sequence is defined by integer sequence: 0, 1, 1, 2, 3, 5, 8, 13, 34, 55, 89, 144, ... By definition, it starts from 0 and 1, the next number is calculated as a sum of two previous numbers. Instead of the standard moving average, the indicator uses the caluclation of average price in form: Bar0 + Bar1 + Bar2 + Bar3 + Bar5 + Bar8 + Bar13 +... Input parameters:  FiboNumPeriod (15) - Fibonacci period; nAppliedPrice (0) - applied price (PRICE_CLOSE=0; PRICE_OPEN=1; PRICE_HIGH=2; PRICE_LOW=
This indicator present a main Moving Average line with input parameters maPeriod_1, maMethod_1 and maAppPrice_1. The second line will be a calculation of the Moving Average data of a first line with input parameters maPeriod_2, maMethod_2. The third line will be a calculation of the Moving Average data of a second line with input parameters maPeriod_3, maMethod_3. To avoid a spontaneous entries one may use this indicator-stepper.
This indicator (as almost all others) is based on classical Moving Averages. It shows the Average Bar under the current bar colored in aqua or over the current bar colored in orange. Input Parameters: ma_Period and ma_Method. The Average Bar maybe helpful to predict where the price will move in the nearest future. Of course, this "near future" depends of the current time frame.
Buy when the market is falling and sell when the market is rising. When the market is moving down you start observing and looking for buy signals. When the market is moving up you start looking for sell signals. This indicator points to the moments to Buy (Blue arrow) and to Sell (Orange arrow). Two input parameters: barsNumber and step for optimization (depending on symbol and Time Frame).
This indicator shows: A green light in case the price goes up; A red light in case the price goes down; A yellow light in case there are a sideways trend. A sideways trend is the horizontal price movement that occurs when the forces of supply and demand are nearly equal. This typically occurs during a period of consolidation before the price continues a prior trend or reverses into a new trend
This indicator is created for M1 timeframe. It shows how many ticks has occurred during current minute and ( after the slash) the sum of points Up (aqua color) and Down (orange color). In times of a high trading activity a grow up number of ticks Up and Down will signal of a big move of the price in the near future. In times of a high trading activity a grow up number of sum of points Up and Down will signal of a big move of the price in the near future too.
Two yellow lines. This is similar to classical Envelopes but with automatic deviation. The Envelopes indicator is   a tool that attempts to identify the upper and lower bands of a trading range. Aqua line. This is a classical Commodity Channel Index added to the Envelopes on the chart, not in a separate window. The Commodity Channel Index ( CCI ) is a technical   indicator   that measures the difference between the current price and the historical average price.
Probability deals with the likelihood of an event happening.   Forex   probability indicates a possibility at a specific time. This is because the forex market is highly volatile, and predicting future events affecting it is impossible. This indicator will show a positive number above the current High or negative number under the current Low as a probability of the trend. Higher time frames usually show a higher probability, even more then 100%.
Envelopes is an excellent indicator when the market is trending. Open Long position when the ClosePrice crossed the upper Aqua band. Close Long position when the Price crossed the upper Yellow band moving down. Open Short position when the ClosePrice crossed the lower Aqua band. Close Short position when the Price crossed the lower Yellow band moving up.
Moving Average Bars is a self-explanatory indicator with one input parameter: nPeriod. When the previous Price Close is above the previous indicator Bar, the probability to go Long is very high.   When the previous Price Close is under the previous indicator Bar, the probability to go Short is very high.
This indicator is based on the same idea as https://www.mql5.com/en/market/product/2406 , but instead of Average Bars it uses series or Fibonacci sequence. When the previous Price Close is above the previous indicator Bar, the probability to go Long is very high. When the previous Price Close is under the previous indicator Bar, the probability to go Short is very high.
This indicator is based on two ideas: Correlations between 5 main currency pairs: EURUSD, GBPUSD, USDCHF, USDJPY, USDCAD; US Dollar Index = the value of the United States dollar relative to a basket of foreign currencies. The use of the indicator is the same as classical  Commodity Channel Index  (CCI) indicator. CCI is calculated with the following formula:  (Typical Price - Simple Moving Average) / (0.015 x Mean Deviation) (Typical Price - Simple Moving Average) / (0.015 x Mean Deviation)
A  tick  is a measure of the minimum upward or downward movement in the  price  of a security. A  tick  can also refer to the change in the  price  of a security from one trade to the next trade.  This indicator will show amounts of ticks when the price goes up and down. This indicator is designed for M1 time frame and shows: Sum of points when the price goes up (Green Histogram). Sum of points when the price goes down (Red Histogram). 
This indicator is a combination of 2 classical indicators MA and RVI. The Relative Vigor Index (RVI) is a momentum indicator used in technical analysis that measures the strength of a trend by comparing a security's closing price to its trading range while smoothing the results using a simple moving average   The input parameter  counted_bars  determines how many bars the indicator's lines will be visible. The input parameter MaRviPeriod  is used for MA and RVI calculation.
This indicator is a combination of 2 classical indicators: MA and CCI. Two moving averages form Upper and Lower bands. The input parameter  counted_bars  determines on how many bars the indicator's lines will be visible. The input parameter  barsNum  is used for MA and CCI calculation.
This indicator is using 2 classical indicators: Commodity Channel Index from the higher TF (which you may change using input parameter TimeFrame ) and Average True Range from the current TF. The Green ribbon indicates the upper trend and the Red ribbon indicates the down trend. Buy when the Yellow line crosses the Upper bound (Aqua line). Sell when the Yellow line crossover the Lower bound (Aqua line).
Filter:
No reviews
Reply to review