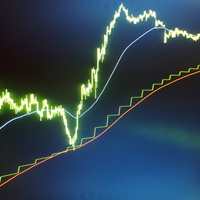
FXEA365 Donchian ATR Trailing Stop MT4
- Indicators
-
Kenichiro Sakamoto
 I'm Kenichiro Sakamoto, the developer behind FXEA365 — a studio building transparent, rule-based Expert Advisors for MetaTrader 5.
 - Version: 2.1
- Updated: 20 September 2026
FREE — the Donchian breakout channel and the ATR trailing stop that manages the trade after the break, drawn on one chart.
100% free, no limitations. If it earns a place on your charts, a short review is the one thing that helps us most — it takes 30 seconds and it is what lets other traders find this tool.
Platform: MetaTrader 4 (this page). MetaTrader 5 edition: https://www.mql5.com/en/market/product/185547
Most breakout indicators show you the entry and stop there. The hard part of trend following is what happens next: where the stop goes, when it ratchets, and when the move is over. This one draws both halves of the system.
=== WHAT IT DRAWS ===
- Donchian channel (upper and lower) over the last N closed bars.
- Gold arrows where a bar CLOSED beyond the channel — the moment a breakout system would actually enter.
- The ATR trailing stop that would then carry the position: green while long, red while short, dotted. It only ever moves toward price (it never loosens), and it disappears when price closes through it — that is where the trade would end.
=== NO REPAINTING ===
The channel is built from bars that are already closed, and the breakout is judged on the previous bar's close. Nothing is drawn from the forming bar, so an arrow that appears never disappears later. You can scroll back and trust what you see.
=== SETTINGS ===
- N_Channel (default 40): channel length in bars.
- Trail_ATR (default 8.0): trailing distance as a multiple of ATR.
- ATR_Period (default 14).
- ShowArrows: turn the breakout markers on or off.
Defaults are a USDJPY H1 configuration. A breakout length that suits one market rarely transfers to another — re-fit N_Channel and Trail_ATR on the instrument you trade.
=== HONEST NOTE ===
This is a visualisation tool, not a signal service. Breakout trend following has a win rate well below 50%: many small losses, a few large winners. It works in trending markets and bleeds in ranges. Watch how the arrows and the trailing stop behave on your instrument before you trade the idea.
=== WHO THIS IS FOR / NOT FOR ===
Right fit: breakout traders who want to see the exit as well as the entry, anyone tuning a Donchian system who needs to watch how the ATR trail behaves across a real move, and anyone who wants to know what a trend system would have done on their instrument before committing to it.
Not a fit: range and mean-reversion traders, anyone who needs a high win rate to stay with a method, and anyone who will run the defaults on a market they were never fitted to.
=== 5-MINUTE CHART CHECK ===
1) Open USDJPY H1 first — that is the configuration the defaults describe.
2) Find a gold arrow and confirm the bar CLOSED beyond the channel, not merely touched it. Wicks through the channel do not count.
3) Follow the dotted trailing stop from that arrow forward. It must only ever move toward price and never loosen, and it must end where price closed through it. That endpoint is where the trade would have finished.
4) Pick the largest move on the chart and note how much of it the trail gave back at the end. That giveback is the cost of staying in trends — it is not a flaw to be tuned away.
5) Switch to your own instrument and re-fit N_Channel and Trail_ATR. A breakout length that suits one market rarely transfers to another.
Breakout trend following wins well under half its trades: many small losses, a few large winners. It bleeds in ranges.
=== THE SAME LOGIC AS AN EA (also free) ===
Donchian Trend Engine — the Expert Advisor that trades exactly this: closed-bar breakout, hard stop-loss on every trade, ATR trailing stop, one position, no martingale and no grid.
MT5: https://www.mql5.com/en/market/product/185534
MT4: https://www.mql5.com/en/market/product/185537
More free tools from us (FXEA365):
- Donchian Trend Engine MT4 (EA): https://www.mql5.com/en/market/product/185537
- Crypto Trend Channel Donchian MT4 (indicator): https://www.mql5.com/en/market/product/185645
- Pivot Trend ZigZag Swing MT4 (indicator): https://www.mql5.com/en/market/product/185646
- Dip Buyer Zones RSI Pullback MT4 (indicator): https://www.mql5.com/en/market/product/185649
- Volatility Squeeze BB Keltner MT4 (indicator): https://www.mql5.com/en/market/product/187033
Our other free tools: https://www.mql5.com/en/users/app.develop.sk/seller
Full write-up — why the trailing stop matters more than the entry: https://www.mql5.com/en/blogs/post/773438
=== IF YOU WANT THIS AS AN AUTOMATED SYSTEM ===
This indicator shows the idea; it does not trade. If you want the same kind of rule executed automatically on gold, with a stop on every position group and figures you can reproduce in the Strategy Tester yourself, this is the EA we built for it:
- Gold Viper Breakout MT4 (XAUUSD M30): https://www.mql5.com/en/market/product/182520
The MetaTrader 4 build of our gold breakout EA: same core entry logic, a group stop on every basket, no martingale. Our published figures were measured on the MetaTrader 5 build; the MT4 build will differ, so compare on its own page before you decide.
Every EA above has a free demo. Run it in the Strategy Tester with the settings listed at the top of its page before you decide. These are backtest figures, not live trading results, and they do not guarantee future performance.
If this tool is useful in your trading, a short review on this page would help, good or bad, including anything you would like improved. It helps other traders decide and tells us what to fix next.
100% free, no limitations. If it earns a place on your charts, a short review is the one thing that helps us most — it takes 30 seconds and it is what lets other traders find this tool.
Platform: MetaTrader 4 (this page). MetaTrader 5 edition: https://www.mql5.com/en/market/product/185547
Most breakout indicators show you the entry and stop there. The hard part of trend following is what happens next: where the stop goes, when it ratchets, and when the move is over. This one draws both halves of the system.
=== WHAT IT DRAWS ===
- Donchian channel (upper and lower) over the last N closed bars.
- Gold arrows where a bar CLOSED beyond the channel — the moment a breakout system would actually enter.
- The ATR trailing stop that would then carry the position: green while long, red while short, dotted. It only ever moves toward price (it never loosens), and it disappears when price closes through it — that is where the trade would end.
=== NO REPAINTING ===
The channel is built from bars that are already closed, and the breakout is judged on the previous bar's close. Nothing is drawn from the forming bar, so an arrow that appears never disappears later. You can scroll back and trust what you see.
=== SETTINGS ===
- N_Channel (default 40): channel length in bars.
- Trail_ATR (default 8.0): trailing distance as a multiple of ATR.
- ATR_Period (default 14).
- ShowArrows: turn the breakout markers on or off.
Defaults are a USDJPY H1 configuration. A breakout length that suits one market rarely transfers to another — re-fit N_Channel and Trail_ATR on the instrument you trade.
=== HONEST NOTE ===
This is a visualisation tool, not a signal service. Breakout trend following has a win rate well below 50%: many small losses, a few large winners. It works in trending markets and bleeds in ranges. Watch how the arrows and the trailing stop behave on your instrument before you trade the idea.
=== WHO THIS IS FOR / NOT FOR ===
Right fit: breakout traders who want to see the exit as well as the entry, anyone tuning a Donchian system who needs to watch how the ATR trail behaves across a real move, and anyone who wants to know what a trend system would have done on their instrument before committing to it.
Not a fit: range and mean-reversion traders, anyone who needs a high win rate to stay with a method, and anyone who will run the defaults on a market they were never fitted to.
=== 5-MINUTE CHART CHECK ===
1) Open USDJPY H1 first — that is the configuration the defaults describe.
2) Find a gold arrow and confirm the bar CLOSED beyond the channel, not merely touched it. Wicks through the channel do not count.
3) Follow the dotted trailing stop from that arrow forward. It must only ever move toward price and never loosen, and it must end where price closed through it. That endpoint is where the trade would have finished.
4) Pick the largest move on the chart and note how much of it the trail gave back at the end. That giveback is the cost of staying in trends — it is not a flaw to be tuned away.
5) Switch to your own instrument and re-fit N_Channel and Trail_ATR. A breakout length that suits one market rarely transfers to another.
Breakout trend following wins well under half its trades: many small losses, a few large winners. It bleeds in ranges.
=== THE SAME LOGIC AS AN EA (also free) ===
Donchian Trend Engine — the Expert Advisor that trades exactly this: closed-bar breakout, hard stop-loss on every trade, ATR trailing stop, one position, no martingale and no grid.
MT5: https://www.mql5.com/en/market/product/185534
MT4: https://www.mql5.com/en/market/product/185537
More free tools from us (FXEA365):
- Donchian Trend Engine MT4 (EA): https://www.mql5.com/en/market/product/185537
- Crypto Trend Channel Donchian MT4 (indicator): https://www.mql5.com/en/market/product/185645
- Pivot Trend ZigZag Swing MT4 (indicator): https://www.mql5.com/en/market/product/185646
- Dip Buyer Zones RSI Pullback MT4 (indicator): https://www.mql5.com/en/market/product/185649
- Volatility Squeeze BB Keltner MT4 (indicator): https://www.mql5.com/en/market/product/187033
Our other free tools: https://www.mql5.com/en/users/app.develop.sk/seller
Full write-up — why the trailing stop matters more than the entry: https://www.mql5.com/en/blogs/post/773438
=== IF YOU WANT THIS AS AN AUTOMATED SYSTEM ===
This indicator shows the idea; it does not trade. If you want the same kind of rule executed automatically on gold, with a stop on every position group and figures you can reproduce in the Strategy Tester yourself, this is the EA we built for it:
- Gold Viper Breakout MT4 (XAUUSD M30): https://www.mql5.com/en/market/product/182520
The MetaTrader 4 build of our gold breakout EA: same core entry logic, a group stop on every basket, no martingale. Our published figures were measured on the MetaTrader 5 build; the MT4 build will differ, so compare on its own page before you decide.
Every EA above has a free demo. Run it in the Strategy Tester with the settings listed at the top of its page before you decide. These are backtest figures, not live trading results, and they do not guarantee future performance.
If this tool is useful in your trading, a short review on this page would help, good or bad, including anything you would like improved. It helps other traders decide and tells us what to fix next.