FXEA365 Spread Guard Live Spread MT4
- Indicators
-
Kenichiro Sakamoto
 I'm Kenichiro Sakamoto, the developer behind FXEA365 — a studio building transparent, rule-based Expert Advisors for MetaTrader 5.
 - Version: 10.1
- Updated: 20 September 2026
FREE — see your spread the way your backtest never showed it: per bar, against its own average, and against a ceiling you set.
100% free, no limitations. If it earns a place on your charts, a short review is the one thing that helps us most — it takes 30 seconds and it is what lets other traders find this tool.
Platform: MetaTrader 4 (this page). MetaTrader 5 edition: https://www.mql5.com/en/market/product/185748
Most people filter their entries on indicators. In my own testing, almost every "smart" filter I added to a trend system made it worse — it removed losing trades, but it also removed some of the breakouts that turned into the big winners, and net profit fell. The one filter that consistently paid for itself was a spread ceiling. That one is not a market filter at all: it removes trades that were never profitable to begin with, because the cost of entry ate the edge before the trade started.
To use that filter, you first have to see what your spread actually does. That is all this indicator is for.
=== WHAT IT DRAWS ===
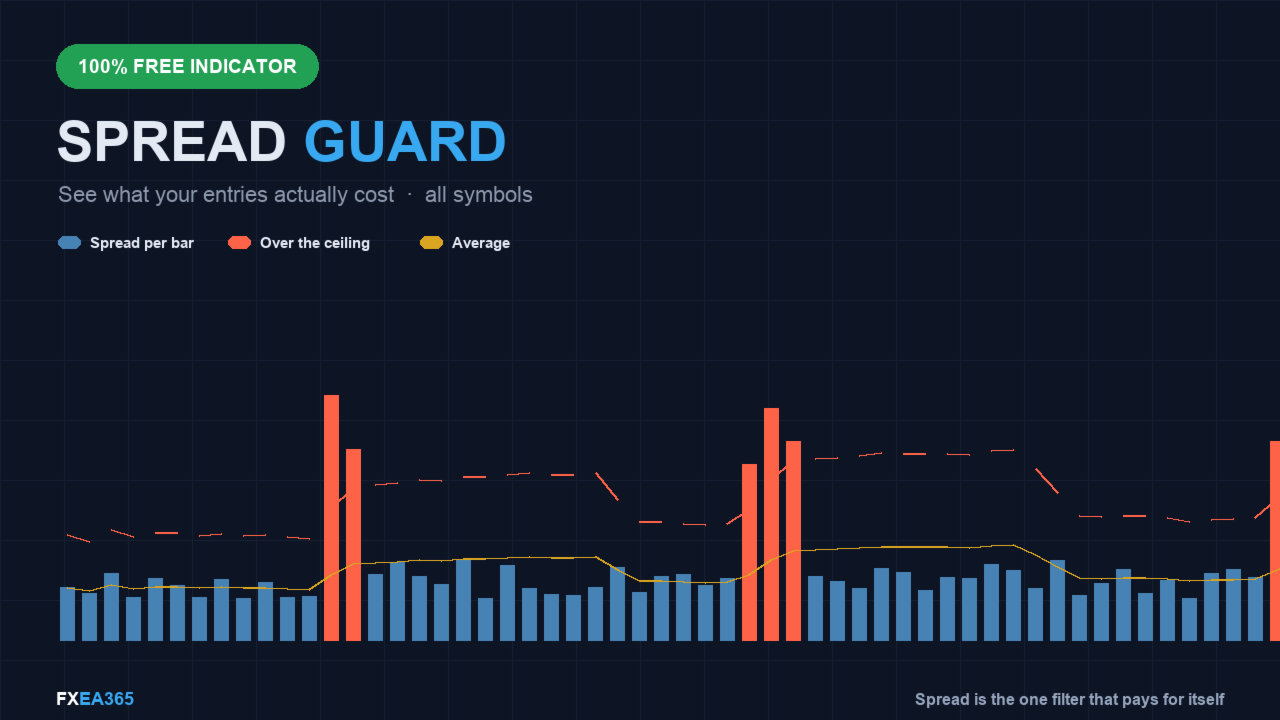
- A histogram of the spread, in points, for every bar.
- The moving average of the spread over the last N bars — your instrument's "normal".
- A ceiling line: either a fixed number of points that you choose, or a multiple of the average.
- Every bar whose spread exceeded the ceiling is coloured red. Those are the bars where entering cost you more than it should have.
- A panel showing the current spread, the average and the ceiling, so you can see at a glance whether now is a bad moment to enter.
=== WHAT YOU WILL PROBABLY FIND ===
Spread is not constant, and it is not random. It widens around the session rollover, around high-impact news, at the Friday close and the Monday open, and on thin instruments during the Asian session. If your strategy happens to trade at those moments, a fraction of your edge is being handed to the broker before the position even opens — and a backtest run on average spread will never tell you.
=== SETTINGS ===
- Avg_Period (default 100): how many bars to average the spread over.
- MaxSpreadPts (default 0): a fixed ceiling in points. Set 0 to use the multiple below instead.
- Ceiling_Mult (default 2.0): the ceiling as a multiple of the average spread. 2.0 means "twice the normal spread is too much".
- ShowPanel: turn the on-chart panel on or off.
There is no universal correct ceiling. Watch your instrument for a few days, see where the red bars fall, and set the number so that it catches the blowouts and not the ordinary noise.
=== HONEST NOTES ===
This is a visualisation tool, not a signal. It will not tell you when to buy. It tells you when entering is expensive — which, for a system that trades often, matters more than most people think.
MT4 note: MetaTrader 4 does not store a per-bar spread in its history, so on MT4 the spread series is recorded live while the indicator runs. Bars that existed before you attached it show the current spread as a placeholder. The panel and the bars from now on are the part to trust. The MT5 version reads the real per-bar spread from history and is accurate on old bars too.
=== WHO THIS IS FOR / NOT FOR ===
Right fit: anyone running a system that trades often, where entry cost is a real share of the edge; anyone who has a spread-limit setting in an EA and has never known what number to put in it; and anyone whose live results are worse than the backtest and who has not yet checked whether spread explains the gap.
Not a fit: position traders holding for weeks, where a few points at entry make no difference, and anyone expecting buy or sell signals — this draws what your costs are doing and nothing else.
=== 5-MINUTE CHART CHECK ===
1) Attach it to the instrument and timeframe your EA actually trades. The spread profile of EURUSD tells you nothing about gold.
2) Look at the average line first. That is your instrument's normal cost — write the number down.
3) Find the red bars. Check when they fall: session rollover, the Friday close, the Monday open, high-impact news. If your strategy trades at those moments, that is where your edge is going.
4) Adjust Ceiling_Mult until red marks the genuine blowouts and not ordinary noise. There is no universal correct value — this step is the work.
5) Take that ceiling and put it into your EA's spread limit. That is what this tool is for.
On MT4, bars that existed before you attached the indicator show the current spread as a placeholder — MT4 stores no per-bar spread. Trust the panel and the bars from now on. The MT5 version is accurate on old bars too.
More free tools from us (FXEA365):
- Donchian Trend Engine MT4 (EA): https://www.mql5.com/en/market/product/185537
- Donchian ATR Trailing Stop MT4 (indicator): https://www.mql5.com/en/market/product/185552
- Crypto Trend Channel Donchian MT4 (indicator): https://www.mql5.com/en/market/product/185645
- Pivot Trend ZigZag Swing MT4 (indicator): https://www.mql5.com/en/market/product/185646
- Dip Buyer Zones RSI Pullback MT4 (indicator): https://www.mql5.com/en/market/product/185649
- Volatility Squeeze BB Keltner MT4 (indicator): https://www.mql5.com/en/market/product/187033
Our other free tools: https://www.mql5.com/en/users/app.develop.sk/seller
=== IF YOU WANT THIS AS AN AUTOMATED SYSTEM ===
This tool manages risk around trades; it does not open them. The EAs below have the same kind of protection built in, so you do not need to wire it up yourself:
- Gold Viper Breakout MT4 (XAUUSD M30): https://www.mql5.com/en/market/product/182520
The MetaTrader 4 build of our gold breakout EA: same core entry logic, a group stop on every basket, no martingale. Our published figures were measured on the MetaTrader 5 build; the MT4 build will differ, so compare on its own page before you decide.
Every EA above has a free demo. Run it in the Strategy Tester with the settings listed at the top of its page before you decide. These are backtest figures, not live trading results, and they do not guarantee future performance.
If this tool is useful in your trading, a short review on this page would help, good or bad, including anything you would like improved. It helps other traders decide and tells us what to fix next.
100% free, no limitations. If it earns a place on your charts, a short review is the one thing that helps us most — it takes 30 seconds and it is what lets other traders find this tool.
Platform: MetaTrader 4 (this page). MetaTrader 5 edition: https://www.mql5.com/en/market/product/185748
Most people filter their entries on indicators. In my own testing, almost every "smart" filter I added to a trend system made it worse — it removed losing trades, but it also removed some of the breakouts that turned into the big winners, and net profit fell. The one filter that consistently paid for itself was a spread ceiling. That one is not a market filter at all: it removes trades that were never profitable to begin with, because the cost of entry ate the edge before the trade started.
To use that filter, you first have to see what your spread actually does. That is all this indicator is for.
=== WHAT IT DRAWS ===
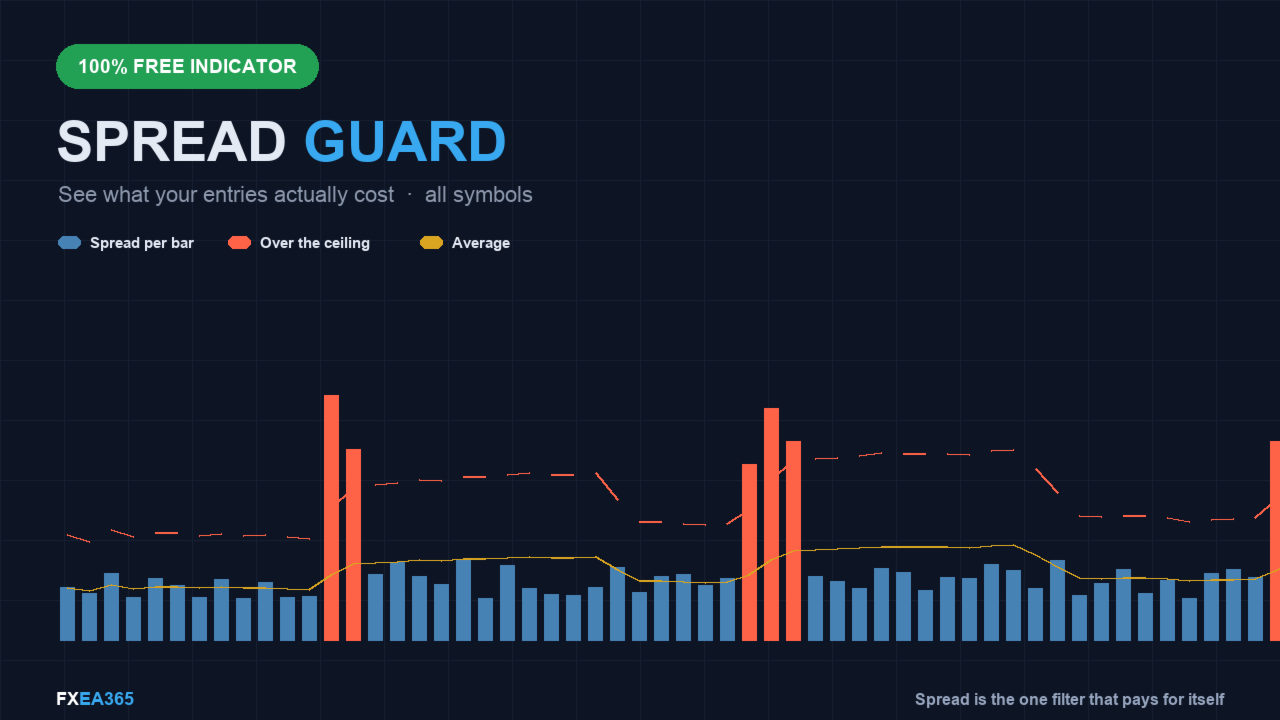
- A histogram of the spread, in points, for every bar.
- The moving average of the spread over the last N bars — your instrument's "normal".
- A ceiling line: either a fixed number of points that you choose, or a multiple of the average.
- Every bar whose spread exceeded the ceiling is coloured red. Those are the bars where entering cost you more than it should have.
- A panel showing the current spread, the average and the ceiling, so you can see at a glance whether now is a bad moment to enter.
=== WHAT YOU WILL PROBABLY FIND ===
Spread is not constant, and it is not random. It widens around the session rollover, around high-impact news, at the Friday close and the Monday open, and on thin instruments during the Asian session. If your strategy happens to trade at those moments, a fraction of your edge is being handed to the broker before the position even opens — and a backtest run on average spread will never tell you.
=== SETTINGS ===
- Avg_Period (default 100): how many bars to average the spread over.
- MaxSpreadPts (default 0): a fixed ceiling in points. Set 0 to use the multiple below instead.
- Ceiling_Mult (default 2.0): the ceiling as a multiple of the average spread. 2.0 means "twice the normal spread is too much".
- ShowPanel: turn the on-chart panel on or off.
There is no universal correct ceiling. Watch your instrument for a few days, see where the red bars fall, and set the number so that it catches the blowouts and not the ordinary noise.
=== HONEST NOTES ===
This is a visualisation tool, not a signal. It will not tell you when to buy. It tells you when entering is expensive — which, for a system that trades often, matters more than most people think.
MT4 note: MetaTrader 4 does not store a per-bar spread in its history, so on MT4 the spread series is recorded live while the indicator runs. Bars that existed before you attached it show the current spread as a placeholder. The panel and the bars from now on are the part to trust. The MT5 version reads the real per-bar spread from history and is accurate on old bars too.
=== WHO THIS IS FOR / NOT FOR ===
Right fit: anyone running a system that trades often, where entry cost is a real share of the edge; anyone who has a spread-limit setting in an EA and has never known what number to put in it; and anyone whose live results are worse than the backtest and who has not yet checked whether spread explains the gap.
Not a fit: position traders holding for weeks, where a few points at entry make no difference, and anyone expecting buy or sell signals — this draws what your costs are doing and nothing else.
=== 5-MINUTE CHART CHECK ===
1) Attach it to the instrument and timeframe your EA actually trades. The spread profile of EURUSD tells you nothing about gold.
2) Look at the average line first. That is your instrument's normal cost — write the number down.
3) Find the red bars. Check when they fall: session rollover, the Friday close, the Monday open, high-impact news. If your strategy trades at those moments, that is where your edge is going.
4) Adjust Ceiling_Mult until red marks the genuine blowouts and not ordinary noise. There is no universal correct value — this step is the work.
5) Take that ceiling and put it into your EA's spread limit. That is what this tool is for.
On MT4, bars that existed before you attached the indicator show the current spread as a placeholder — MT4 stores no per-bar spread. Trust the panel and the bars from now on. The MT5 version is accurate on old bars too.
More free tools from us (FXEA365):
- Donchian Trend Engine MT4 (EA): https://www.mql5.com/en/market/product/185537
- Donchian ATR Trailing Stop MT4 (indicator): https://www.mql5.com/en/market/product/185552
- Crypto Trend Channel Donchian MT4 (indicator): https://www.mql5.com/en/market/product/185645
- Pivot Trend ZigZag Swing MT4 (indicator): https://www.mql5.com/en/market/product/185646
- Dip Buyer Zones RSI Pullback MT4 (indicator): https://www.mql5.com/en/market/product/185649
- Volatility Squeeze BB Keltner MT4 (indicator): https://www.mql5.com/en/market/product/187033
Our other free tools: https://www.mql5.com/en/users/app.develop.sk/seller
=== IF YOU WANT THIS AS AN AUTOMATED SYSTEM ===
This tool manages risk around trades; it does not open them. The EAs below have the same kind of protection built in, so you do not need to wire it up yourself:
- Gold Viper Breakout MT4 (XAUUSD M30): https://www.mql5.com/en/market/product/182520
The MetaTrader 4 build of our gold breakout EA: same core entry logic, a group stop on every basket, no martingale. Our published figures were measured on the MetaTrader 5 build; the MT4 build will differ, so compare on its own page before you decide.
Every EA above has a free demo. Run it in the Strategy Tester with the settings listed at the top of its page before you decide. These are backtest figures, not live trading results, and they do not guarantee future performance.
If this tool is useful in your trading, a short review on this page would help, good or bad, including anything you would like improved. It helps other traders decide and tells us what to fix next.