Order flow footprint chart

4.4
  • Utilities
  • Abdul Jalil
    Abdul Jalil
    4.7 (13)
    I am a multidisciplinary creator and market technician, combining the visual clarity of a graphics designer with the analytical depth of a trader and trading‑tools developer. My work lives at the intersection of design, technology, and financial markets.
  • Version: 6.34
  • Updated: 27 February 2026
  • Activations: 5
Footprint Chart Pro — Professional OrderFlow EA for MetaTrader 5

Version 6.34 | Professional tool for real traders | Institutional-Grade Visualization

DEMO USERS - PLEASE SELECT EVERY TICK / REAL TICK WHEN TESTING AND YOU HAVE DOWNLOADED HISTORICAL DATA. IF YOU SEE A WAITING SCREEN AND IT IS NOT DOWNLOADING, IT MEANS YOU HAVE LOW HISTORICAL DATA. TRY 1 MIN AND 5 MIN FIRST ON 1 DAY DATA. ONE DAY DATA SHOULD BE THE NEWEST AND MOST CURRENT DATE. PLEASE WAIT UNTIL THE MARKET HAS ROLLED OVER PERIOD.


IMPORTANT - Recommended Price Bucket in Points for Pairs:


XAUUSD - 40 BTCUSD - 1000 UK100 - 30 DE40 - 100 CADJPY - 5
GBPUSD - 5 EURUSD - 5 US30 - 100 AUDCAD -5 EURGBP -3
GBPJPY - 10 USDCAD - 5 NAS100 - 100 AUDJPY - 5 EURJPY - 10
USDJPY - 10 USDCHF - 5 SP500 - 30 AUDUSD - 6 GBPCAD - 5

My Futures OrderFlow Footprint Chart: https://www.mql5.com/en/market/product/174307


Overview

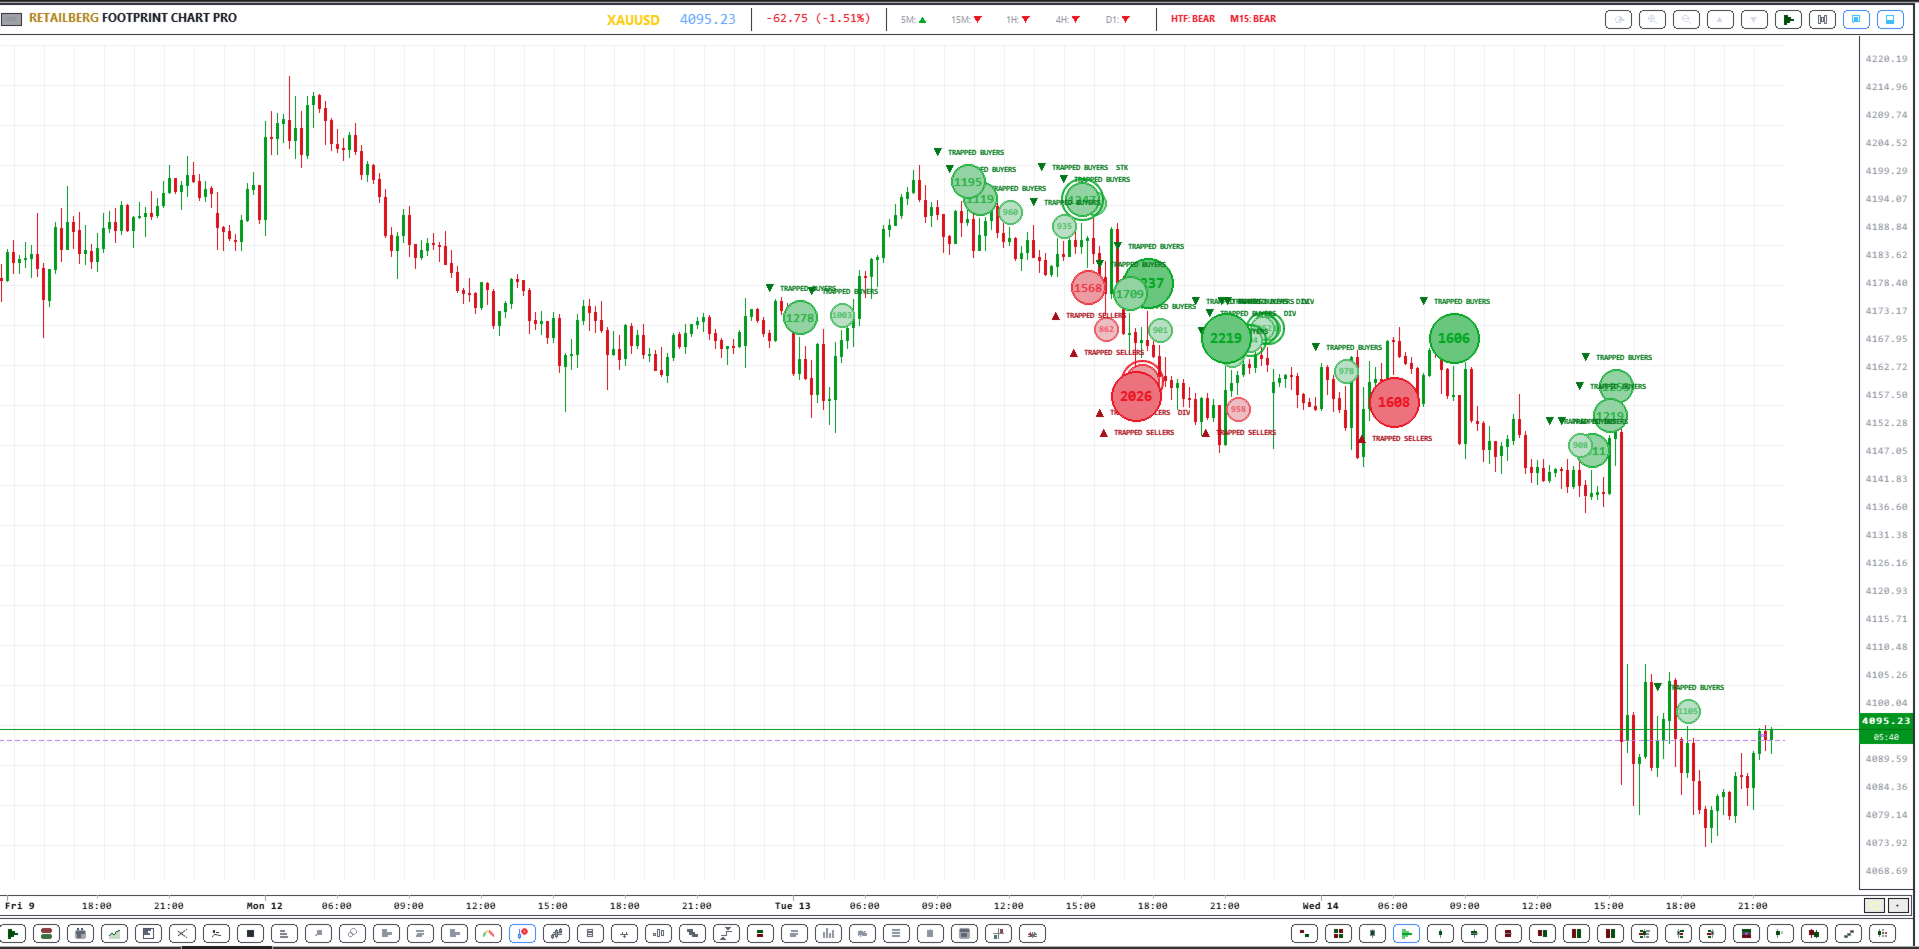
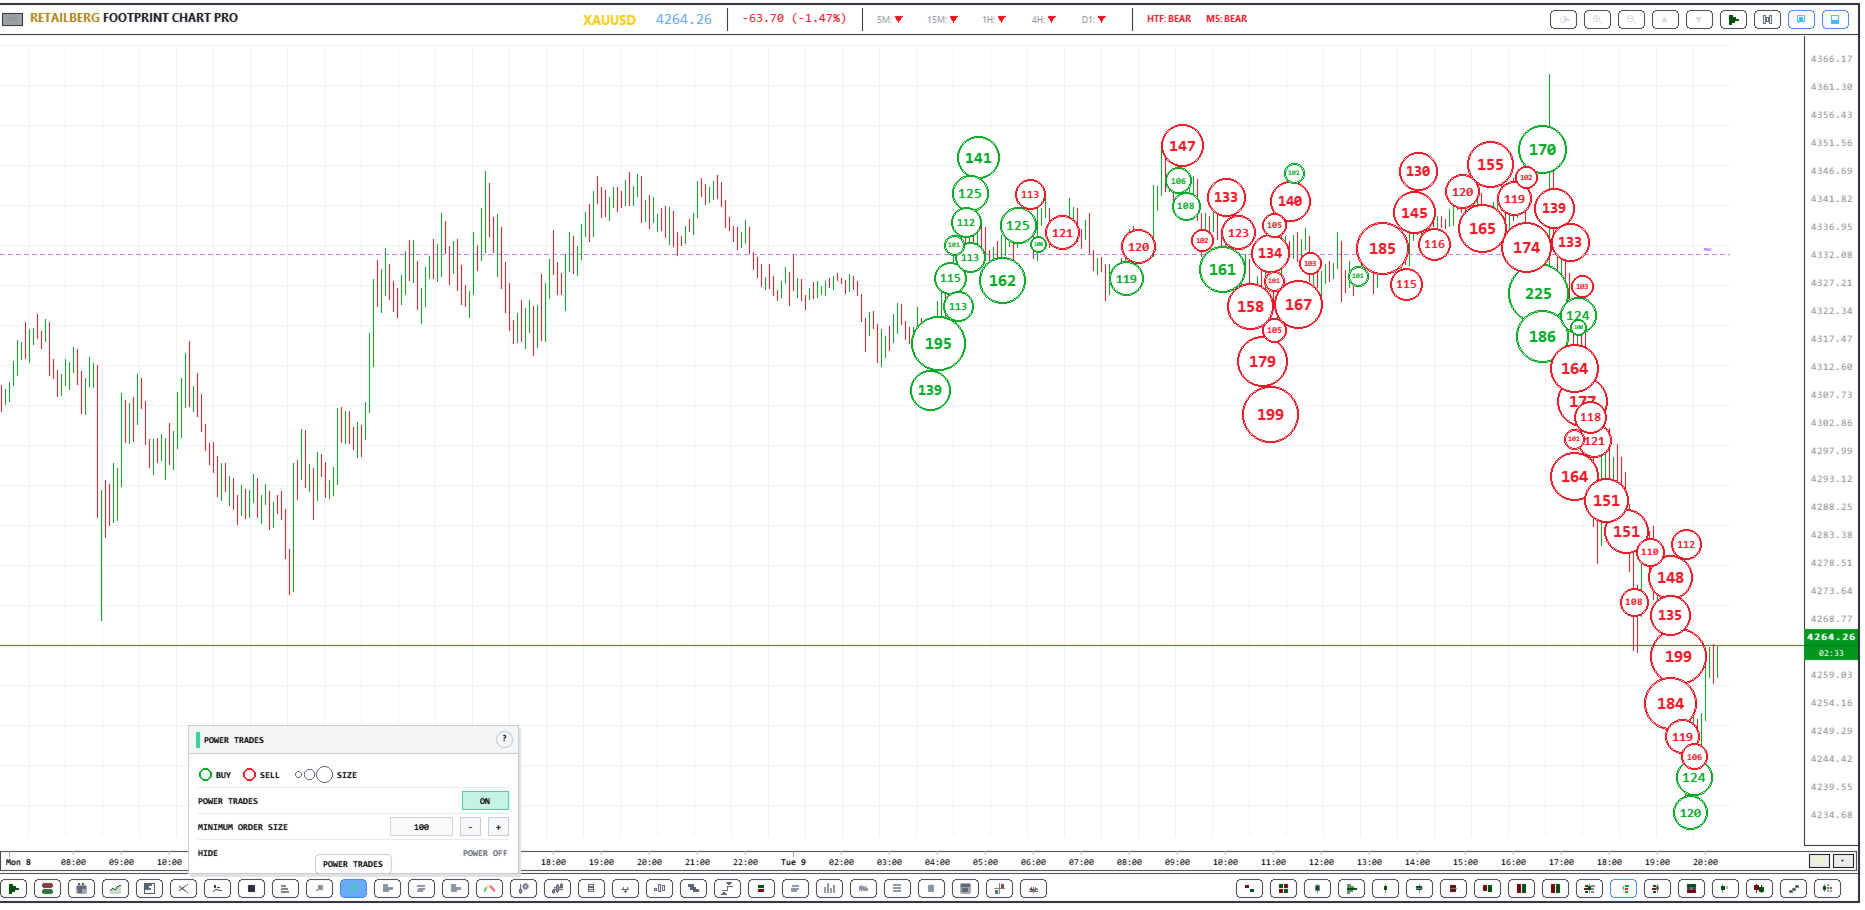
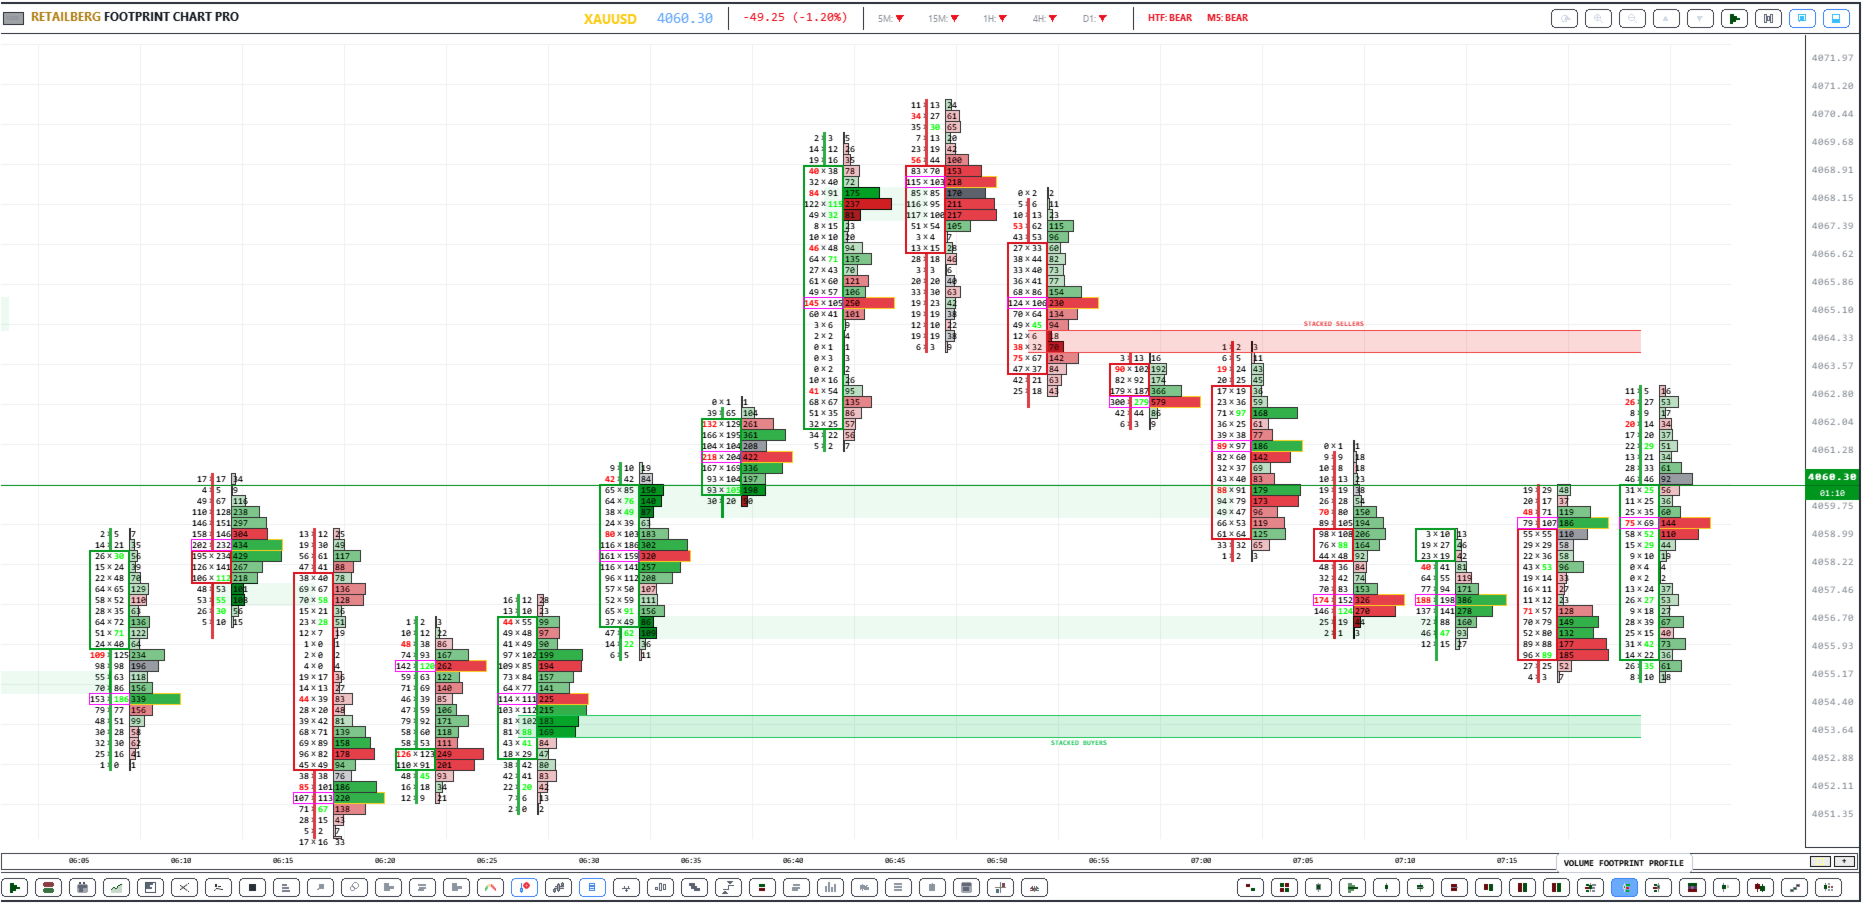
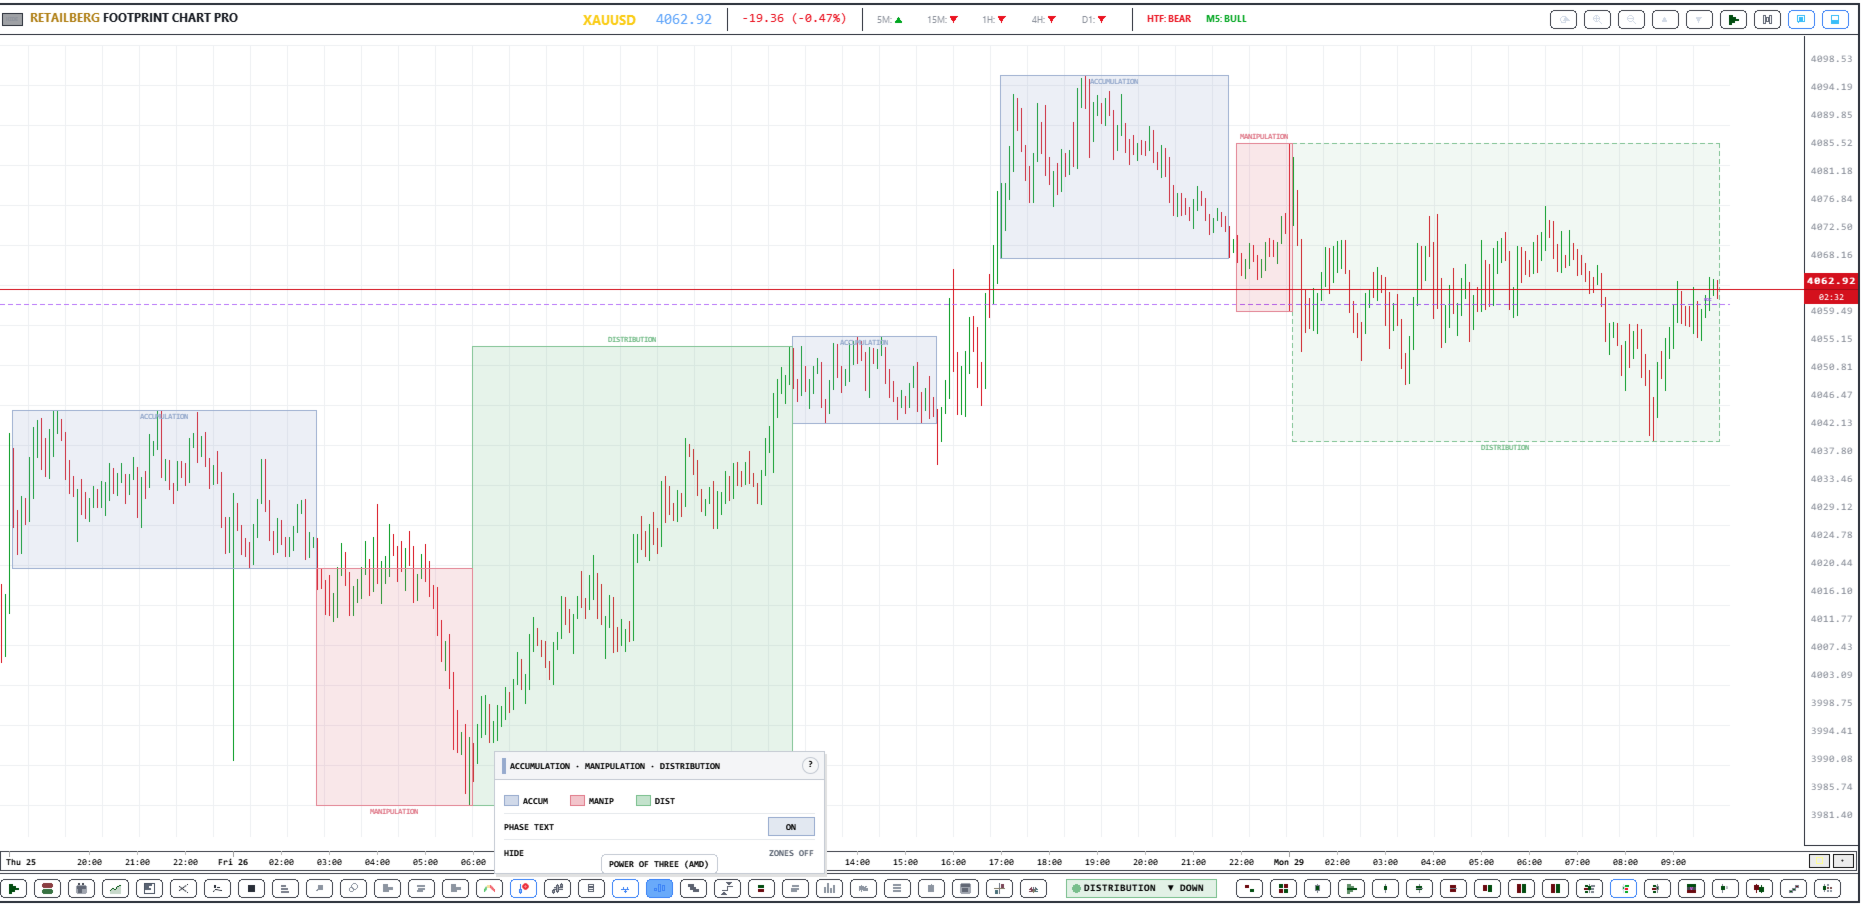
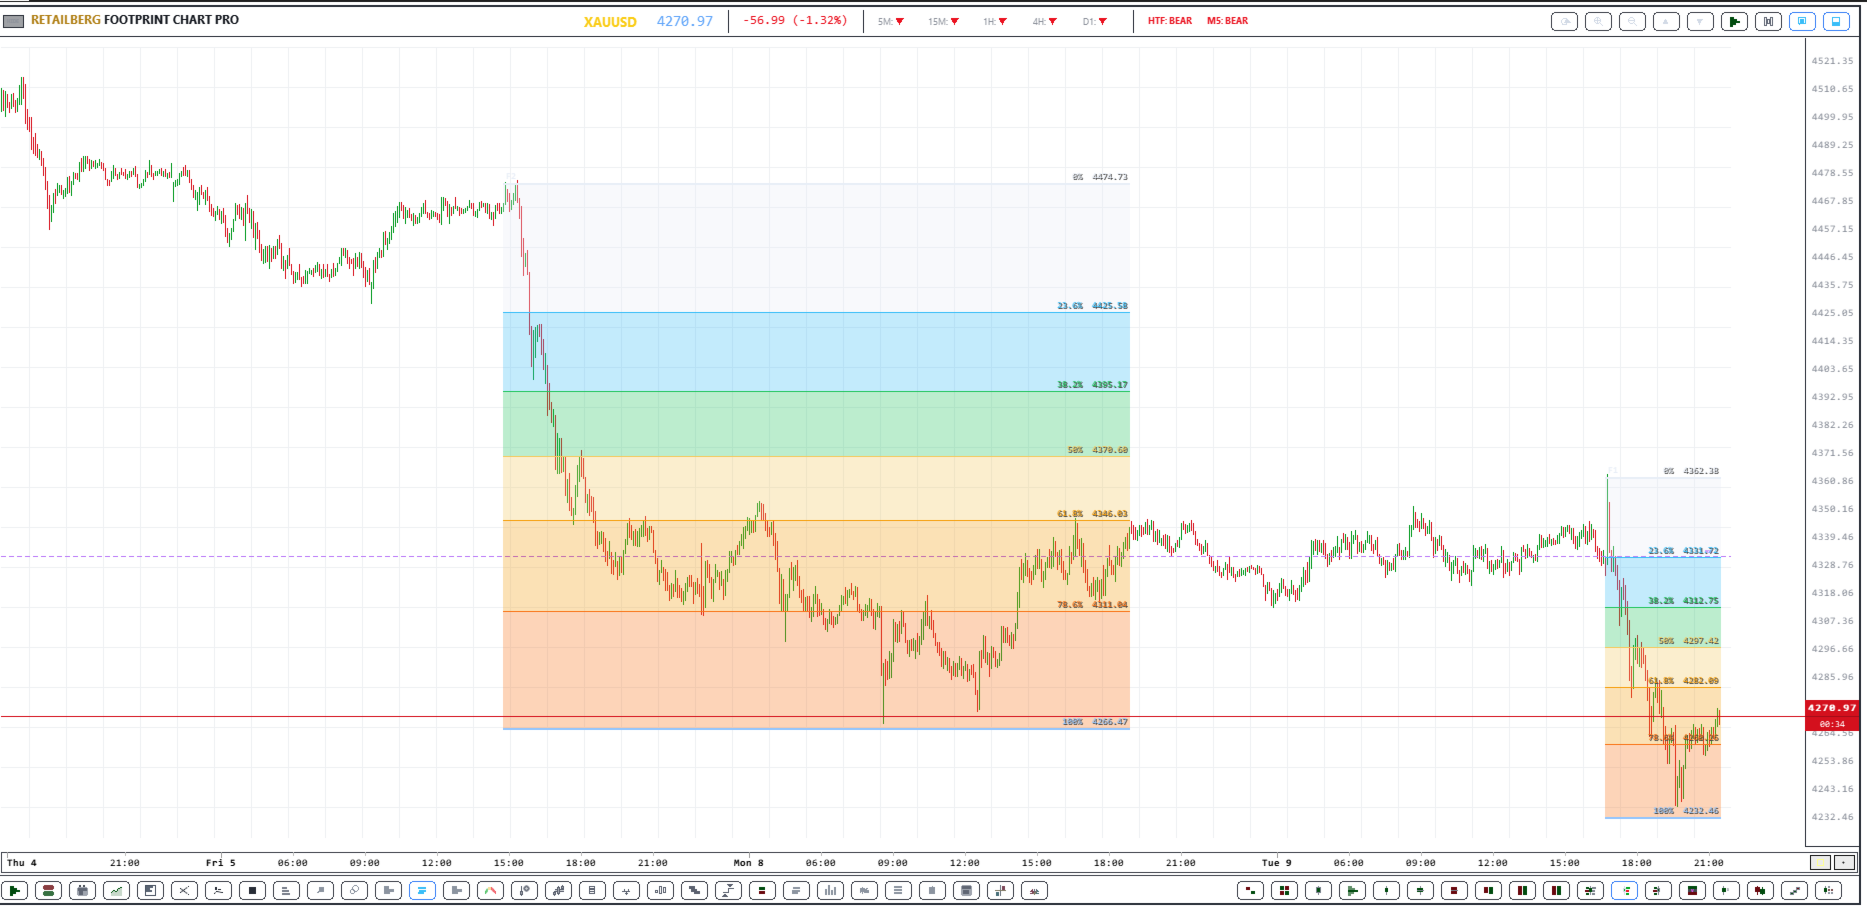
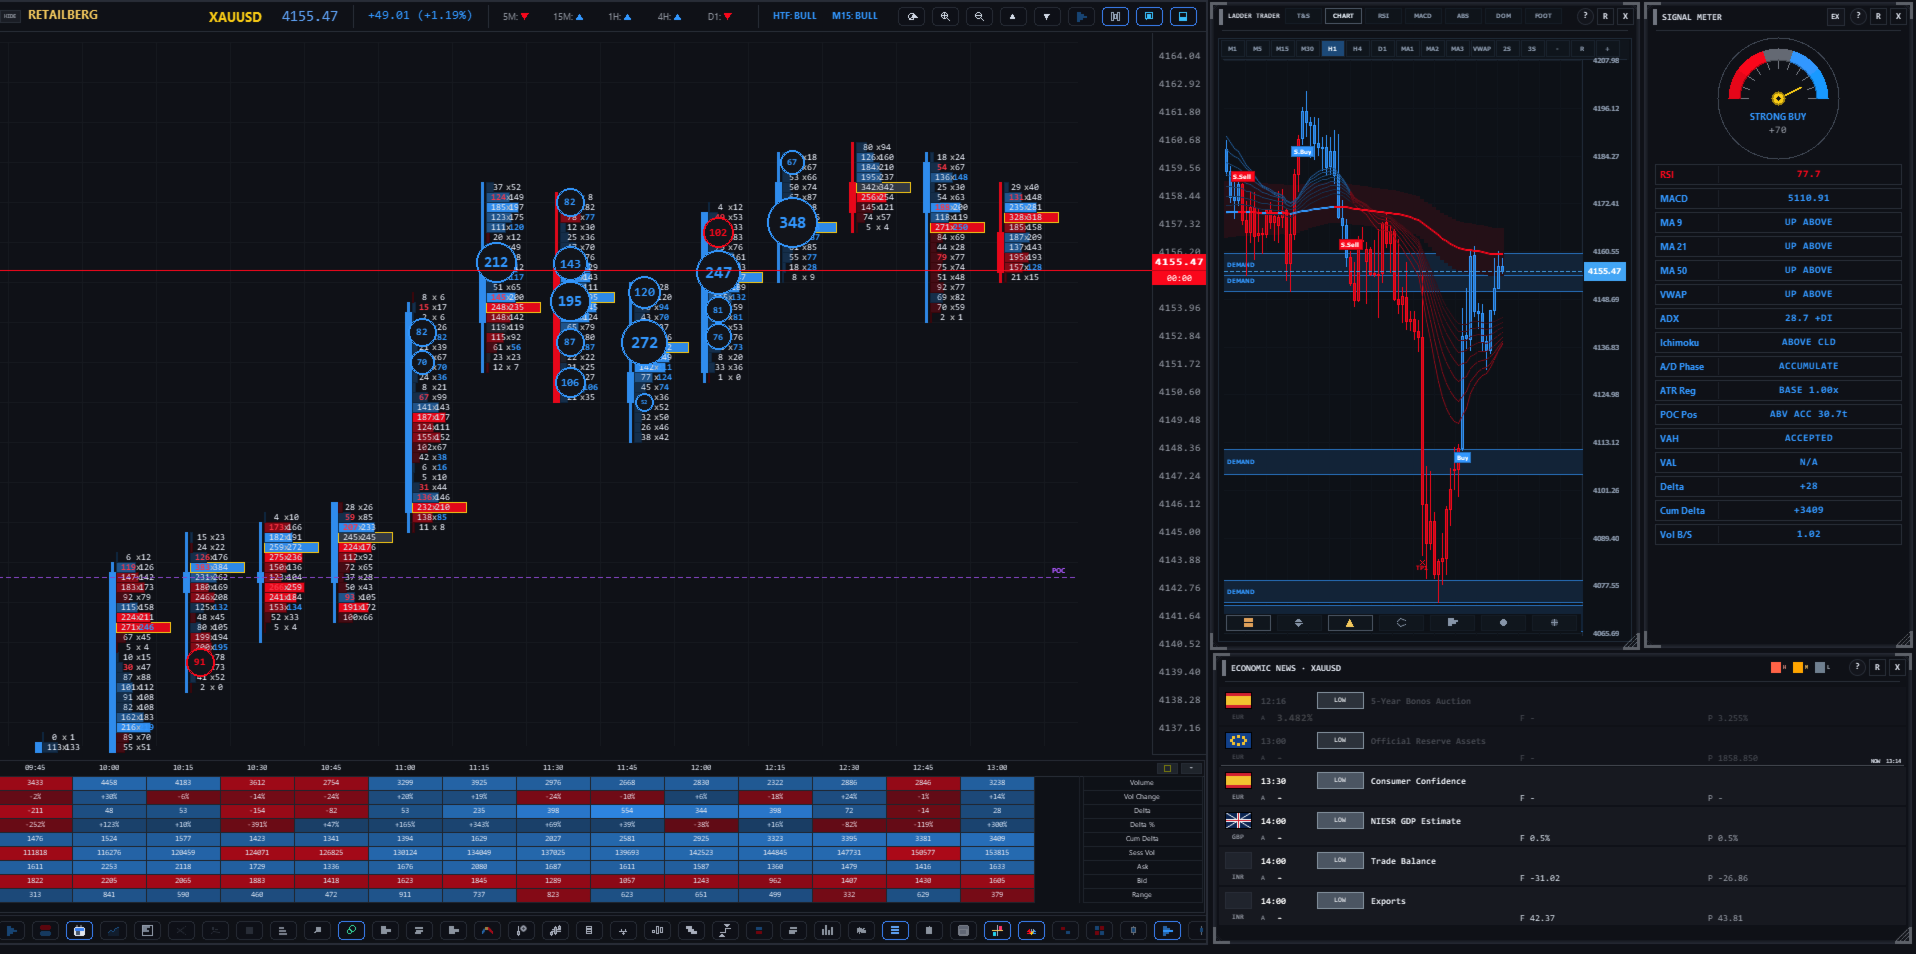
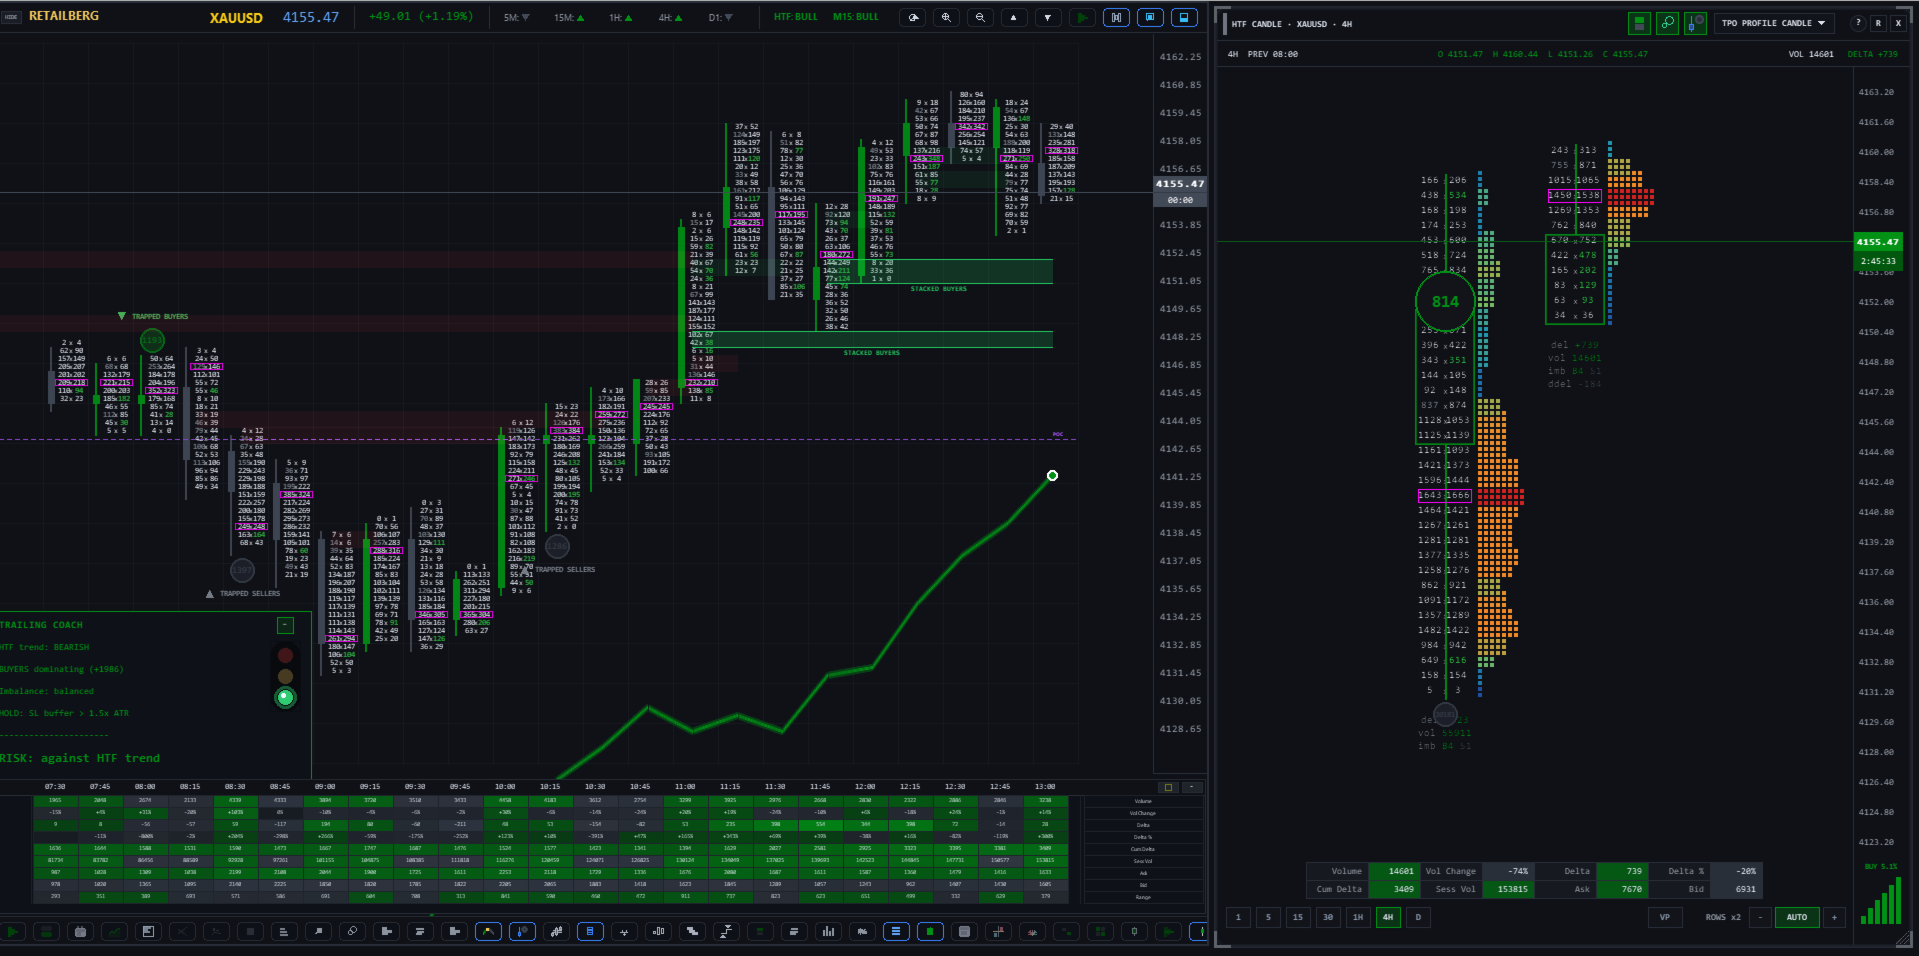
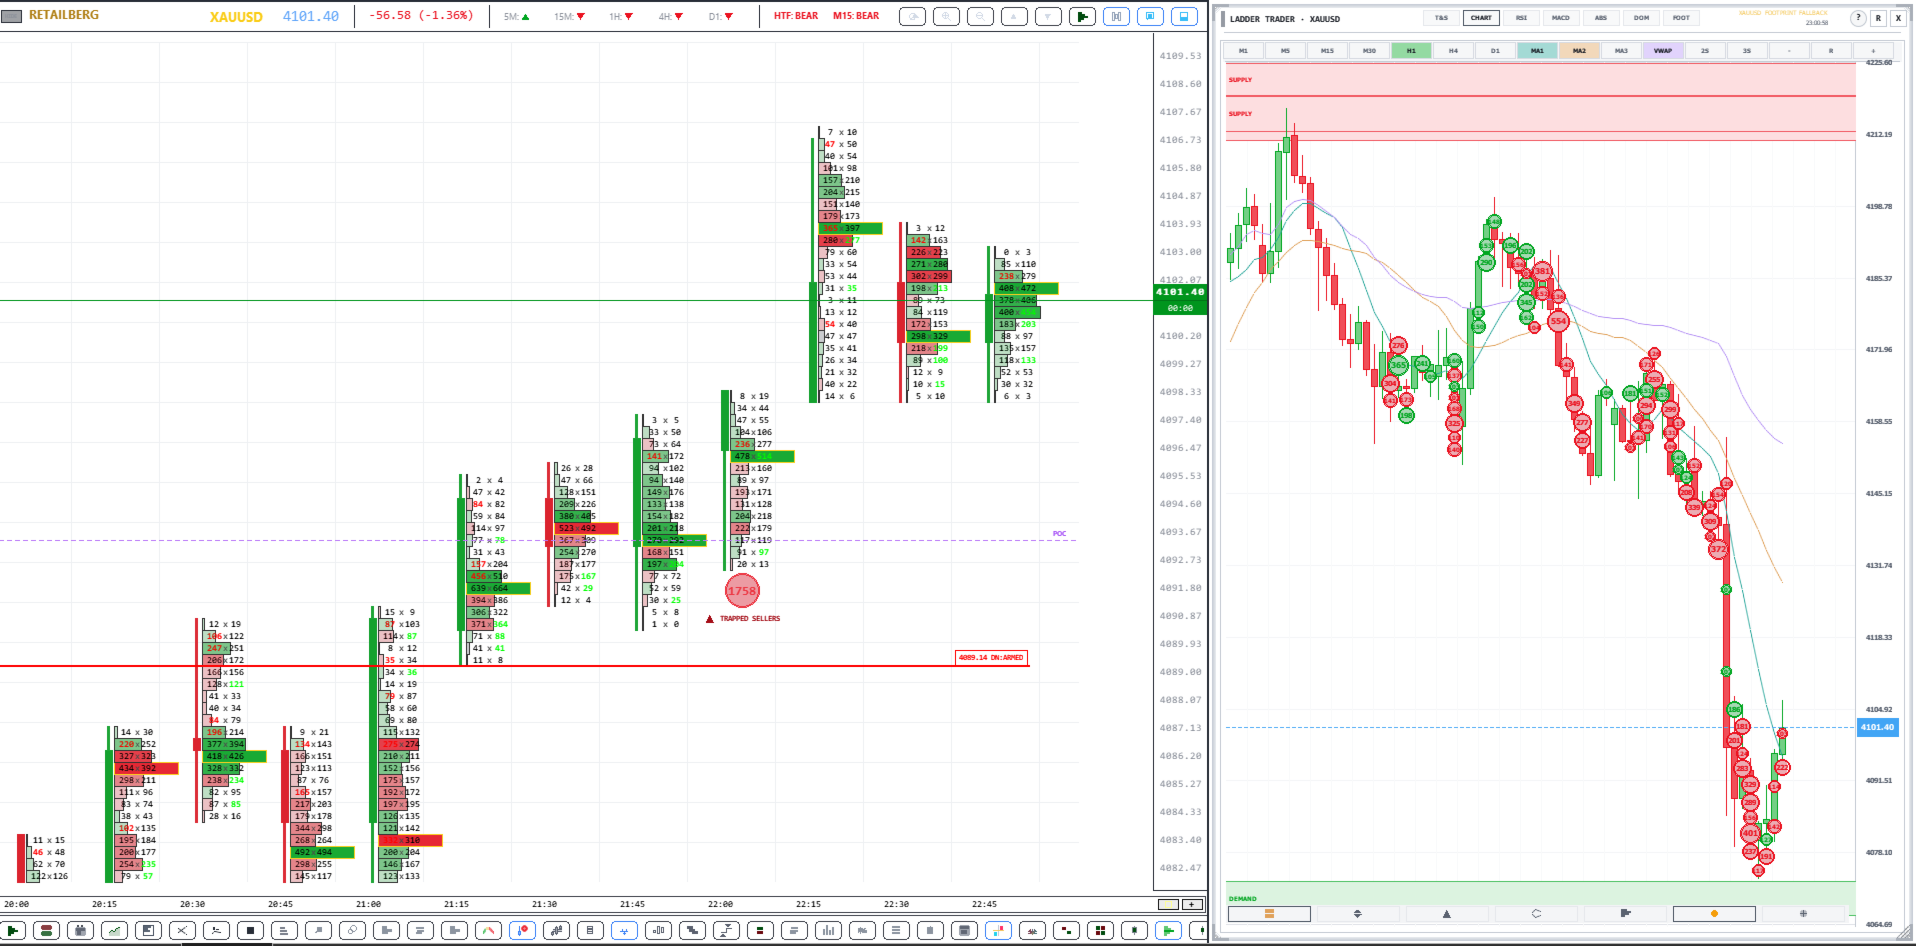
Footprint Chart Pro is a comprehensive, institutional-grade order flow visualization Expert Advisor for MetaTrader 5. Built entirely on a high-performance rendering engine, it delivers real-time bid/ask footprint data, market depth analysis, time & sales tracking, volume profiling, and intelligent market analysis — all within a single, fully configurable multi-panel interface. 


Feature Summary

  • 9 switchable footprint styles — Minimalist, Background Cells, Candle Frame, Volume Profile Candle, Frameless, Middle Candle, Delta Cells, Bid x Ask Profile, Bid x Ask Cells.

  • 6-level cell intensity colouring — 3 buyer tiers + 3 seller tiers with configurable percentage thresholds.

  • 3-tier diagonal imbalance detection with per-tier colours and text size boost.

  • Live DOM panel — broker order book feed, bid/ask depth, executed volume, flash alerts, bar totals.

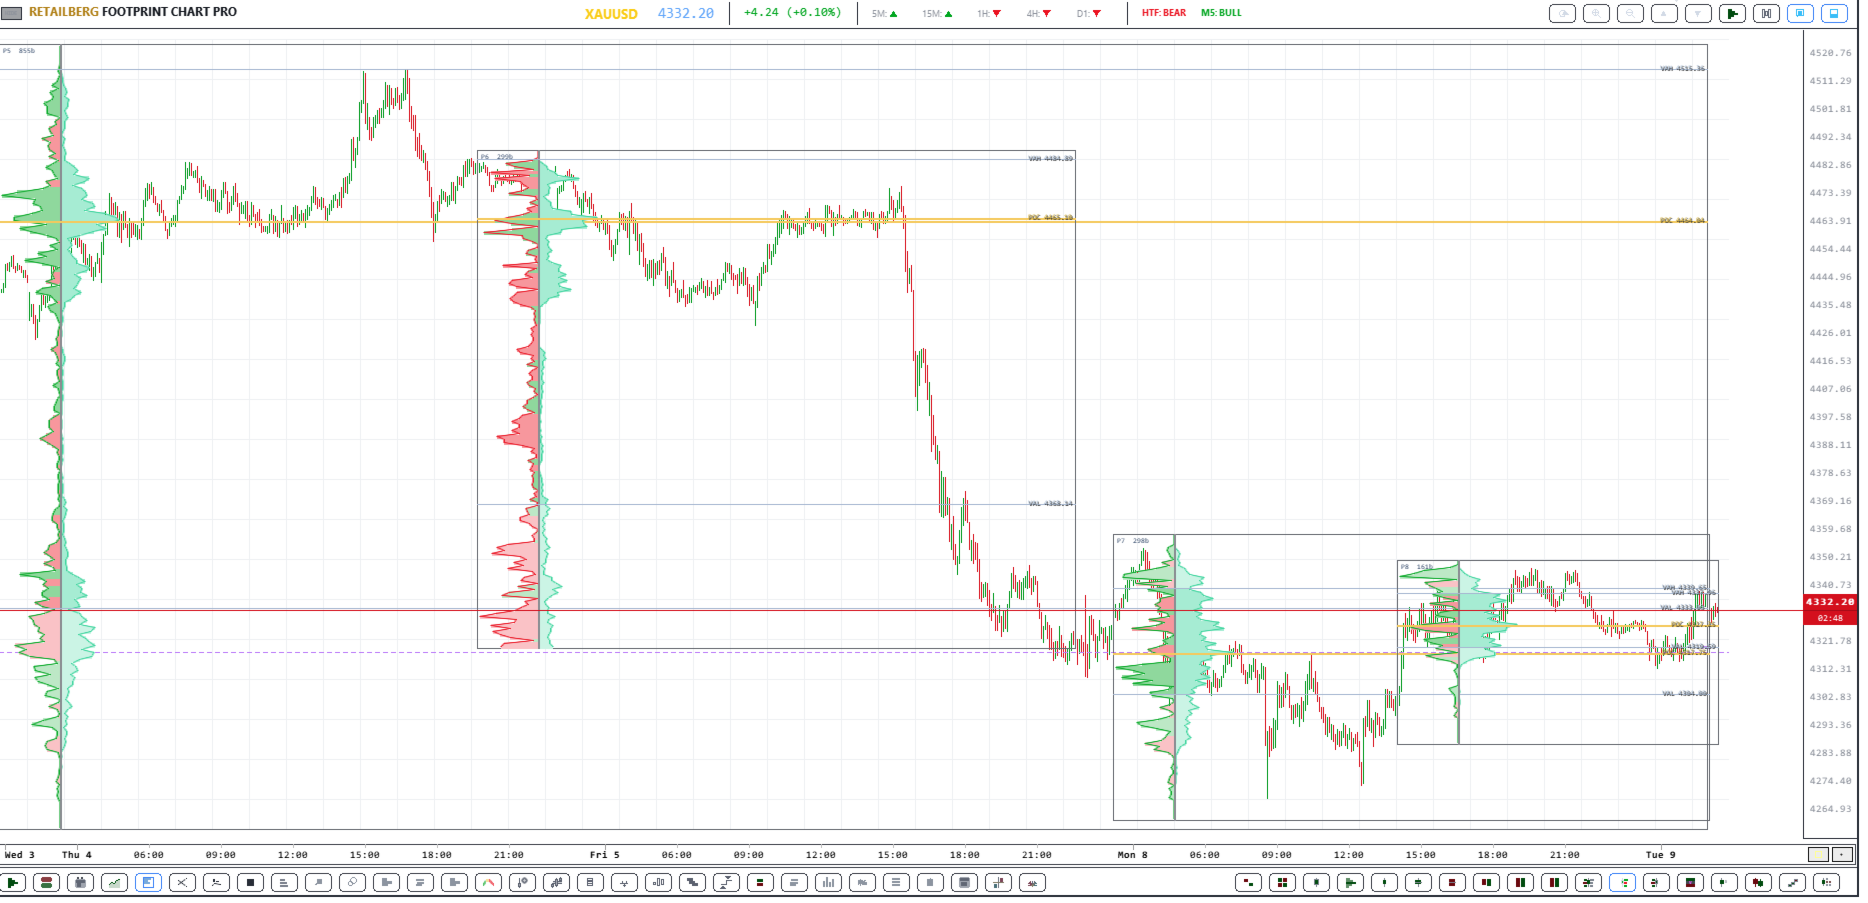
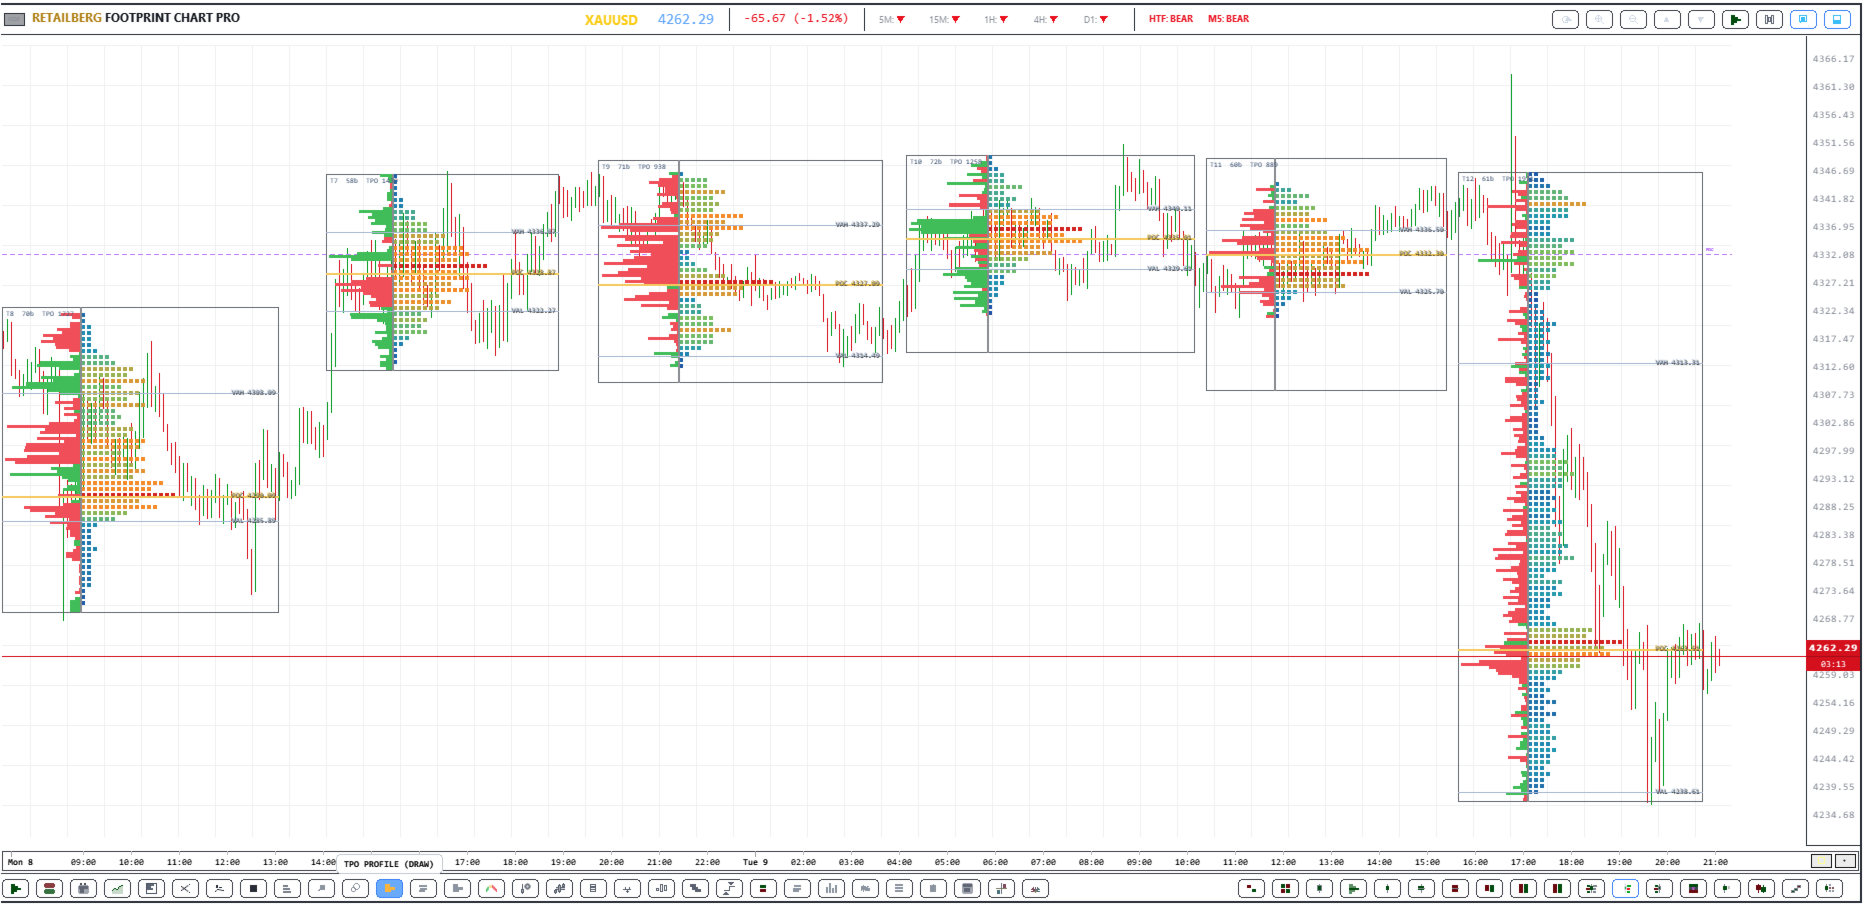
  • Session Volume Profile — 3 modes, 4 display types (Total / Delta / Buy / Sell), POC + VAH + VAL.

  • Time & Sales tape — live tick stream with direction, volume, and large-order highlighting.

  • Embedded RSI and MACD indicators within the panel stack.

  • Signal Meter gauge — MA alignment, ATR regime, POC acceptance, and volume bias combined.

  • Chart Analyst panel — 9-category commentary with a 6-factor scored trade setup summary.

  • Automated Supply & Demand zones — swing detection, volume filter, ATR-scaled width.

  • Economic Fundamentals panel — upcoming news events with auto-refresh.

  • Mini Session Chart — compact overview for a defined session window.

  • Interactive button bar — Supply & Demand Zones, Fundamentals Panel, Mini Chart, Zoom In/Out, Up/Down, Reset, VP, Delta Bars, Side Panels.

  • Fully collapsible interface — style strip, summary table, and side panels each collapse independently.

  • Runtime toggles for per-bar Volume Profile overlay and Delta Bar strip.

  • 16 built-in colour themes, dark/light palette, per-style imbalance colour sets, full per-element control.

  • Tick volume inference engine

  • Coloured Candle countdown timer

  • Dual font system — proportional for labels, monospace for all numerical data.


1. Nine Switchable Footprint Display Styles

The EA provides nine distinct visualisation modes, switchable on the fly via header buttons, each designed for a different analytical preference:

  • Minimalist — Clean text-only Bid x Ask display with no cell backgrounds, ideal for clutter-free reading.

  • Background Cells — Colour-filled cells where intensity is graded across six levels of volume dominance (three buyer tiers and three seller tiers), giving an immediate visual heat map across the bar. High, Medium, and Low thresholds are configurable as percentage values, and each of the six intensity colours is individually adjustable.

  • Candle Frame — Traditional hollow OHLC candle outline overlaid with internal bid/ask data, combining price action and order flow in one view.

  • Volume Profile Candle — Integrates a per-bar volume histogram directly inside the candle body, showing volume distribution by price level. The histogram applies the same six-level intensity colour system (three buyer tiers: High, Medium, Low; three seller tiers: High, Medium, Low) so dominant levels are instantly distinguishable. A neutral colour is applied to balanced levels, and all seven colours are independently configurable or can inherit the global theme.

  • Frameless — Thin candle on the left side with floating bid/ask data with no cell borders, providing a clean open layout.

  • Middle Candle — A compact centre-bar representation with POC outline highlighting, useful on smaller timeframes.

  • Delta Cells — Displays net delta (buy volume minus sell volume) per price level as a single value, cutting through noise to show net aggression.

  • Bid x Ask Profile — A horizontal profile bar chart overlaid on each bar representing cumulative bid and ask volume per level.

  • Bid x Ask Cells — Full cell-based presentation with separate bid and ask columns, mirroring professional footprint chart conventions


2. High-Performance Rendering Engine

The entire interface is drawn using MetaTrader 5's internal rendering engine API rather than chart objects, delivering significant performance advantages:

  • All panels (main footprint, DOM, Volume Profile, Time & Sales, Signal Meter, Analyst) are rendered as layers, minimising redraws.

  • Intelligent  panel caching avoids unnecessary re-renders when data has not changed.

  • Configurable refresh rate in milliseconds (default 100 ms) allows traders to balance real-time responsiveness with CPU overhead.


3. Three-Tier Diagonal Imbalance Detection

The imbalance engine identifies diagonal bid/ask imbalances across adjacent price levels 

  • Three independent ratio thresholds (Level 1, Level 2, Level 3) allow traders to distinguish between moderate, strong, and extreme imbalances.

  • Each imbalance tier renders with a distinct colour and optional text size boost (configurable per-level), making imbalance stacks immediately visible.

  • A minimum volume filter prevents false signals from illiquid price levels with negligible activity.

  • Imbalance colours are independently configurable per footprint style (all 9 styles have individual colour sets), meaning each display mode can carry its own visual language.

  • Once a historical bar's imbalances are computed they are locked, preventing recalculation overhead on bars that are no longer live.

  • The Chart Analyst panel uses imbalance count ratios across the 10 most recent bars to infer institutional directional activity.


4. Live Depth of Market (DOM) Panel

A dedicated DOM panel renders the live order book alongside executed volume data:

  • Supports real broker MarketBook depth feed (OnBookEvent) for live Level II data where available from the broker.

  • Displays pending Bid and Ask orders at each price level together with executed Buy and Sold volume, giving a complete picture of both passive and aggressive activity.

  • Net Delta column and total Volume column shown per level.

  • Current price row highlighted in a distinct colour for instant price location awareness.

  • Flash animation on levels where significant volume hits, providing visual alerts of large order absorption.

  • Configurable number of visible levels (default 12) and panel dimensions.

  • Optional grid lines for easier level-to-level reading.


5. Session Volume Profile (SVP) Panel

A right-side session volume profile provides a statistical view of volume distribution over a configurable time window:

  • Three operating modes: fixed bar count, session start time, or daily reset at 00:00 — covering intraday, session, and daily profile use cases.

  • Four display types: Total Volume, Delta (Buy minus Sell), Buy Volume Only, or Sell Volume Only, switchable via the input settings.

  • Point of Control (POC), Value Area High (VAH), and Value Area Low (VAL) lines drawn across the profile with configurable colours.

  • Bar width scale factor allows the profile histogram width to be expanded or compressed independently of the panel size.

  • Session POC line is also projected across the main footprint chart as a horizontal reference, automatically tracking as new data arrives.

  • Volume intensity colours inherit the global theme or can be overridden independently.


6. Time & Sales (T&S) Panel

A streaming tape panel captures and displays every inferred trade tick in real time:

  • Scrolling list of timestamped trades showing price, volume, and direction (Buy / Sell / Neutral), colour-coded for instant classification.

  • Configurable big-order threshold: trades above the threshold are highlighted with a distinct background to flag large participants.

  • Maximum trade history and visible row count are both configurable, allowing the list to be tuned to screen real estate.

  • Bar totals shown at the bottom of the T&S panel: cumulative Buy volume and Sell volume for the current bar alongside a Buy/Sell ratio.

  • The Chart Analyst panel reads the most recent 50 T&S trades and computes a buy/sell percentage split to generate a qualitative tape sentiment reading.


7. Embedded RSI and MACD Indicators

Two classic momentum indicators are built directly into the panel stack beneath the Time & Sales list:

  • RSI(14) rendered as a line chart with configurable overbought (default 70) and oversold (default 30) reference levels, period length, and line colour.

  • MACD with configurable fast EMA, slow EMA, and signal period displayed as a histogram with zero line for quick divergence spotting.

  • Both indicators share the same panel height settings and update every render cycle, staying in sync with live price action.


8. Signal Meter Panel (Gauge Dial)

A visual sentiment gauge provides an at-a-glance directional reading derived from multiple internal signals:

  • Analogue dial with a sweeping pointer indicating a spectrum from Strong Sell through Neutral to Strong Buy.

  • Signal calculation incorporates three moving averages (MA9, MA21, MA50 by default), ATR regime detection (trend vs. chop), POC acceptance logic, and volume bias.

  • ATR ratio thresholds allow the meter to distinguish between trending and ranging market regimes and modulate signal strength accordingly.

  • POC acceptance parameters (minimum bar count and tick distance) prevent premature signal generation before price has confirmed a level.

  • All colours — bullish, bearish, neutral, pointer, background — are independently configurable.


9. Chart Analyst Panel — Multi-Factor Intelligence Engine

The Chart Analyst is a standalone analysis panel that synthesises data from all active sub-systems into structured, human-readable market commentary:

Sections displayed:

  • Pair Info — Symbol, timeframe, daily price change (points and percentage).

  • Trend + Higher TF | ATR — MA alignment assessment across MA9/21/50 with H4 and D1 higher-timeframe confirmation. ATR(14) value shown in the section header.

  • DOM Analysis — Bid/Ask ratio from the live order book, differentiating between heavy stacking, moderate pressure, and balanced conditions, with near-level focus (within 5 levels of current price).

  • Time & Sales — Buy/sell volume percentage split from the most recent 50 tape trades, classified into five sentiment bands from aggressive buying to aggressive selling.

  • Order Flow — Bar delta and cumulative delta direction used to characterise buying or selling aggression with three intensity bands.

  • Volume — Ask/Bid volume ratio for the current bar, scaled across five categories from heavy buyer dominance to heavy seller dominance.

  • Imbalances — Count of buyer vs. seller imbalances across the 10 most recent visible bars, inferring likely institutional directional activity.

  • Key Levels — Session POC price and daily high/low range.

  • Setup + Advisor Summary — Price position within the daily range combined with trend and flow alignment to generate a directional trade bias recommendation. Final summary scores six independent factors (trend, HTF, order flow, volume, DOM, tape) and outputs a consensus bias label with a score out of six.

The analyst refreshes at a user-defined interval (default 30 seconds) to balance computational load. All commentary text is colour-coded bullish/bearish/neutral for immediate visual classification.


10. Automated Supply & Demand Zones

An integrated swing-based Supply and Demand zone detection engine renders institutional price zones directly on the footprint chart:

  • Zones are identified using swing-high/swing-low detection with configurable swing length and lookback period.

  • Volume ratio filter ensures only swings formed with above-average volume qualify as significant zones.

  • ATR-based zone width scaling adapts zone height to current market volatility rather than using a fixed pip value.

  • Separate colours for Supply (bearish) and Demand (bullish) zones, both defaulting to the active theme colour when set to clrNONE.

  • Zone opacity, maximum number of rendered zones, and volume lookback period are all configurable.

  • Zones render as semi-transparent rectangles on the canvas, updating as price action produces new qualifying swings.


11. Fundamentals Panel

An economic calendar panel displays upcoming fundamental news events relevant to the traded symbol:

  • Configurable panel dimensions and maximum displayed rows.

  • Shows event time, title, affected currency, country code, and importance level.

  • Auto-refreshes at a configurable interval (default 60 seconds).

  • Helps traders contextualise order flow activity against scheduled economic releases.


12. Mini Session Chart

A compact candlestick overview chart provides a higher-level perspective on intraday price action:

  • Renders M1 OHLC data between a configurable session start and end time in local time (HH:MM format).

  • Data is cached for performance, only refreshing when a new tick arrives within the active session window.

  • Panel dimensions are freely resizable.

  • Gives traders a session-level price structure view alongside the tick-by-tick footprint data.


13. Ticker / Info Bar

A header bar at the top of the main panel provides persistent market context:

  • Displays symbol name, current timeframe, and live bid price with up/down change.

  • Daily percentage change shown with bullish/bearish colour coding.

  • Current timeframe trend label (HTF-BULL / HTF-BEAR) derived from the higher-timeframe analysis.

  • MS label (MS-BULL / MS-BEAR) reflecting shorter-timeframe momentum state.

  • Navigation buttons for Zoom In, Zoom Out, scroll Up/Down, Bar Volume Profile toggle, Delta Bars toggle, and Side Panels toggle.


14. Summary Table

A scrollable data table below the main footprint bars displays per-bar statistics:

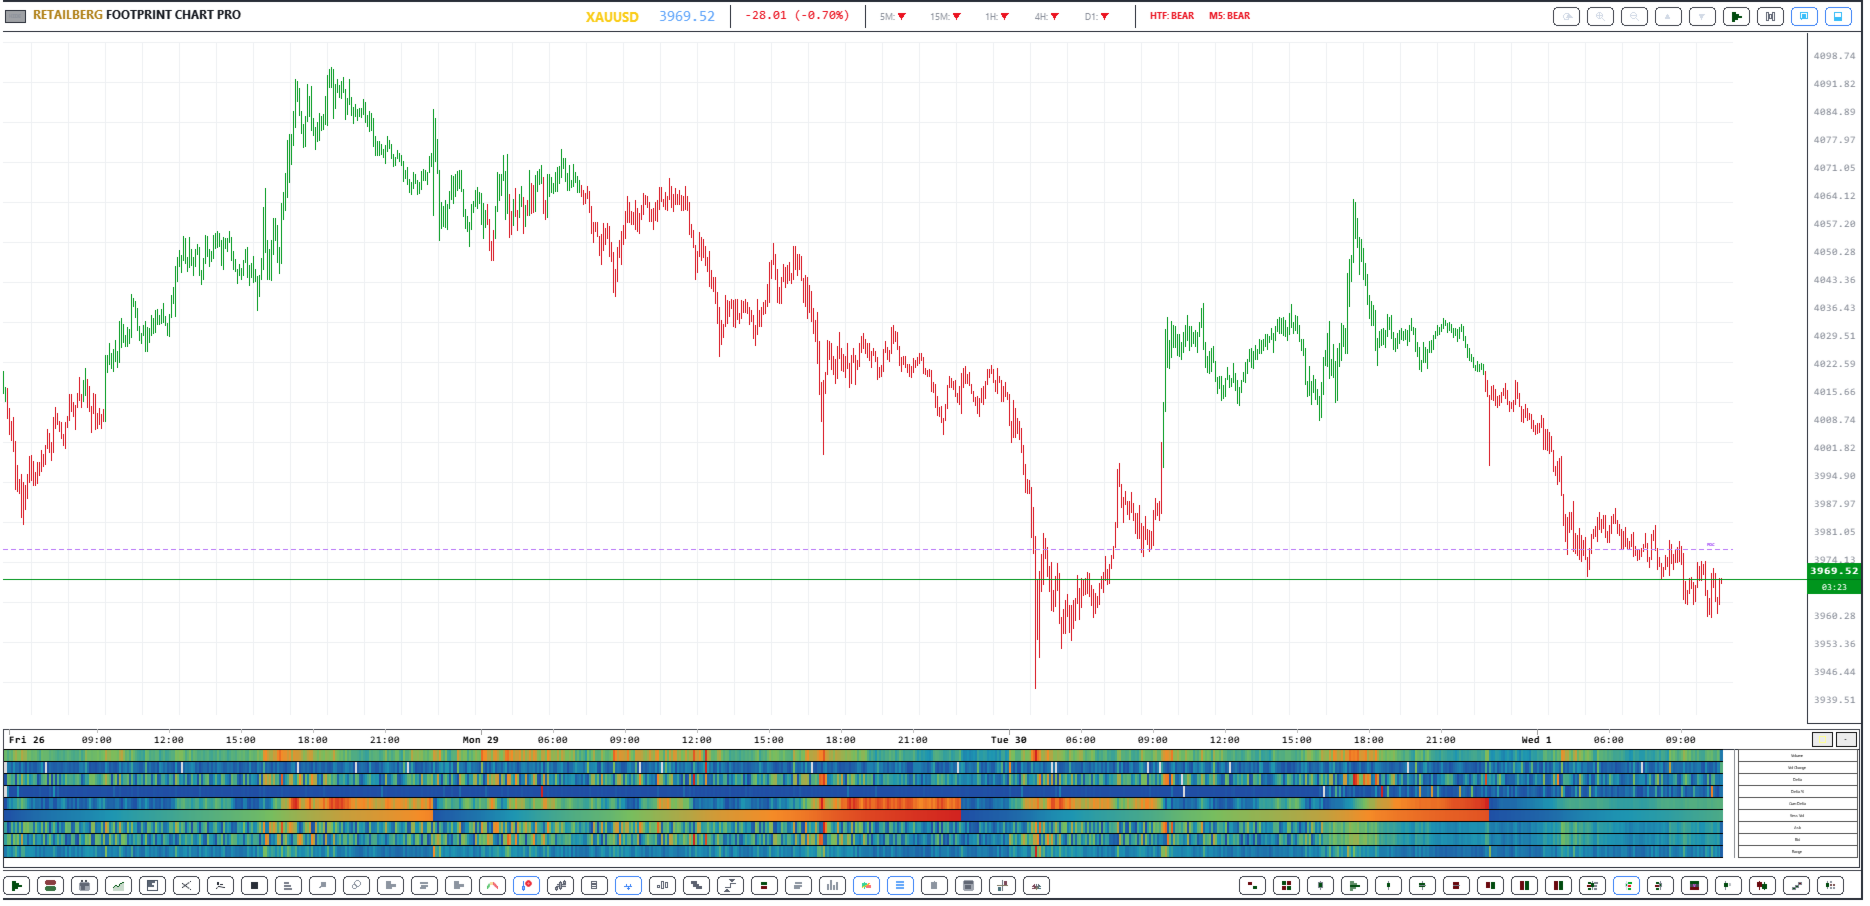
  • Volume, Delta, Cumulative Delta, and Ask volume rows — one column per visible bar.

  • Positive values rendered with a green background, negative values with a red background for instant sign identification.

  • Cumulative delta is computed and cached across up to 600 bars for historical accuracy.

  • Row height and colour scheme are configurable.

  • Candle countdown timer showing seconds and minutes remaining in the current bar, updating in real time using local clock with color changes with countdown.


15. Per-Bar Volume Profile Overlay

An optional histogram can be rendered inside each footprint bar showing the volume distribution across price levels:

  • Toggle on/off independently of the Session Volume Profile.

  • Configurable histogram width.

  • Separate colours for bid-side and ask-side volume, plus a distinct POC level colour.

  • Uses the same intensity theme as the main cells or a custom override colour set.


16. Delta Bar

A compact bar graphic rendered below each footprint candle provides a quick visual delta summary:

  • Bar fill direction and colour indicate net buying (positive) or net selling (negative) delta for the bar.

  • Configurable height, gap from the candle bottom, and separate positive/negative colours.

  • Delta text label displayed inside the bar, inheriting the global theme colours or using custom overrides.


17. Tick Volume Inference Engine

For brokers that do not provide native real volume, a sophisticated inference system estimates actualised trade volume from tick flow:

  • Each incoming tick is weighted by a scale factor and an additional multiplier for every price-step move in that tick, approximating the size of the market order that caused the movement.

  • Configurable minimum and maximum inferred volume per tick prevent outlier distortion.

  • Toggle switch to enable or disable inference, falling back to raw tick counts when disabled.


18. Extensive Colour Theming System

Every visual element of the EA carries independently configurable colours, with a high-level theme system for rapid global style changes:

  • Six-level cell intensity colour system for the Background Cells and Volume Profile Candle styles: three buyer tiers (Buyer High, Buyer Medium, Buyer Low) and three seller tiers (Seller High, Seller Medium, Seller Low). Each of the six colours is independently configurable. High and Medium intensity thresholds are set as percentage values (default 70% and 40%) — any level with dominance above the High threshold renders in the strongest colour, between High and Medium in the mid tone, and below Medium in the subtle shade, creating a natural visual gradient that immediately reveals where the most aggressive activity occurred within each bar.

  • 16 built-in bull/bear colour themes: Classic Green/Red, Blue/Orange, Cyan/Magenta, Lime/Pink, Gold/Purple, Teal/Coral, Sky/Crimson, Mint/Rose, Orange/Dark Grey, Green/Dark Grey, Navy/Slate, Navy/Gold, White/Dark Grey, Emerald/White, Cherry/Teal, and Olive/Sandy.

  • Dark and Light panel palette modes affect all panel backgrounds simultaneously.

  • A global background colour synchronises all panels to a single base tone, with a one-click reset to defaults.

  • Theme Override All mode forces the selected bull/bear theme colours onto imbalance highlights as well, creating a fully unified visual style.

  • Individual imbalance colour sets for each of the 9 footprint styles, allowing each display mode to carry a unique colour language.

  • Full per-element colour control: candle bodies, fills, wicks, POC highlights, neutral cells, DOM rows, T&S rows, delta bars, signal meter components, and all analyst text states.


19. Flexible Layout and Panel Management

The entire interface is position-aware and freely resizable to accommodate different monitor sizes and chart layouts:

  • Main panel X/Y position and Width/Height configurable via inputs.

  • Each side panel (DOM, SVP, T&S, Signal Meter, Analyst, Fundamentals, Mini Session) has independent width and height settings.

  • Bar width and bar spacing are independently adjustable, allowing the footprint grid density to be tuned to the timeframe and screen resolution.

  • Cell gap and cell padding controls fine-tune spacing within each footprint cell.

  • Candle frame line width (1–4 px) and bid/ask separator width are configurable.

  • Side panels can be hidden as a group via the ticker bar toggle, maximising main chart space when detailed sub-panels are not needed.


20. Font Configuration

Two independent font families are used throughout the interface for typographic clarity:

  • Primary font (default: Segoe UI) used for labels, headers, and analyst commentary.

  • Monospace font (default: Consolas) used for all numerical data — prices, volumes, deltas — ensuring consistent digit-width alignment across all panels.

  • Base, small, and large font sizes configurable independently.

  • Per-level imbalance text size boost: three independent boost values allow imbalance labels to grow with signal severity, making strong imbalances stand out at a glance.


21. Interactive Header Controls & Button Bar

The ticker bar doubles as a full interactive control strip. All buttons are rendered as part of the canvas and respond to mouse clicks without requiring any external chart objects:

Left-Side Feature Toggle Buttons

  • Supply & Demand Zones — Toggles the automated Supply and Demand zone overlay on and off in a single click. The button label reflects the current active state, providing a clear on/off indicator at all times.

  • Fundamentals — Opens and closes the Economic Calendar panel. The panel slides in as an overlay when activated; clicking the button again dismisses it, keeping the main footprint chart unobstructed when macro data is not needed.

  • Mini Session Chart — Toggles the compact intraday candlestick overview panel. The session chart renders a full M1 OHLC view for the defined session window and disappears cleanly when toggled off.

Right-Side Navigation & View Buttons

  • RESET — Instantly restores the footprint chart to its default zoom level and vertical position, snapping the view back to a centred, calibrated baseline in a single click.

  • ZOOM IN — Increases the vertical cell height scale by 20% per click, expanding each price bucket row so individual bid/ask numbers become easier to read on faster timeframes or tighter price ranges.

  • ZOOM OUT — Decreases the vertical cell height scale by 20% per click, compressing the chart to display a wider price range simultaneously — useful for getting a broader context view on slower timeframes.

  • UP — Scrolls the entire footprint chart upward by a fixed pixel step , allowing traders to navigate to higher price levels without losing the current bar's data.

  • DOWN — Scrolls the footprint chart downward by the same step, bringing lower price levels into view. Both UP and DOWN support extended scrolling with a range of ±50,000 px.

  • BAR VOLUME PROFILE — Toggles the per-bar volume histogram overlay on and off at runtime, independently of the input settings. Allows traders to switch between clean cell view and profile view without reloading the EA.

  • DELTA BARS — Toggles the delta bar strip (rendered below each candle) on and off at runtime. Useful when the additional row height is needed for more price levels.

  • SIDE PANELS — Master toggle that shows or hides all right-side panels simultaneously (DOM, Session Volume Profile, Time & Sales, Signal Meter, Chart Analyst). Collapsing all side panels with a single click maximises the horizontal footprint chart area, ideal for focused trade execution or screen recording.


Hover State Feedback

Every button in the header bar responds to mouse hover with a colour highlight transition, giving clear visual confirmation of the active target before clicking. Hover states update continuously as the cursor moves across the panel.


22. Collapsible Panels — Full Minimalist Mode

Every major section of the interface can be collapsed independently, allowing traders to build a minimal, distraction-free layout without removing any functionality. Collapsed panels retain their state and re-expand instantly:

Style Strip (Footprint Style Selector Row)

  • The horizontal row of nine footprint style buttons sits in its own collapsible strip directly below the ticker bar.

  • A small +/− toggle button at the right edge of the strip collapses or expands the entire style row.

  • When collapsed, the strip reduces to a minimal tab height, reclaiming vertical chart space while still being accessible via a single click to re-expand.

Summary Table Strip (Timestamps + Volume/Delta Table)

  • The bottom strip containing bar timestamps, per-bar Volume, Delta, Cumulative Delta, and Ask rows is independently collapsible.

  • A +/− toggle at the right of the timestamp strip collapses the data table rows while keeping the timestamp bar visible as a minimal footer.

  • When collapsed, only the timestamp row remains, preserving time reference without the full statistical rows occupying vertical space.

Side Panels — Individual and Group Collapse

  • All five right-side analysis panels (DOM, Session Volume Profile, Time & Sales, Signal Meter, Chart Analyst) are controlled as a group by the SIDE PANELS button in the header bar.

  • A single click hides the entire side panel column, expanding the footprint chart to fill the full panel width — ideal for a clean chart view or during live trading when panel monitoring is not needed.

  • Clicking SIDE PANELS again instantly restores all panels to their previous positions and dimensions.

Minimalist Workflow

By collapsing the Style Strip, the Summary Table, and the Side Panels simultaneously, the entire interface reduces to a clean footprint chart with only the ticker bar visible — matching a professional minimalist layout while all data and controls remain one click away.


Compatibility & Requirements

  • Platform: MetaTrader 5 (MQL5). Not compatible with MT4.

  • Works on all symbols and all timeframes.

  • Real volume data enhances accuracy; tick volume inference is available for brokers without native volume.

  • Broker DOM feed required for live order book data

  • No external DLLs required.

  • Screen Resolution 1920x1080

  • Good laptop or PC


Best Practices

  • Use on liquid instruments (Forex majors, indices, gold)
  • Lower timeframes (M1-M15) show best order flow detail
  • Combine footprint imbalances with DOM for confirmation
  • Watch for POC tests as support/resistance
  • Use Chart Analyst summary for quick bias assessment
  • Monitor Time & Sales for institutional big orders.


    Updates & Support

    • Regular updates with new features
    • Responsive customer support
    • Detailed documentation included
    • Video tutorials available


    Start Trading Like a Professional

    Stop guessing where the market will go. See the actual order flow and trade with confidence alongside institutional traders.

    Questions? Contact us before purchasing - we're here to help!
    Reviews 5
    Digital Revolution
    68
    Digital Revolution 2026.05.12 10:46 
     

    Great Tool and A++ service

    裕文 潘
    424
    裕文 潘 2026.04.20 12:17 
     

    This is a powerful tool.

    zeke21t2
    738
    zeke21t2 2026.04.09 04:04 
     

    I find it invaluable for refining my discretionary scalping tactics by displaying the timeframe in M5. Aside from being difficult for those with presbyopia XD, it's a truly invaluable utility tool, a treasure trove for any trader. Stop guessing where the market will go. See the actual order flow and trade with confidence alongside institutional traders. (by the author) That's absolutely right.

    Recommended products
    Volume Profile Utility
    AL MOOSAWI ABDULLAH JAFFER BAQER
    Volume Profile Discover where the market really trades. Make decisions based on volume, not guesswork. Volume Profile is a professional MetaTrader utility that analyzes trading activity across different price levels, allowing traders to identify where the highest concentration of market participation has occurred. Instead of focusing only on price movement over time, Volume Profile reveals the price levels where buyers and sellers have been most active, providing valuable insight into market str
    Money Flow Profile MT4  HERE   Use Guide Here our more valuable tools SMC Trend Trading   ,  Easy SMC Trading  ,  Institutional SMC Architect Volume Analysis Tools  ,  Volume flow Profile  ,  Market volume profile  , FVG with Volume  , Liquidity Heatmap Profile  ,  Volume Spread Analysis  Master Edition is a professional-grade analytical tool designed to visualize market structure through the lens of volume and money flow. Unlike standard volume indicators, this tool displays a Daily Vo
    ClusterSecondForex
    Rafil Nurmukhametov
    4.67 (3)
    The utility allows you to build different types of graphs: Seconds chart from 1 second to 86400 seconds Tick chart from 1 tick and above The volume chart Delta chart Renko chart Range chart Product demo https://www.mql5.com/ru/channels/clustersecondforex Built-in indicators for volumetric analysis: daily market profile and market profile of the selected timeframe, Cluster Search Imbalance VWAP Dynamic POC, VAH, VAL the profile depth of the market vertical volume with various display options, del
    SolarTrade Suite Financial Robot: LaunchPad Market Expert - designed to open trades! This is a trading robot that uses special innovative and advanced algorithms to calculate its values, Your Assistant in the World of Financial Markets. Use our set of indicators from the SolarTrade Suite series to better choose the moment to launch this robot. Check out our other products from the SolarTrade Suite series at the bottom of the description. Do you want to confidently navigate the world of inves

    Liquidity HeatMap Profile
    Israr Hussain Shah
    5 (1)
    Here   our more valuable tools SMC Trend Trading   ,  Easy SMC Trading  ,  Institutional SMC Architect Volume Analysis Tools  ,  Volume flow Profile  ,  Market volume profile  , FVG with Volume  , Liquidity Heatmap Profile  ,  Volume Spread Analysis 2. Key Features Dynamic Filtering : The core feature. As soon as the current price crosses a historical liquidity level, that level disappears. This reduces chart clutter and prevents you from trading off "dead" support/resistance. Liquidity Heatma
    The indicator builds current quotes, which can be compared with historical ones and on this basis make a price movement forecast. The indicator has a text field for quick navigation to the desired date. Options: Symbol - selection of the symbol that the indicator will display; SymbolPeriod - selection of the period from which the indicator will take data; IndicatorColor - indicator color; Inverse - true reverses quotes, false - original view; Next are the settings of the text field, in w
    NRP Risk Manager Pro Institutional-Grade Trade Management & Prop Firm Protection Get the MetaTrader 4 Version Here: https://www.mql5.com/en/market/product/179888 Get the MetaTrader 5 Version Here: https://www.mql5.com/en/market/product/179885 Trading isn't just about finding the right entry; it is about flawlessly executing your edge while fiercely protecting your capital. NRP Risk Manager Pro is not an automated trading robot—it is a comprehensive, institutional-grade trade terminal d
    ClusterSecond
    Rafil Nurmukhametov
    4.78 (32)
    The utility allows you to build different types of graphs: Seconds chart from 1 second to 86400 seconds Tick chart from 1 tick and above The volume chart Delta chart Renko chart Range chart Demo version of the utility https://www.mql5.com/ru/channels/clustersecond Built-in indicators for volumetric analysis: daily market profile and market profile of the selected timeframe, Cluster Search Imbalance VWAP Dynamic POC, VAH, VAL the profile depth of the market vertical volume with various display op
    Binary Rise Fall
    Israr Hussain Shah
    Here   our more valuable tools SMC Trend Trading   ,  Easy SMC Trading  ,  Institutional SMC Architect Volume Analysis Tools  ,  Volume flow Profile  ,  Market volume profile  , FVG with Volume  , Liquidity Heatmap Profile  ,  Volume Spread Analysis The Fractals_Price indicator is a technical analysis tool that identifies fractal patterns on price charts. Fractals are recurring patterns that signal potential trend reversals or continuation points. This indicator marks both upward and downward
    Was: $249  Now: $99   Market Profile defines a number of day types that can help the trader to determine market behaviour. A key feature is the Value Area, representing the range of price action where 70% of trading took place. Understanding the Value Area can give traders valuable insight into market direction and establish the higher odds trade. It is an excellent addition to any system you may be using. Inspired by Jim Dalton’s book “Mind Over Markets”, this indicator is designed to suit the
    CornGrid
    Mohamad Akram Bin Mohd Jamil
    CornGrid EA MT5 – Advanced Algorithmic Trading System Official Website:   https://corngrid.com Platform: MetaTrader 5 (MT5) | Version:  2.10 Executive Overview CornGrid EA is a sophisticated, fully automated Expert Advisor engineered for MetaTrader 5. Built upon a high-probability Reverse-Candle Entry Algorithm combined with a Dynamic Smart Grid Recovery Model , CornGrid EA is designed to capitalize on short-term market mean-reversion and structural price retracements. Unlike traditional mome
    Here   our more valuable tools SMC Trend Trading   ,  Easy SMC Trading  ,  Institutional SMC Architect Volume Analysis Tools  ,  Volume flow Profile  ,  Market volume profile  , FVG with Volume  , Liquidity Heatmap Profile  ,  Volume Spread Analysis The    Liquidity Heatmap   is a sophisticated institutional trading tool designed to reveal where over-leveraged traders are trapped. By calculating estimated liquidation levels based on volume spikes and leverage, this indicator draws a dynamic "h
    Trading Utility for Forex Currency Pairs Only not for Gold  Functions Auto Lot Calculation based on Risk Auto stoploss  Auto TakeProfit Breakeven Auto Close Half % Close in percentage with respect to the PIPs Pending Orders BuyLimit Sell Limit with distances BuyStop Sell Stop    with distances Trading Informations Risk in percentage For Multiple trades Combine Takeprofit and Combine Stoplosses
    Trade Manger
    Israr Hussain Shah
    Here   our more valuable tools SMC Trend Trading   ,  Easy SMC Trading  ,  Institutional SMC Architect Volume Analysis Tools  ,  Volume flow Profile  ,  Market volume profile  , FVG with Volume  , Liquidity Heatmap Profile  ,  Volume Spread Analysis You Give an Instruction: When you run the script, a window pops up with a dropdown menu. You choose exactly what you want it to do from the list (e.g., "Close Profit Only" or "Delete Pending Orders"). It Scans Your Positions: The script then reads
    PriceMagnet Volume Profile Stop guessing where the smart money is sitting. See it. PriceMagnet Volume Profile is a precision volume-analysis indicator built for MetaTrader 5 traders who want to trade with institutional context instead of guesswork. Rather than plotting volume as a flat bar under your chart, PriceMagnet reconstructs a full horizontal volume histogram directly on price — showing you exactly which price levels attracted the most trading activity over your selected lookback window,
    FREE
    Overview of "TPS Manual Pro" TPS Manual Pro is an advanced MQL5 Expert Advisor (EA) designed for the MetaTrader 5 (MT5) platform. It serves as a comprehensive "trading cockpit" that combines manual trade execution with automated risk management and institutional-grade market analysis tools. Unlike a fully automated bot that makes trading decisions on its own, this EA is designed to assist you—the trader—by automating the repetitive, high-stress tasks of order management, risk calculation, and st
    Painel Nelogica ChartTrading
    Tiago Silvano Souza Felipe
    Painel Profit is an operational trading panel for MetaTrader 5 created to make manual execution and visual order management easier directly on the chart. The operating principle is simple: the trader selects the symbol, timeframe, volume, entry type, and exit strategy. Based on these commands, the panel sends or organizes the trade through the interface, displaying the entry, take profit, and stop loss levels on the chart for visual monitoring. This product is not a signal robot and does not mak
    Pro Order Lot Size Calculator Pro Order Lot Size Calculator is a simple and practical tool designed to help you calculate the appropriate lot size based on the amount of risk you want to take . With this tool, you can easily calculate your trading risk directly from the panel according to the amount of money available in your account. Easy Risk & Lot Calculation The panel is designed to be very simple and easy to use. You can choose how you want to define your risk: Enter your desired risk amoun
    Mine Farm
    Maryna Kauzova
    Mine Farm is one of the most classic and time-tested scalping strategies based on the breakdown of strong price levels. Mine Farm is the author's modification of the system for determining entry and exit points into the market... Mine Farm - is the combination of great potential with reliability and safety. Why Mine Farm?! - each order has a short dynamic Stop Loss - the advisor does not use any risky methods (averaging, martingale, grid, locking, etc.) - the advisor tries to get the most
    VOLUME PROFILE SAF-XII                            Professional Market Profile Analysis for MT5   (The Definitive Tool for Grid & Mean-Reversion Traders)         WHAT IS VOLUME PROFILE? Volume Profile is a professional institutional tool that displays trading activity at specific price levels, unlike traditional volume indicators that show volume over time. It reveals WHERE trading occurred, within your window of choice, helping identify:   • FAIR VALUE AREAS (VAH/VAL) - Price levels wh
    Delta Profile Volume
    Teresinha Moraes Correia
    Technical Description of the Indicator – Delta Profile for MetaTrader 5 The Delta Profile is an indicator developed for MetaTrader 5 focused on detailed analysis of volume flow within a defined range of candles. It organizes and displays information about the imbalance of positive volumes (associated with upward movements) and negative volumes (associated with downward movements) at different price levels. The result is a clear view of the chart points where the highest concentration of trades o
    Blahtech Supply Demand MT5
    Blahtech Limited
    4.54 (13)
    Was: $299  Now: $99  Supply Demand uses previous price action to identify potential imbalances between buyers and sellers. The key is to identify the better odds zones, not just the untouched ones. Blahtech Supply Demand indicator delivers functionality previously unavailable on any trading platform. This 4-in-1 indicator not only highlights the higher probability zones using a multi-criteria strength engine, but also combines it with multi-timeframe trend analysis, previously confirmed swings a
    VR Grid Mt5
    Vladimir Pastushak
    3.25 (8)
    The VR Grid indicator is designed to create a graphical grid with user-defined settings. Unlike the standard grid , VR Grid is used to build circular levels . Depending on the user's choice, the step between the round levels can be arbitrary. In addition, unlike other indicators and utilities, VR Grid maintains the position of the grid even when the time period changes or the terminal is rebooted. You can find settings, set files, demo versions, instructions, problem solving, at [blog] You can
    FREE
    Trading Journal pro
    Israr Hussain Shah
    Here   our more valuable tools SMC Trend Trading   ,  Easy SMC Trading  ,  Institutional SMC Architect Volume Analysis Tools  ,  Volume flow Profile  ,  Market volume profile  , FVG with Volume  , Liquidity Heatmap Profile  ,  Volume Spread Analysis Key Features 1.  Total Immersion UI (The "Blackout") Chart Masking:   Upon loading, the tool turns the background, grid, and candles pitch black. This hides the noise of the market ticks, allowing you to focus purely on your performance data withou
    Time and Sales Tick
    Pablo Filipe Soares De Almeida
    Time & Sales Tick Indicator for MetaTrader 5 This indicator displays real-time trading tick information on MetaTrader 5 charts. It presents price, tick volume, and time. Functionality Displays tick data, including price, volume, and time, in a panel on the chart. Groups ticks into user-defined intervals, with color-coded price movements (green for upward, red for downward). Allows panel positioning in any chart corner.
    Heiken Ashi Stacked Pro is a chart overlay indicator that combines smooth Heiken Ashi visual trend candles, a real-time bar completion timer, and an on-hover crosshair HUD for instant price and wick-to-body ratio diagnostics. Marketplace Description Overview Heiken Ashi Stacked Pro upgrades standard Heiken Ashi candle visuals with an interactive HUD. Designed for trend followers and price action traders, it filters out market noise using colored candles while supplying precise candle metric read
    Quick deals EA
    Aleksandr Slavskii
    Горячие клавиши плюс клик левой кнопки мыши на графике. Советник открывает сделки, выставляет лимитные и стоповые ордера, удаляет ордера и закрывает позиции, также  делает реверс  открытых позиций, выставляет прописанные в настройках стоп лосс и тейк профит. (реверс только на неттинговых счетах) При запуске советника можно посмотреть подсказку как действует советник при нажатии клавиши + клик на графике. Правее последнего бара, ниже цены Ctrl+ЛКМ  - OpenSell Правее последнего бара, выше цены C
    Cumulative Volume Delta MA-X MTF with Gradient Momentum This indicator performs multi-timeframe volume delta analysis for MetaTrader5. It calculates the net difference between buying and selling pressure by analyzing tick or real volume data, providing a visual representation of order flow sentiment. Indicator Logic and Features The indicator uses a mathematical approach to volume analysis: Data Sourcing: Supports both Real Volume (for Exchange assets) and OHLC Wick Proxy calculations (for Forex
    Advanced Volume Profile Analysis Tool for MetaTrader 5 The Kecia Volume Profile Order Finder provides traders with volume profile analysis capabilities. This MT5 indicator combines volume profile visualization with statistical calculations to help identify potential trading opportunities and suggests entry, stop loss, and take profit levels based on market structure. Market Profile Visualization Transform your chart with customizable volume profile visualizations: Multiple visualization options
    TradeControl Pro – Advanced Trade Manager for MetaTrader TradeControl Pro is a trade management tool for MetaTrader that enables structured and efficient management of trading positions directly on the chart. The application combines a clearly designed user interface with automated calculations and flexible control options for different trading approaches. The integrated on-chart panel is organized in a tabular layout and divided into three main sections (tabs): Execution , Close , and Info . Th
    Buyers of this product also purchase
    FarmedHedge Pair Trading Dashboard
    Tanapisit Tepawarapruek
    5 (3)
    Farmed Hedge Yield Farming | All Markets (Manual - Hybrid - Semi/Automated EA) VERIFIED TRADING RESULTS - Farmed Hedge Yield Axi Copy:  https://www.mql5.com/en/signals/2356376 - Farmed Hedge Yield Exn Copy:   https://www.mql5.com/en/signals/2356404 - Farmed Hedge Yield V Copy:  https://www.mql5.com/en/signals/2357156 * Before purchasing, please feel free to send me a message if you have any questions about the product or setup. ** After purchase,  Contact me via private message to receive t
    Quant AI Agents
    Ho Tuan Thang
    5 (1)
    Quant AI Agents are independent trading Expert Advisors. Instead of trading using a fixed strategy like other conventional EAs, Quant AI Agents   is a   multi-agent AI trading framework   that turns natural-language strategy prompts into live.  WANT THE SAME RESULTS AS MY LIVE SIGNAL?   Use the exact same brokers I do:   IC MARKETS , IC TRADING   .  Unlike the centralized stock market, Forex has no single, unified price feed.  Every broker sources liquidity from different providers, creating un
    YuClusters
    Yury Kulikov
    4.93 (43)
    Attention: You can view the program operation in the free version  YuClusters DEMO .  YuClusters is a professional market analysis system. The trader has unique opportunities to analyze the flow of orders, trade volumes, price movements using various charts, profiles, indicators, and graphical objects. YuClusters operates on data based on Time&Sales or ticks information, depending on what is available in the quotes of a financial instrument. YuClusters allows you to build graphs by combining da
    The real‑time view of what is happening inside the market. Footprint Secrets brings detailed analysis directly into MetaTrader 5. It shows where volume is trading, how buyers and sellers are interacting, and how liquidity shifts as the market evolves. Designed for traders who want a precise, real‑time understanding of market behavior. Check out the free preview version here:  https://www.mql5.com/en/market/product/172398 Benefits for the Trader See the real activity behind price . Footprint ch
    Custom Alerts AIO: All-in-One Market Scanner – No Setup Required Overview Custom Alerts AIO is the fastest and easiest way to monitor multiple markets for real-time trading signals—without any setup or extra licenses. It comes with all required Stein Investments indicators already embedded, making it the perfect plug-and-play solution for traders who value simplicity and performance. Just load it to any chart and start receiving alerts across Forex, Metals, Crypto, and Indices. Shares can be a
    AI Agents Supervisor
    Ho Tuan Thang
    5 (1)
    AI Agent Supervisor is NOT an Expert Advisor. AI Agent Supervisor   is a   multi-agent AI risk & portfolio supervisor   that watches every EA on your account and intervenes in real time.  WANT AN AI PORTFOLIO MANAGER WATCHING YOUR FLEET 24/7?   Run your fleet on the same brokers I do:   IC MARKETS , IC TRADING   .  Unlike the centralized stock market, Forex has no single, unified price feed.  Every broker sources liquidity from different providers, creating unique data streams. The Supervisor r
    EasyInsight AIO MT5
    Alain Verleyen
    4.92 (12)
    EASY Insight AIO – All-In-One Power for AI-Driven Trading Want to skip the setup and start scanning the entire market – Forex, Gold, Crypto, Indices, and even Stocks – in seconds? EASY Insight AIO is the complete plug-and-play solution for AI-powered trade analysis. It includes all core Stein Investments indicators built-in and automatically exports clean, structured CSV files – perfect for backtesting, AI prompts, and live market decision-making. No need to install or configure indicators manu
    Global Investing FX Terminal
    Santiago Nicolas Pla Casuriaga
    The Global Investing FX Terminal is an all-in-one FX dashboard for MetaTrader 5 — CB policy rates, CFTC COT positioning, carry rankings, economic surprises, options skew, retail sentiment, and correlations, thirteen panels in total — rendered on a single zero-flicker canvas overlay and refreshing every 10 seconds from one attached EA. No external software required. Professional FX analysis requires simultaneous access to data that normally lives in separate platforms: rate derivatives, governmen
    Trading Chaos Expert
    Gennadiy Stanilevych
    5 (11)
    This software has no equals in the world and represents a universal trade "console" covering trading signals, automated market entry, setting of Stop Loss and Take Profit, as well as Trailing Profit for multiple trades at the same time in a single open window. Intuitive control of the Expert Advisor in "three clicks" ensures a comprehensive use of all its functions on different computers, including tablets PCs. Interacting with additional signal indicators that mark the chart to give a real mark
    FUTURES ORDERFLOW FOOTPRINT CHART Professional OrderFlow EA for MetaTrader 5 Version 1.01| Professional tool for real traders | Institutional-Grade Visualization STRATEGY TESTER USERS - PLEASE SELECT EVERY REAL TICK WHEN TESTING AND YOU HAVE DOWNLOADED HISTORICAL DATA. IF YOU SEE A WAITING SCREEN AND IT IS NOT DOWNLOADING, IT MEANS YOU HAVE LOW HISTORICAL DATA. TRY 1 MIN AND 5 MIN FIRST ON 1 DAY DATA. ONE DAY DATA SHOULD BE THE NEWEST AND MOST CURRENT DATE. PLEASE WAIT UNTIL THE MARKET HAS ROL
    Features   With MT5 to Interactive Brokers(IB) Trader, you can: 1. Load chart data from IB to MT5, and Analyze with all standard or customer Indicators. 2. Place Orders to IB Account Directly in MT5. 3. Make your Own EAs upon IB Securities by only making minus changes of the trading function. Usage 1) Installation Copy the "Mt5ToIBTraderEn.ex4" and sample files to [MT5 Data Folder]->MQL5->Experts.  2)  MT5 Settings Add the IP Address to the MT5 Allowed URLs in 'Tools->Options->Expert Adviso
    HINN Lazy Trader
    ALGOFLOW OÜ
    5 (1)
    The core idea: using the user interface, you configure the parameters the chart must meet before entering a position (or positions), choose which entry models to use, and set the rules for when trading and planning should end. Lazy Trader  handles the rest: it  takes over all the routine chart watching and execution! full description  :: 3 key videos [1] ->  [2]   ->  [3] What can it do? - Understands Larry Williams market structure - Understands swing market structure by Michael Huddleston
    Check EA performance  https://www.mql5.com/en/signals/2376164?source=Site +Profile+Seller Spot vs Future Arbitrage EA for MT5 Spot vs Future Arbitrage EA is an automated Expert Advisor designed for MetaTrader 5 that operates using price differences between Gold spot and Gold futures instruments. The strategy opens positions on both instruments simultaneously to take advantage of temporary differences between spot and futures prices. Requirements The trading account must provide both Gold spot
    The product will copy all  Discord  signal   to MT5   ( which you are member  ) , also it can work as remote copier.  Easy to set up. Work with almost signal formats, support to translate other language to English Work with multi channel, multi MT5. Work with Image signal. Copy order instant, auto detect symbol. Work as remote copier: with signal have ticket number, it will copy exactly via ticket number. How to setup and guide: Let read all details about setup and download Discord To MetaTrader
    Prop Firm Os
    Gayathiri Gopalakrishnan
    5 (1)
    PROP FIRM OS Structured Trading Assistant for MetaTrader 5 PROP FIRM OS is a structured trading assistant designed for MetaTrader 5 users who prefer rule-based market analysis and organized trading workflows. The Expert Advisor combines market analysis tools, scanner functions, dashboard monitoring, alerts, risk-control settings, and trade management features inside one system. PROP FIRM OS is designed to help traders follow selected rules, filters, and monitoring conditions during trading activ
    Telegram to mt5 pro
    Janet Abu Khalil
    4 (4)
    Telegram to MT5 Pro — Advanced Telegram Signal Copier with Auto-Fix, Multi-TP, Risk Control and Full Trade Management Telegram to MT5 Pro — Professional Telegram Signal Copier Telegram to MT5 Pro is a high-performance trade copier that automatically executes signals from Telegram directly into your MetaTrader 5 account, with full control over risk, execution, and trade management. The system consists of two components: • The Expert Advisor (EA) running inside MetaTrader 5 • A companion desktop
    ManHedger MT5
    Peter Mueller
    4.83 (6)
    THIS EA IS A SEMI-AUTO EA, IT NEEDS USER INPUT. Manual & Test Version Please TEST this product before BUYING  and watch my video about it. The price of the ManHedger will increase to 250$ after 20 copies sold. Contact me for user support or bug reports or if you want the MT4 version! MT4 Version  I do not guarantee any profits or financial success using this EA. With this Expert Advisor, you can: Implement your own Zone Recovery strategy to capitalize on trending markets. Create Grid trading s
    Mt5 To InterativeBrokers Copier allows you to copy deals from MT5 account to Interactive Brokers. With this, you can run your EA strategy on a MT5 Demo/Real Account, then copy all the deals to Interactive Brokers account real time. Features: 1. Copy or Invert-Copy deals Realtime from MT5 to IB Account. 2. Synchronizing positions of both accounts periodicaly, in case any missing copying. 3. You can choose only Buy position or Sell position. Symbols Setup: General Format:  {MT Symbol} -> {IB S
    Latency Arbitrage
    Heri Yusufu Kaniugu
    Latency Arbitrage – Ultra Fast Execution & Price Inefficiency Capture Latency Arbitrage  utility tool is designed to exploit short-term price inefficiencies between fast and slow price feeds. Instead of predicting market direction, the EA focuses on execution speed and price deviation opportunities, allowing traders to capture micro-movements before the market fully adjusts. With built-in risk controls and smart filtering, it ensures precise and disciplined trading performance. Price increases b
    Crystal Trade Manager – Advanced MT5 Risk and Trade Control Utility Overview Crystal Trade Manager (CTM) is a professional MetaTrader 5 utility designed for risk management, trade automation, and instant execution control. It provides traders with an integrated system for protecting equity, managing daily drawdowns, controlling lot sizes, and applying automation features such as automatic SL/TP, break-even, and trailing stop. The tool is suitable for manual traders, prop-firm challenge particip
    RiskGuard Management
    MONTORIO MICHELE
    5 (22)
    ATTENTION For a free trial version, visit my website. Manual QUANTUM RiskGuard Management — Your ultimate ally for uncompromising trading. Lot Calculator — Automatic lot size calculation. Quantum — Automatic risk to maximize profits and reduce drawdowns. Automatic Journal — Included and freely downloadable from my website. Automatic Screenshot — Two screenshots: one at entry and one at exit. Partial Profit — Smartly managed partial exits. Smartphone Trading — Place orders from your mobile, mana
    Unlimited Trade Copier Pro MT5 is a tool to copy trade remotely to multiple MT4, MT5 and cTrader accounts at different computers/locations over internet. This is an ideal solution for you if you are a signal provider and want to copy your trades to other receivers globally on your own rules. One provider can copy trades to multiple receivers and one receiver can get trade from multiple providers as well. The provider can even set the subscription expiry for each receiver, so that receiver will n
    # If you have any other requirements or are interested in collaboration, please contact  dev.quantech.london@gmail.com . Flash Trade (FT) Most friendly manual trading tool. Easy operation to secure your funds. Features of FT Click the chart to trade fast FT supports market orders and pending orders Click twice to complete the order and set SL and TP Click trice to complete the pending order and set SL and TP Automatically set the stop-loss amount of each order to a fixed percentage of the bala
    Adam FTMO MT5
    Vyacheslav Izvarin
    5 (2)
    ADAM EA Special Version for FTMO Please use ShowInfo= false for backtesting ! Our 1st EA created using ChatGPT technology Trade only GOOD and checked PROP FIRMS  Default parameters for Challenge $100,000 Tested on EURUSD and GBPUSD only  Use 15MIN Time Frame Close all deals and Auto-trading  before Weekend at 12:00 GMT+3  Friday For Prop Firms MUST use special Protector  https://www.mql5.com/en/market/product/94362 --------------------------------------------------------------------------------
    Royal Copier
    Janet Abu Khalil
    5 (1)
    Royal Copier — Professional MT5 Trade Copier Royal Copier is a professional real-time local trade copier for MetaTrader 5. It now includes both functions inside one single MT5 Expert Advisor. From the inputs, you simply choose whether the EA will run in Master Mode or Client Mode . This means the same EA can be used on the source account or on the receiving account, while preserving the original copier behavior. Royal Copier supports copying between accounts in all common combinations: MT5 to MT
    MT5 Trading Deck
    Manuel Michiels
    5 (2)
    One button. One trade. MT5 Trading Deck is a hotkey trading panel for MetaTrader 5 that turns the platform into a keyboard-driven execution cockpit. Stop loss, take profit and lot size are pre-calculated for every key; the moment you press, a market order is live on the broker. A complete technical user manual is attached in the product Comments section. It documents every input parameter, the full hotkey map, the recommended Stream Deck XL layout, and the advanced workflows for Pre-Limit orders
    Gamma Edge Pro MT5
    Xuan Nam Diep
    1 (1)
    Gamma Edge Pro MT5 — GexBot Classic API Integration Gamma Edge Pro   brings institutional-grade   Gamma Exposure (GEX) data   directly onto your MetaTrader 5 chart — the same data used by professional options traders to anticipate price magnets, hedging flows, and dealer positioning. Powered by the   GexBot Classic API , this indicator automatically maps options market data from US-listed instruments onto any   MT5 CFD instrument   — Forex pairs, Gold, indices, and more — with intelligent price
    QCML Assistant
    Maxime Turcotte-lafreniere
    QCML Assistant MT5 Your Trading. Our Assistant. Your Edge. Looking for a tool that completely transforms your experience on MetaTrader 5? QCML Assistant is the all-in-one solution built by traders, for traders. Just one tool installed on your chart, and you get access to an ultra-complete, ultra-fast, and ultra-simple trading platform. No more hours wasted setting up your workspace. No more complicated trade entries. With QCML Assistant, everything becomes simple, smooth, and efficient right fro
    Forex Analyzer Pro MT5 Trading Account Analytics Dashboard Forex Analyzer Pro is a web-based trading analytics platform designed for Meta Trader 5 users. Forex Analyzer Pro synchronizes account activity from Meta Trader 5 and organizes trading information into analytics, reporting, monitoring, and journaling tools through a structured dashboard. The platform allows users to access their trading dashboard through supported desktop and mobile web browsers. Forex Analyzer Pro connects with your MT5
    Telegram to MT5 Bridge Client EA Turn Any Telegram Trade Signal into Live MT5 Orders Uses AI to help you Adapt to future changing signal messages. Never miss a trading opportunity again. This Expert Advisor connects your MetaTrader 5 to your Telegram channels or groups – and executes trades automatically as soon as a signal is posted. Receive market orders, limit orders, and even multi‑level take‑profit signals (up to three targets). The EA does the heavy lifting for you: it detects entry price
    More from author
    ================================================================================ POC BREAKOUT - V20.72. Full Professional Grade Toolkit ================================================================================ POC Breakout is a full MetaTrader 5 trading dashboard for discretionary traders who want breakout signals, Point of Control (POC) context, volume profiles, order flow, market structure, news, alerts, and advanced trade planning in one professional workspace. Attached directly to you
    FUTURES ORDERFLOW FOOTPRINT CHART Professional OrderFlow EA for MetaTrader 5 Version 1.01| Professional tool for real traders | Institutional-Grade Visualization STRATEGY TESTER USERS - PLEASE SELECT EVERY REAL TICK WHEN TESTING AND YOU HAVE DOWNLOADED HISTORICAL DATA. IF YOU SEE A WAITING SCREEN AND IT IS NOT DOWNLOADING, IT MEANS YOU HAVE LOW HISTORICAL DATA. TRY 1 MIN AND 5 MIN FIRST ON 1 DAY DATA. ONE DAY DATA SHOULD BE THE NEWEST AND MOST CURRENT DATE. PLEASE WAIT UNTIL THE MARKET HAS ROL
    VOLUME BUBBLES ORDERFLOW FOOTPRINT PROFESSIONAL Expert Advisor for MetaTrader 5 Complete Feature Documentation Introduction: Volume Bubbles OrderFlow Footprint Professional is an advanced order flow visualization tool designed for the MetaTrader 5 platform. It provides institutional-grade market analysis through real-time volume bubbles visualization, volume profiling, and sophisticated order flow analysis. This Expert Advisor transforms raw market data into actionable trading intelligence, hel
    DELTA ATLAS Orderbook Order-Flow Visualization Dashboard for MetaTrader 5 Futures A unified, full-screen dashboard for discretionary futures traders that turns the raw order flow into one clear picture. Every executed trade is rendered as volume bubble scrolling across a live liquidity heatmap, read against a real depth-of- market ladder, a live footprint, the session volume profile and cumulative delta — the whole auction, drawn in real time. On top of the tape sits a graded Analyst and a fam
    Filter:
    Agus Triono
    43
    Agus Triono 2026.07.01 17:50 
     

    Don't take this shitv if you want orderflow bacause this not Tell you the area of absorption of exhaustion area Plus they don't teach you how to use it effectively instead they tell you to find out for yourself. Can't a seller make a live trade video and teach the buyers? It's just the imbalance of supply and demand that's confusing you.

    Abdul Jalil
    1499
    Reply from developer Abdul Jalil 2026.07.14 10:35
    Hi This is second review you have of my product. You also purchased my futures footprint chart. You have both left negative feedback because you can't read the footprint. Either you are delibertley leaving negative feedback on both of my orderflow. I advised you to learn about orderflow and footprint. You should not have purchased before learning how to read an orderflow. I would advised you that footprint principles are the same and there are tons of resources you can find. If you confuse yourself from orderflow, it will be best to familiar your self to read and understand footprint. My products does not require a negative feedback because you failed to read the orderflow.Both my footprint charts are the best you will get here the quality, the visuals, the the performance umatched in the marketplace. Good day
    Digital Revolution
    68
    Digital Revolution 2026.05.12 10:46 
     

    Great Tool and A++ service

    Abdul Jalil
    1499
    Reply from developer Abdul Jalil 2026.05.12 10:47
    Thank you my friend. Greatly appreciated. Kind regards AJ
    裕文 潘
    424
    裕文 潘 2026.04.20 12:17 
     

    This is a powerful tool.

    Abdul Jalil
    1499
    Reply from developer Abdul Jalil 2026.04.20 12:43
    Thank you so much Kind regards AJ
    zeke21t2
    738
    zeke21t2 2026.04.09 04:04 
     

    I find it invaluable for refining my discretionary scalping tactics by displaying the timeframe in M5. Aside from being difficult for those with presbyopia XD, it's a truly invaluable utility tool, a treasure trove for any trader. Stop guessing where the market will go. See the actual order flow and trade with confidence alongside institutional traders. (by the author) That's absolutely right.

    Abdul Jalil
    1499
    Reply from developer Abdul Jalil 2026.04.09 16:25
    Hi Thank you so much for the feedback, greatly appreciated. Take care AJ
    jackie1289
    26
    jackie1289 2026.02.25 16:04 
     

    excellent supp from dev

    Abdul Jalil
    1499
    Reply from developer Abdul Jalil 2026.04.09 16:25
    Thank you for the feedback. Take care AJ
    Reply to review