
Entry In The Zone with SMC Multi Timeframe
- Utilities
- Version: 2.52
- Updated: 5 November 2026
- Activations: 15

Welcome to Entry In The Zone with SMC Multi Timeframe — COMPLETE SMC ANALYSIS SYSTEM — ALL IN ONE INDICATOR
Entry In The Zone with SMC Multi Timeframe An indicator designed for market analysis based on Smart Money Concepts (SMC), displaying Market Structure, Key Zones (Order Blocks, Supply & Demand Zones, and Fair Value Gaps), Liquidity, and real-time BUY / SELL signals. It supports both Single-Timeframe and Multi-Timeframe analysis, along with the Confluence at Zone feature, which helps you evaluate supporting factors when price enters a key zone. Real-time BUY / SELL signals designed with a strong focus on the No-Repaint principle. They help filter signals during Sideway market conditions, where price direction is unclear, reduce chart noise, and provide greater clarity when evaluating potential trading opportunities. The system evaluates trading opportunities by considering key factors together, including Market Structure, Points of Interest (POIs), Liquidity, and Risk Management, supporting more systematic entry planning and trading decisions. To support systematic risk management, the system includes a Risk Per Trade Calculator that automatically calculates the appropriate lot size based on Stop Loss and the selected risk percentage, including the correct order type, helping traders maintain consistent risk control for each position.
FABLE Pro Suite A supporting indicator suite for Entry In The Zone and SMC Multi-Timeframe No additional cost. Ready to use immediately after purchase with no approval required. Available for free.
Included Indicators : 1.Price Action Radar — Multi-Timeframe Scanner 2. Adaptive RSI Filter 3. Bar Count Down 4. Auto Volume Profile 5. Adapt Nadaraya MTF 6. Smart Strength 7. Auto Multi Trendlines Breakout Signal Alerts- Download The FABLE Pro Suite here / Read the full documentation on the product blog: [Complete User Guide]
- Before purchasing, please read Section 7 of the [Complete User Guide] to understand the differences between the Indicator Version and the Utility Version (Risk Per Trade).
Core Features of the Tool
Our indicator values every detail of market analysis. All components of the system are designed to help monitor and analyze market conditions in real time.
1. SMC Market Structure
Start by understanding which direction the price is moving. The indicator automatically detects and displays:
- Trend: Major Trend and Minor Trend
- Structure Breaks: BOS, CHoCH, mBOS, mCHoCH
- Swing Structure: Swing High / Swing Low, HH, HL, LH, LL
- Strong / Weak High & Low: Levels that may be defended or may be broken to sweep Liquidity
2. Points of Interest (POIs) with CONFLUENCE AT ZONE
Not all price levels are equally important. The indicator helps identify areas where price behavior should be monitored, along with the CONFLUENCE AT ZONE feature, which helps evaluate supporting factors when price enters a key zone, allowing you to assess the alignment of different factors before making trading decisions.
- Order Blocks (OB) / Volume Order Blocks (VOB)
- Supply & Demand Zones
- Fair Value Gaps (FVG)
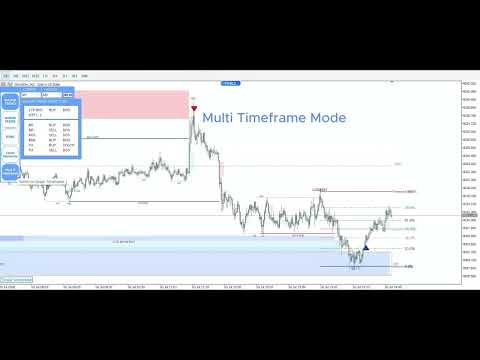
3. Supports Single-Timeframe / Multi-Timeframe Analysis
- Single-Timeframe Analysis (Analysis on a Single Timeframe): Analyze market structure, price direction, and key zones based on Smart Money Concepts (SMC), using the current chart timeframe. Suitable for those who prefer simplicity and want to focus on analysis within a single timeframe.
- Multi-Timeframe Analysis (Analysis Across Multiple Timeframes): Displays market structure and key zones based on Smart Money Concepts (SMC) from higher timeframes directly on the current chart, helping you gain a broader market perspective while assessing trading opportunities on lower timeframes.
4. Real-Time BUY / SELL Signals — No-Repaint Focus
Real-time BUY / SELL signals are designed with a strong focus on the No-Repaint principle. They help filter signals during Sideway market conditions, where price direction is unclear, reduce chart noise, and provide greater clarity when evaluating potential trading opportunities.
- Trend Following : Helps filter BUY / SELL signals to align with the SMC trend direction, helping reduce signals that go against the main trend.
- Signals are confirmed when the candle closes and do not change retrospectively.
- Helps filter out unclear trading situations.
- Provides real-time alerts.
5. Comprehensive Reference Information on a Single Chart
- Liquidity and Real-time Liquidity Sweep (LQS) Detection and Display
- Equal Highs / Equal Lows
- PDH / PDL (Previous Day High / Low)
- PWH / PWL (Previous Week High / Low)
- Premium & Discount Zones
- Optimal Trade Entry (OTE)
- Auto Fibonacci
- Trading Sessions
6. Alerts & Notifications
Get notified when:
- Price enters a key zone
- A BUY / SELL signal appears
- A BOS / CHoCH occurs
- Alerts are also available as mobile push notifications.
7. Historical Zones Remain on the Chart
Older zones are not deleted, allowing you to review historical price behavior, revisit past trades, and continuously backtest strategies.
8. Risk Per Trade
The built-in Risk Per Trade Calculator automatically calculates the appropriate Lot Size based on your selected Risk Percentage and Stop Loss level, while also calculating Risk-to-Reward (RR) and automatically determining the appropriate Order Type.
Key Features:
- Automatic Lot Size Calculation
- Risk-to-Reward (RR) Calculation
- Automatic Order Type Detection
- Pending Orders
- Market Execution
Simply set your acceptable risk and adjust your desired entry, Stop Loss, and Take Profit levels. The system automatically calculates the required trade parameters and displays the Order Type, Entry Price, Lot Size, Stop Loss, Take Profit, Risk, and RR directly on the chart.
New Features (Version: 2.52)
TRADE OVERVIEW DASHBOARD
When market information is spread across multiple timeframes, understanding the overall market direction and price structure can be challenging.
Trade Overview Dashboard brings together essential market information from multiple timeframes on a single screen, helping you gain a clearer understanding of overall market conditions, while providing guidance to support your trading decisions.
You can review important market information, assess market direction, understand price structure, and plan your trades more systematically and effectively, without having to spend time switching between multiple charts to gather information.
CONFLUENCE AT ZONE
When Price Enters a Key Zone... You'll Know How Many Supporting Factors Align
Key zones are where trading decisions matter. But price entering a zone alone isn't enough. This feature helps you identify which factors align, including signals and other relevant factors, before entering a trade, allowing you to conduct a more thorough analysis with better-informed decision-making. You can consider the available information and supporting factors together to evaluate the situation more comprehensively.
STRONG & WEAK HIGH/LOW
Identifies strong highs and lows (Strong High/Low) that are more likely to be protected by market structure, and weak highs and lows (Weak High/Low) that are more likely to be broken or swept for liquidity. Helps traders analyze market structure and systematically assess potential liquidity targets.
OPTIMAL TRADE ENTRY (OTE)
Highlights the optimal retracement zone (typically 61.8%–79% Fibonacci) within an impulse move to help identify potential entry opportunities aligned with market structure.
How to Use It Systematically
- Assess Market Direction: Examine the major structure on a higher timeframe.
- Identify Points of Interest: Select relevant OB, Supply & Demand, or FVG zones.
- Wait for Price Reaction: A zone is only an area for analysis, not confirmation of a trade entry.
- Look for Confirmation on a Lower Timeframe: Examine mBOS / mCHoCH together with Price Action and Liquidity.
- Plan the Trade: Determine the entry point, Stop Loss, target, and position size before opening an order.
Designed for Beginners and Experienced Traders
For beginners: Visualize market structure and key SMC concepts directly on the chart, reducing the need for repetitive manual drawing and helping you learn through practical chart analysis.
For experienced traders: Save time on repetitive market analysis and focus more on evaluating entry and exit opportunities, developing trading strategies, and managing risk.
If you experience any inconvenience or have any questions while using the product, please feel free to contact me through the MQL5 private messaging system at any time.
Thank you for your trust and support. We wish you continued success in your trading, and we will continue improving and enhancing our product to provide you with the best possible trading experience.
















































It’s been about half a year since I bought it? I can’t remember exactly, but I open it every time I trade, and it’s really useful. However, it occasionally closes due to errors when switching between different timeframes. Overall, it’s still very good—keep up the support!