FIBONACCI ARCS [tambangEA]

MQL5 Blogs = https://www.mql5.com/en/blogs/post/775739
MT4 Version = https://www.mql5.com/en/market/product/195514
MT5 Version = https://www.mql5.com/en/market/product/ 195515
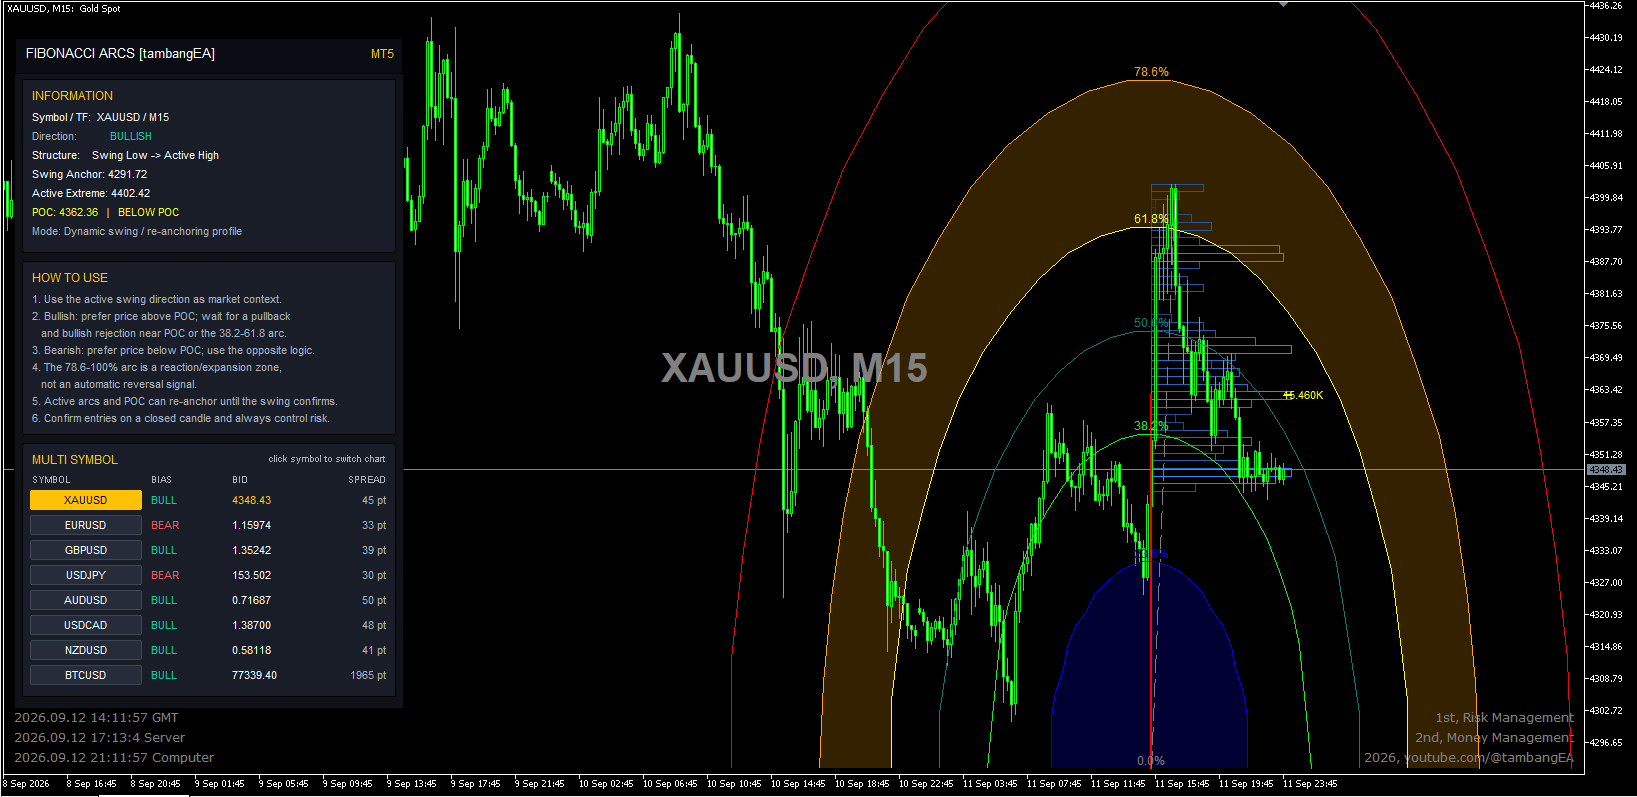
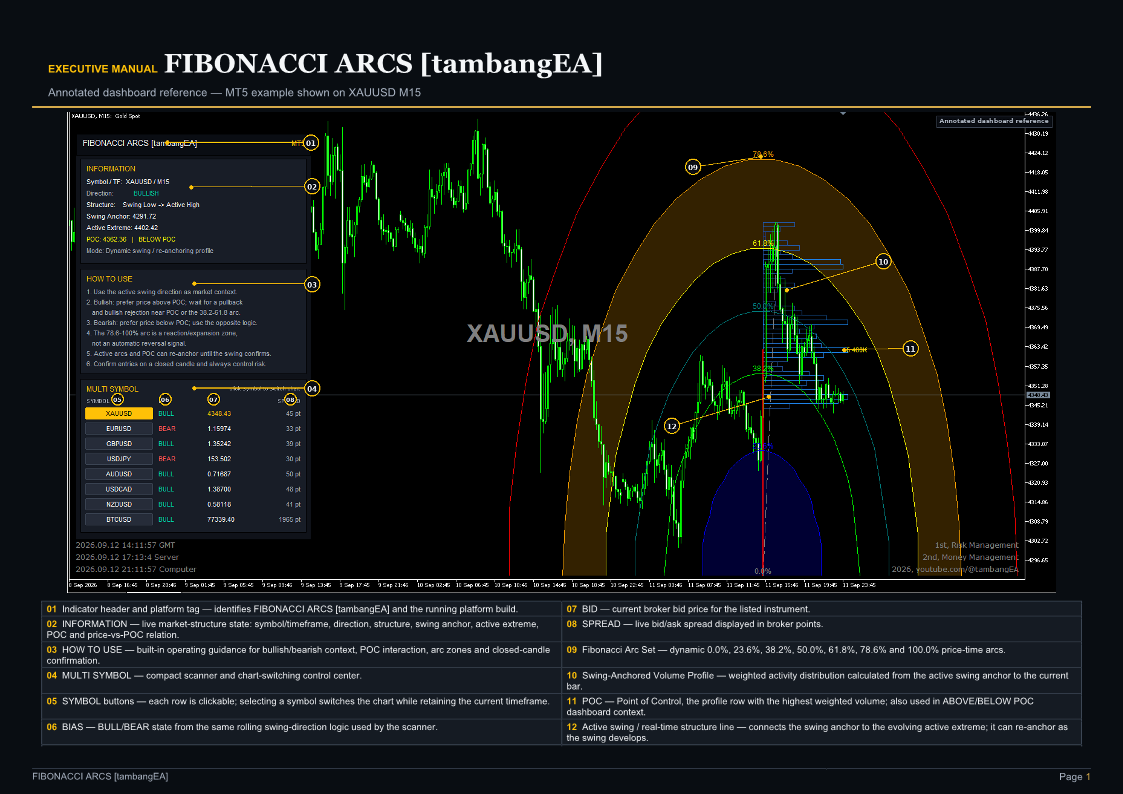
FIBONACCI ARCS [tambangEA] is an advanced market-structure indicator designed to visualize the relationship between price, time, swing geometry, and volume concentration directly on the chart.
Unlike a conventional Fibonacci retracement that displays static horizontal levels, Fibonacci Arcs project curved Fibonacci zones from the active market swing. This allows traders to evaluate how price develops not only vertically, but also through time.
The indicator combines dynamic swing analysis with Fibonacci Arc levels at 0.0%, 23.6%, 38.2%, 50.0%, 61.8%, 78.6%, and 100.0%, together with a swing-based Volume Profile and Point of Control.
Key Features
- Dynamic bullish and bearish swing detection
- Fibonacci Arc structure based on the active market swing
- Fibonacci levels:
0.0 / 23.6 / 38.2 / 50.0 / 61.8 / 78.6 / 100.0 - Adjustable horizontal and vertical Arc scaling
- Configurable Arc resolution and line width
- Optional colored Fibonacci zone fills
- Dynamic Volume Profile anchored to the active swing
- Point of Control (POC) identification
- Real-time active swing line
- Confirmed swing structure visualization
- Professional dashboard
- Built-in usage guidance
- Multi-symbol market scanner
- Bullish / Bearish structural bias
- Live Bid and Spread information
- Clickable symbol buttons for fast chart navigation
- Automatic broker symbol prefix/suffix handling
- Active-symbol highlighting
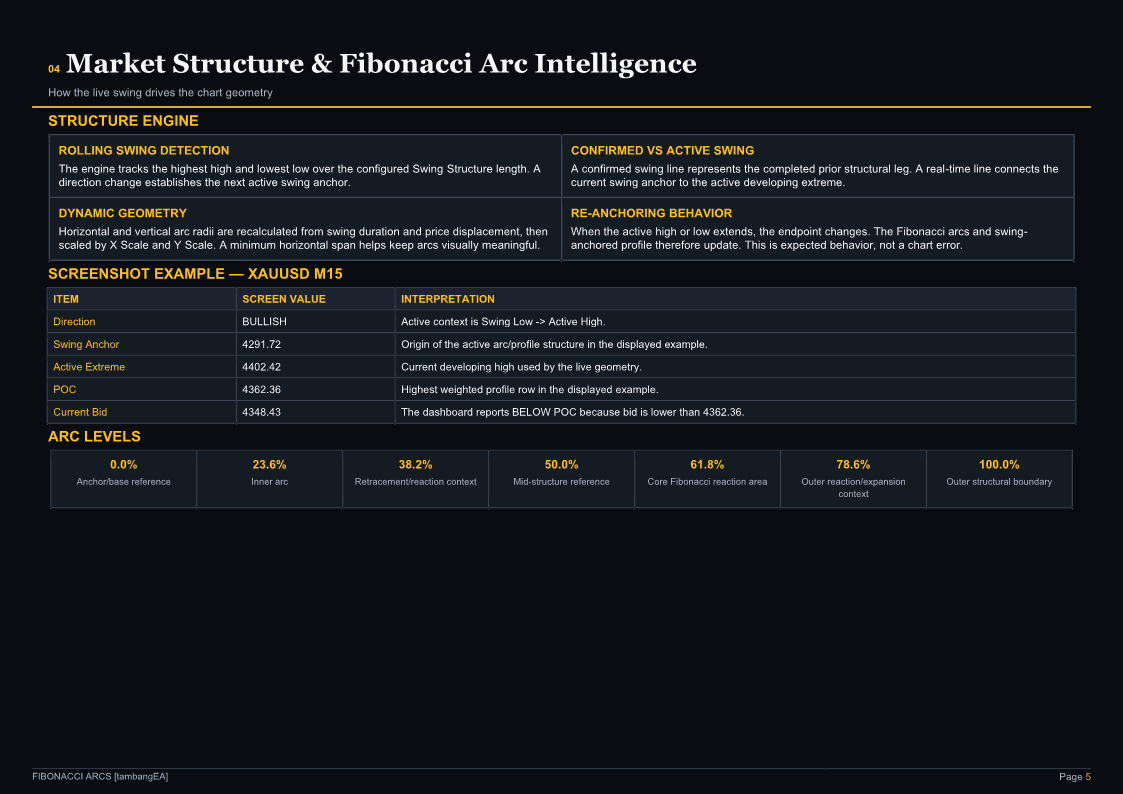
The original calculation uses rolling highest/lowest structures to determine market direction and continuously tracks the active swing extreme. As the current swing develops, its endpoint can update dynamically.
Professional Dashboard
The dashboard is divided into three dedicated sections.
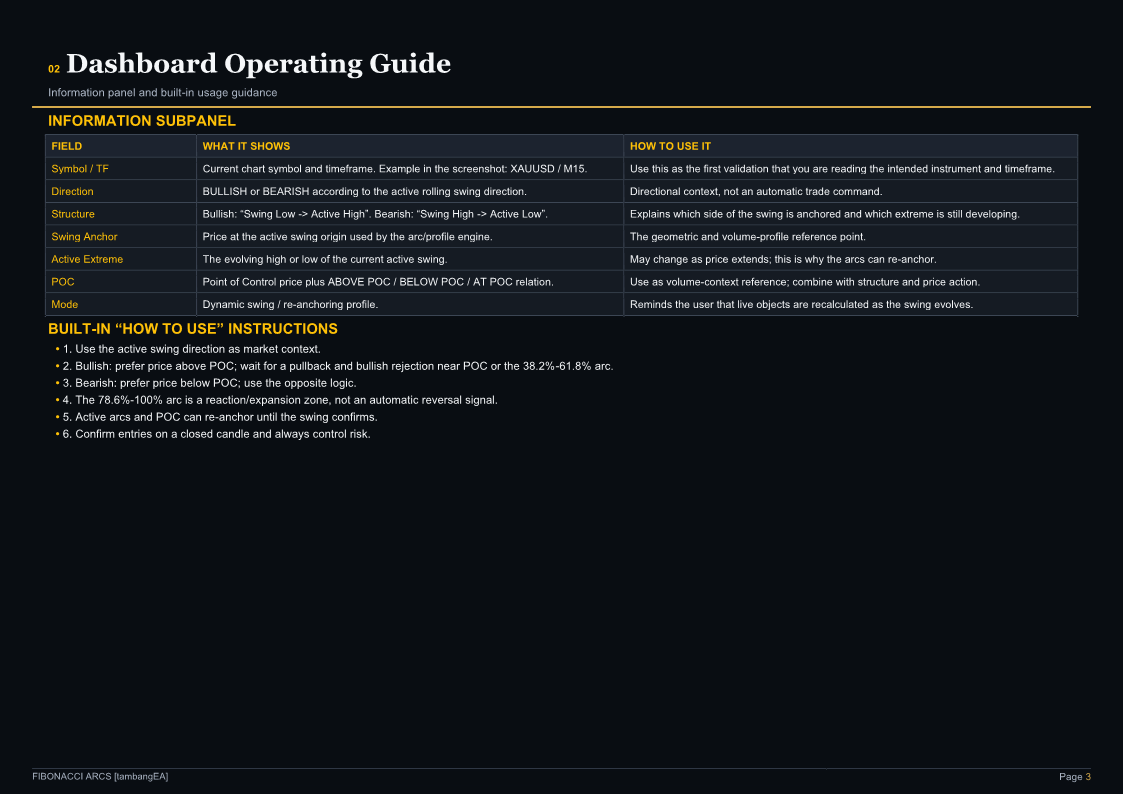
INFORMATION
Provides a real-time overview of the current chart, including:
- Symbol and timeframe
- Market direction
- Current swing structure
- Swing Anchor
- Active Extreme
- Point of Control
- Price position relative to POC
- Dynamic swing status
Example:
Direction: BULLISH
Structure: Swing Low → Active High
Swing Anchor: 4291.72
Active Extreme: 4402.42
POC: 4362.36 | BELOW POC
This provides an immediate structural overview without requiring the trader to manually identify the current swing.
HOW TO USE
The built-in guide provides a practical interpretation framework directly on the chart.
For a bullish structure, traders can monitor pullbacks toward the POC or intermediate Fibonacci Arc zones and then evaluate bullish price confirmation.
For a bearish structure, the same concept can be applied inversely.
The 78.6%–100.0% region should be treated as an expansion or potential reaction zone, not as an automatic reversal signal.
Because the active swing is dynamic, Fibonacci Arcs and the associated Volume Profile may re-anchor when a new swing extreme develops.
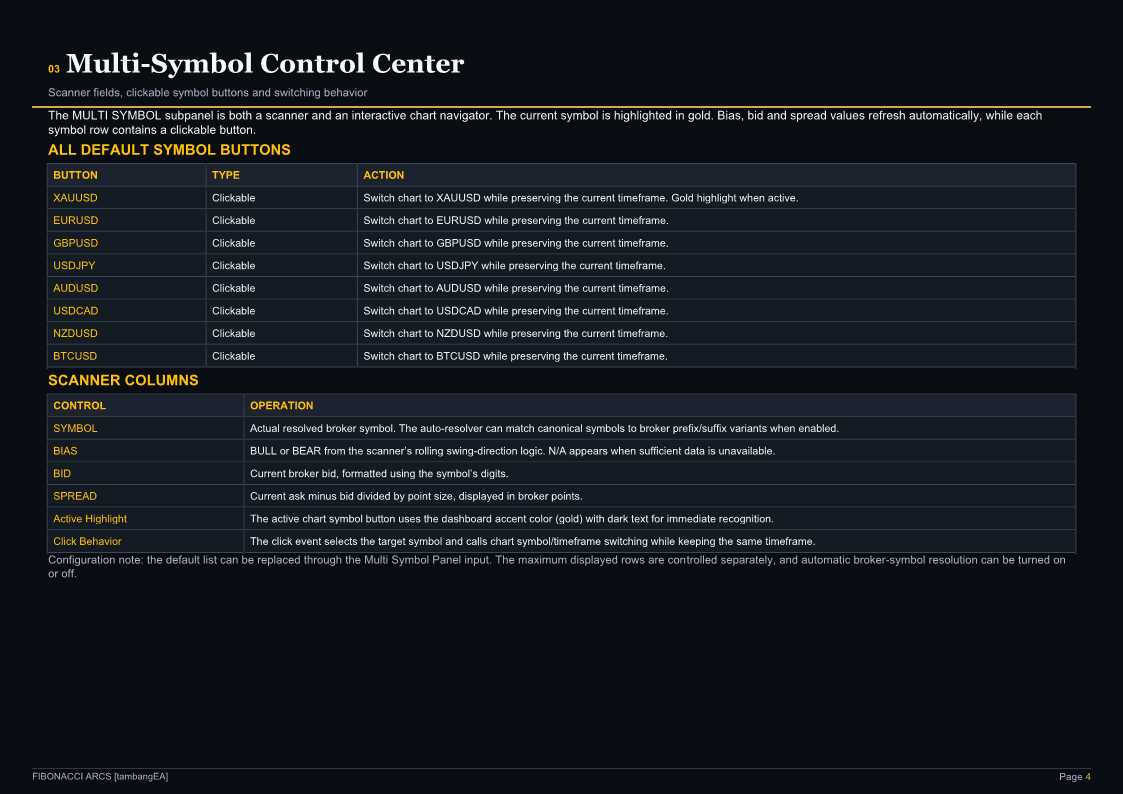
Multi-Symbol Dashboard
FIBONACCI ARCS [tambangEA] includes an integrated multi-symbol monitor.
The scanner displays:
SYMBOL | BIAS | BID | SPREAD
For example:
XAUUSD — BULL
EURUSD — BEAR
GBPUSD — BULL
USDJPY — BEAR
Symbol buttons can be clicked directly from the dashboard to switch the active chart while retaining the working timeframe.
The active chart symbol is highlighted for quick visual identification.
This makes the dashboard useful for traders who monitor several Forex, Gold, index, or cryptocurrency instruments simultaneously.
Fibonacci Arc Structure
The indicator calculates the Arc geometry from both:
Horizontal swing distance — Time
and
Vertical swing distance — Price
This creates dynamic curved zones rather than conventional horizontal Fibonacci lines.
Available levels are:
23.6% — Early reaction zone
38.2% — Moderate retracement / structural zone
50.0% — Mid-range equilibrium reference
61.8% — Major Fibonacci decision zone
78.6% — Deep expansion / reaction zone
100.0% — Outer swing projection boundary
The Arc dimensions can be adjusted independently using Horizontal Scale and Vertical Scale settings.
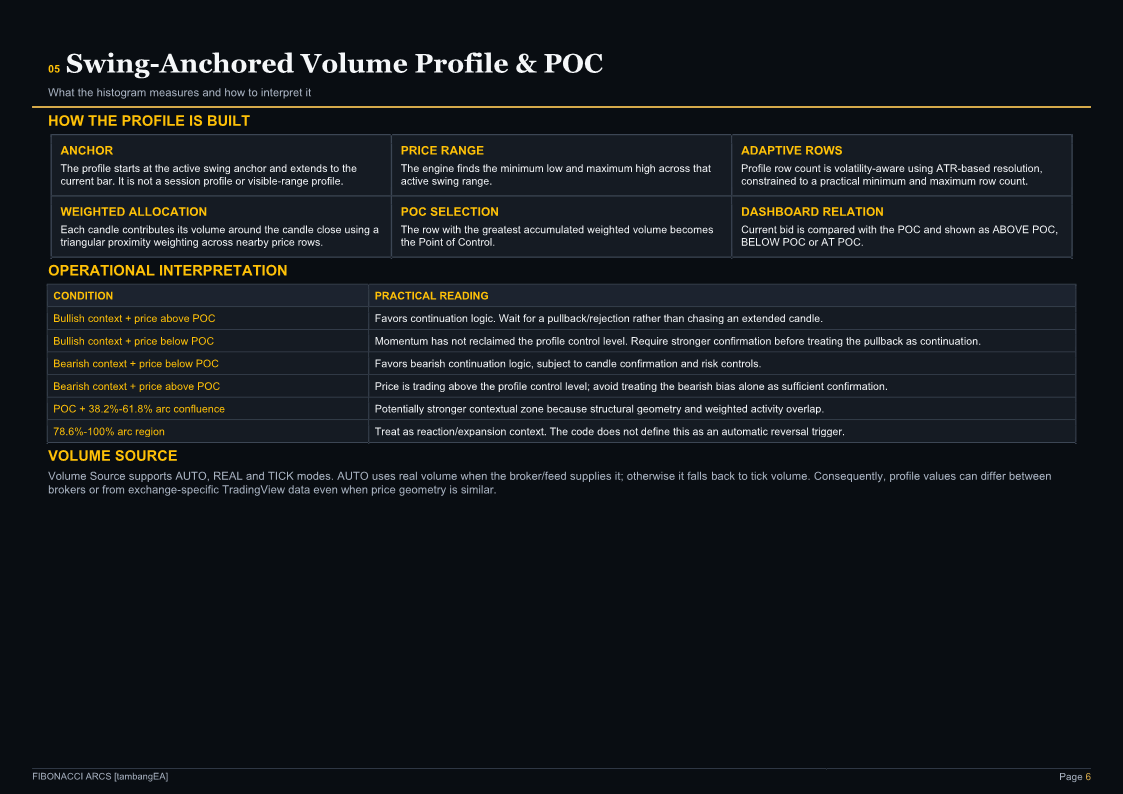
Volume Profile & Point of Control
The indicator calculates a Volume Profile from the current swing anchor to the latest market data.
Volume is distributed across adaptive price bins, and the highest-volume area is identified as the Point of Control (POC). The profile width is normalized relative to the strongest volume bin.
POC can be used as an additional market-context reference:
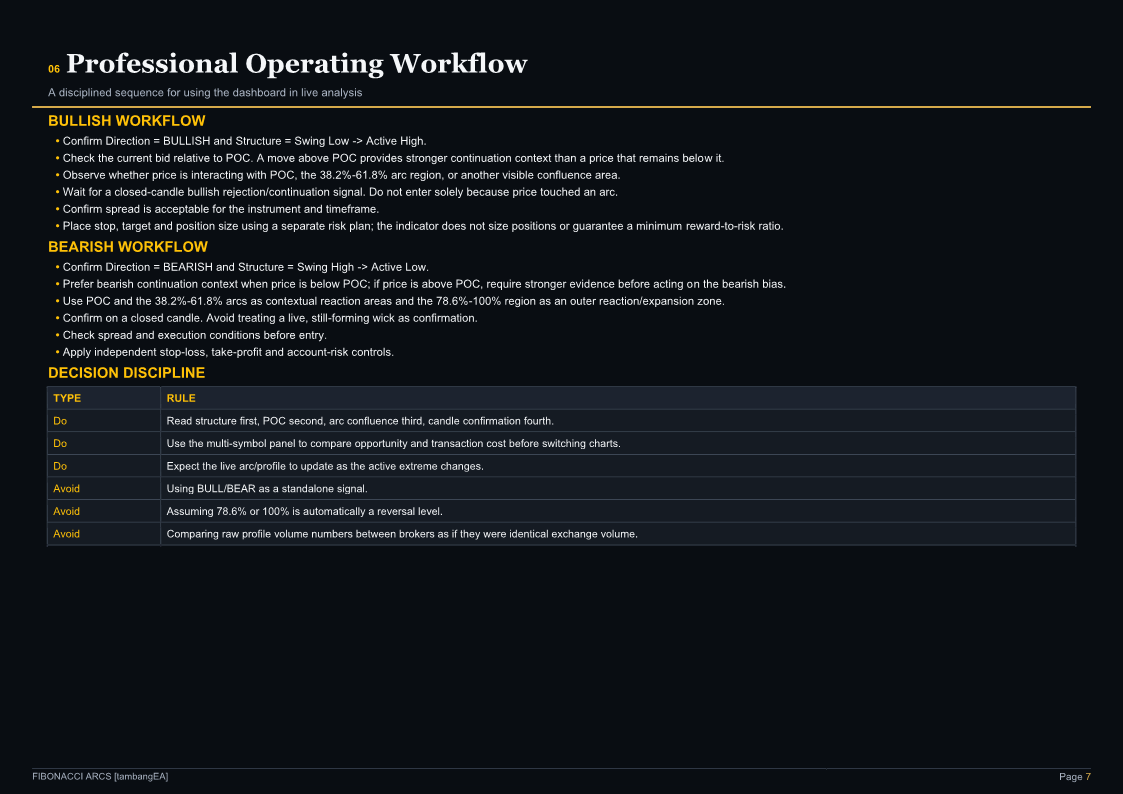
Bullish context
Price above POC → monitor pullbacks and bullish acceptance.
Bearish context
Price below POC → monitor rallies and bearish rejection.
POC should be combined with price action, market structure, volatility, and appropriate risk management rather than used as a standalone entry signal.
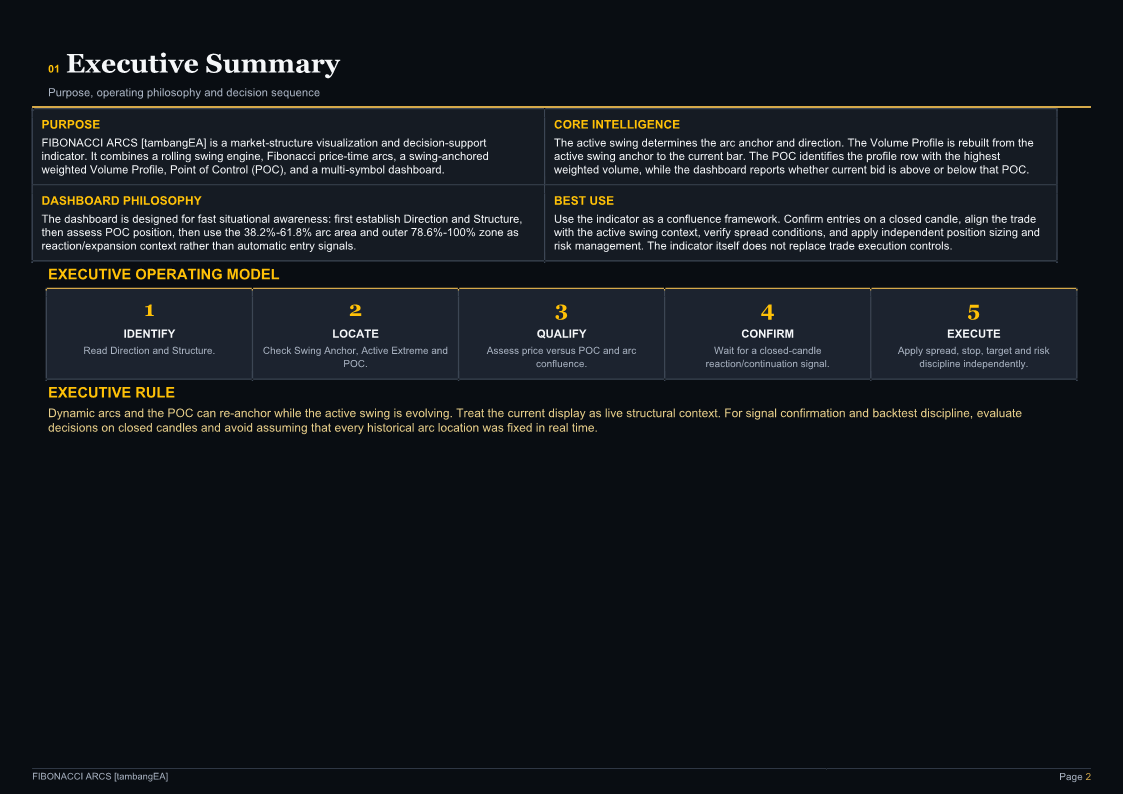
Suggested Trading Workflow
A practical workflow is:
1. Identify the structural bias
Check whether the dashboard indicates BULLISH or BEARISH.
2. Locate the Swing Anchor
The Swing Anchor represents the structural origin used by the current Fibonacci Arc calculation.
3. Monitor the Active Extreme
This shows the developing opposite end of the active swing.
4. Evaluate the POC
Determine whether current price is trading above, below, or around the Point of Control.
5. Watch the Fibonacci Arc zones
Pay particular attention to confluence around:
38.2% / 50.0% / 61.8%
and use:
78.6% / 100.0%
as deeper expansion or reaction areas.
6. Wait for price confirmation
Possible confirmation methods include:
- rejection candles,
- breakout and retest,
- higher-low / lower-high structure,
- momentum continuation,
- support/resistance confluence.
7. Apply independent risk management
Always determine stop loss, position size, and maximum acceptable risk before entering a trade.
Recommended Markets
FIBONACCI ARCS [tambangEA] can be applied to:
- Gold / XAUUSD
- Forex major and cross pairs
- Stock indices
- Cryptocurrencies
- CFDs
- Other sufficiently liquid instruments
It can also be used on different chart periods depending on the trader's strategy.
Lower timeframes provide faster structural changes, while higher timeframes generally produce broader swing structures.
Customization
Users can customize:
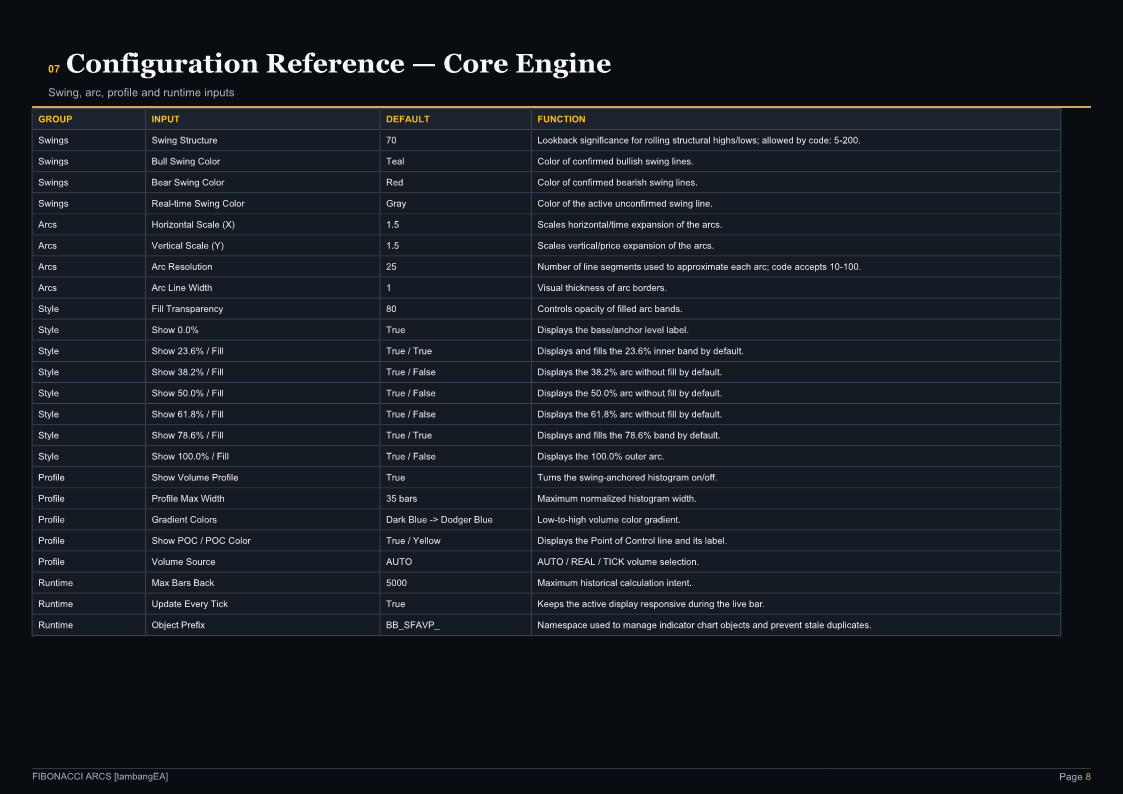
- Swing Structure length
- Bull Swing color
- Bear Swing color
- Real-Time Swing color
- Horizontal Arc Scale
- Vertical Arc Scale
- Arc Resolution
- Arc Line Width
- Individual Fibonacci levels
- Fibonacci colors
- Zone fills
- Fill transparency
- Volume Profile visibility
- Profile width
- Profile colors
- POC visibility
- POC color
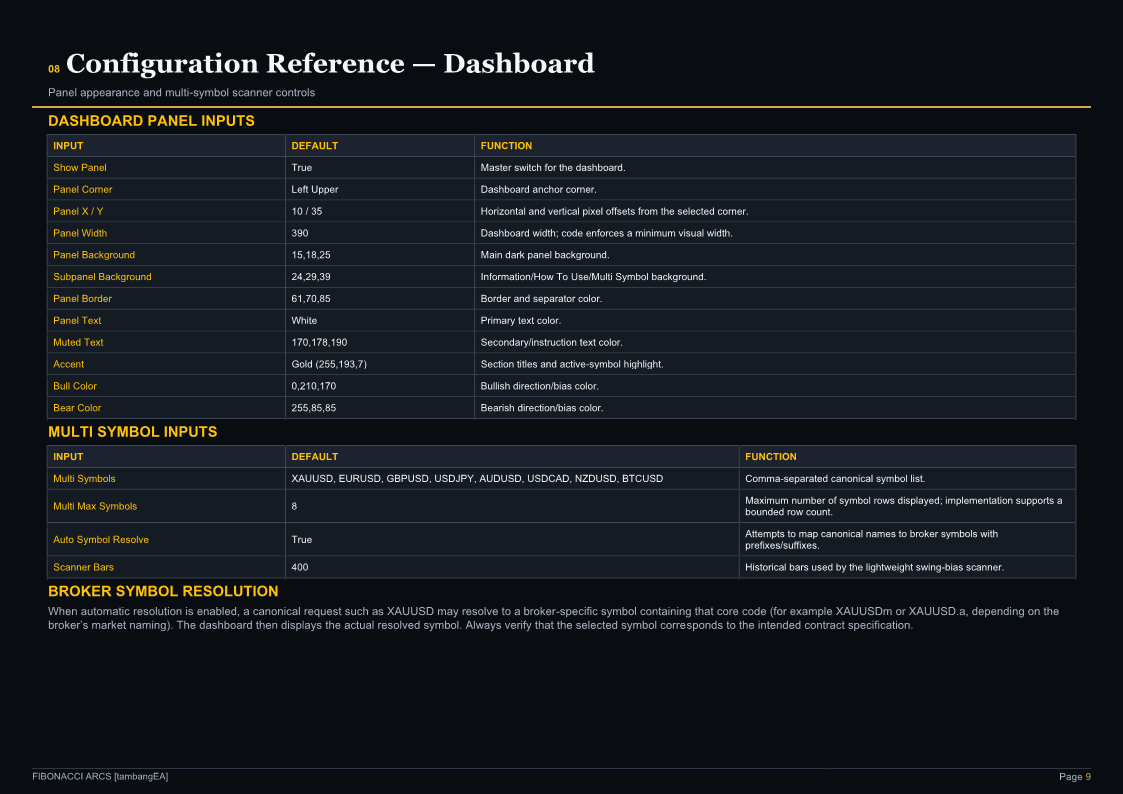
- Dashboard appearance
- Multi-symbol list
- Scanner depth
The underlying source supports configurable swing sensitivity, X/Y Arc scaling, segment resolution, line width, individual Fibonacci levels, fills, Volume Profile width, gradient colors, and POC display.
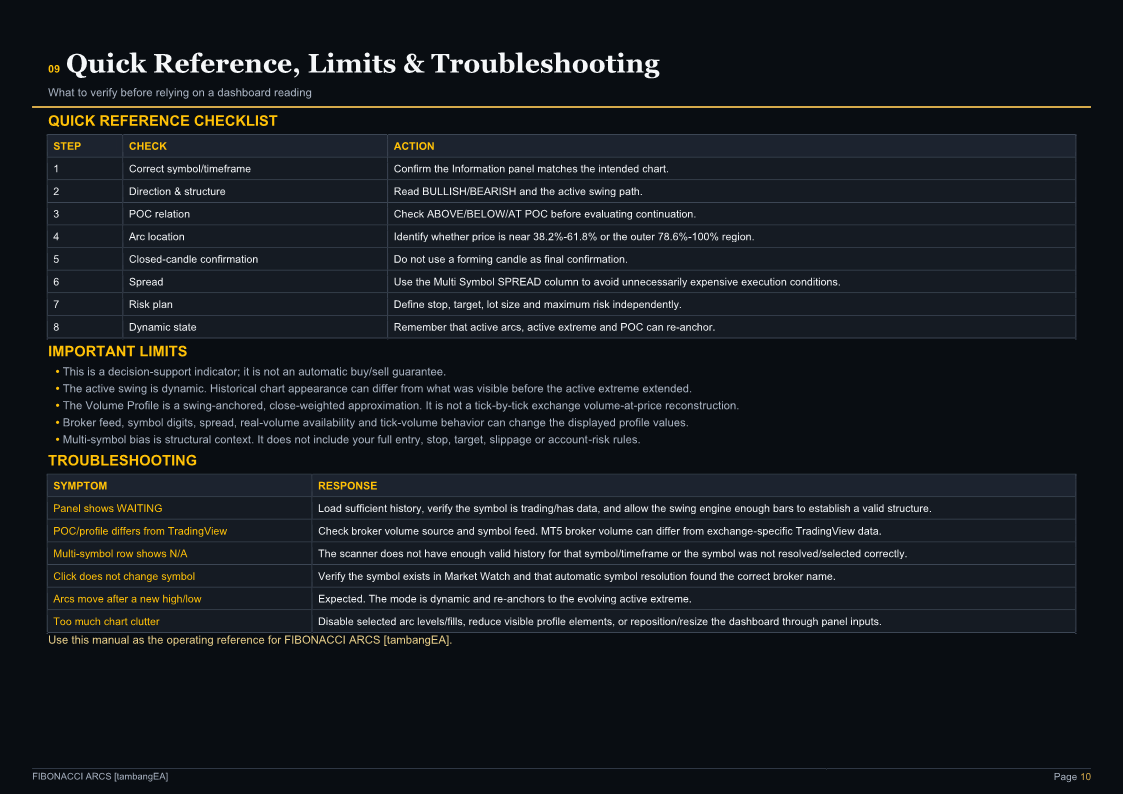
Important: Dynamic Indicator Behavior
FIBONACCI ARCS [tambangEA] follows the currently developing swing.
When the market creates a new structural extreme, the Active Extreme may change and the current Fibonacci Arc geometry may be recalculated.
Therefore:
Active Fibonacci Arcs are dynamic.
This behavior is intentional and allows the indicator to follow developing market structure in real time.
Confirmed historical structures and current developing structures should therefore be interpreted differently.
Intended Use
FIBONACCI ARCS [tambangEA] is designed as a market analysis and decision-support tool.
It does not guarantee future market direction and should not be interpreted as financial advice or as an automatic profit-generating system.
For best results, combine the indicator with:
- market structure,
- price action,
- support and resistance,
- volatility analysis,
- session awareness,
- disciplined position sizing,
- and independent risk management.