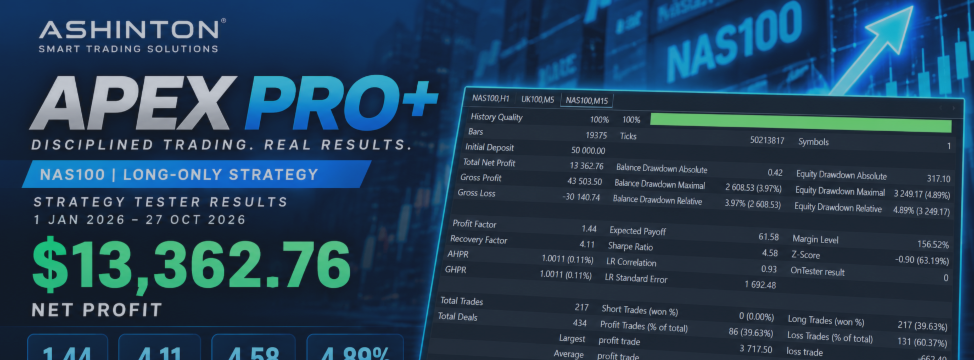
APEX PRO+: NASDAQ Long-Only Strategy Delivers $13,362 in Backtest Profit

Discover the performance potential of APEX PRO+ with a long-only trading approach on NAS100.
A powerful strategy within Ashinton Smart Ultra Pro+, combining systematic execution, performance monitoring, and a risk-conscious approach to trading.
What happens when a focused trading strategy meets a structured approach to risk management? Our latest NAS100 Strategy Tester results provide an opportunity to examine the performance of APEX PRO+, one of the trading strategies integrated into the Ashinton Smart Ultra Pro EA.
Tested from 1 January 2026 to 27 October 2026, this backtest produced positive results, with a combination of net profit, a solid profit factor, and measured drawdown.
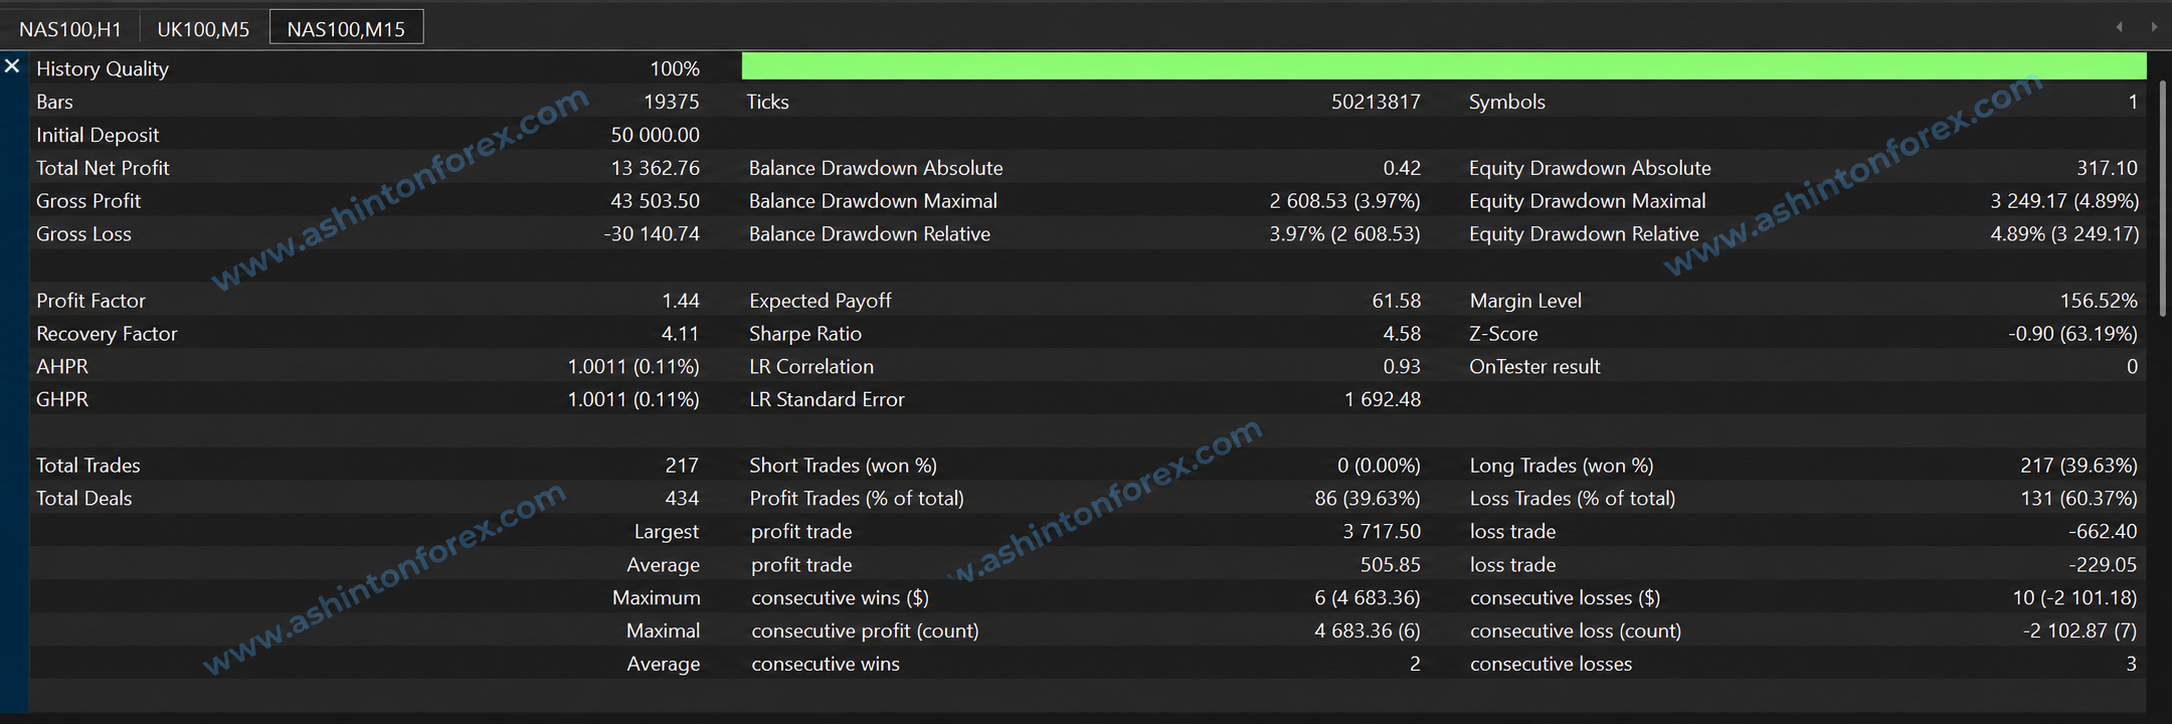
Key Backtest Results
- Net Profit: $13,362.76
- Profit Factor: 1.44
- Recovery Factor: 4.11
- Sharpe Ratio: 4.58
- Maximum Equity Drawdown: 4.89%
- Maximum Balance Drawdown: 3.97%
- Total Trades: 217
- Winning Trades: 86 (39.63%)
- Initial Deposit: $50,000
- History Quality: 100%
Turning Market Opportunities into Results
The strategy generated $13,362.76 in net profit during the test period. Against the initial deposit of $50,000, that represents approximately 26.73% growth over the backtest.
With a profit factor of 1.44, the strategy generated $1.44 in gross profit for every $1 in gross loss. This provides a useful measure of how its profitable and losing trades balanced out over the tested period.
Long-Only Trading on NAS100
This test used a long-only configuration, with all 217 trades taken in the buy direction. No short trades were recorded.
This approach allows traders to evaluate how APEX PRO+ performs when configured to seek buying opportunities in NAS100, without mixing long and short results in the same test.
Prop Firm Ready: Recovery and Risk Metrics Matter
Profit alone does not tell the whole story. The report also recorded:
- 4.11 Recovery Factor, showing net profit relative to maximum drawdown.
- 4.58 Sharpe Ratio, reflecting the tester's risk-adjusted performance calculation.
- 4.89% Maximum Equity Drawdown, representing the largest reported equity decline.
- 3.97% Maximum Balance Drawdown, representing the largest reported balance decline.
These figures provide additional perspectives for evaluating the strategy beyond its headline profit.
A Closer Look at Trade Performance
The report recorded 86 profitable trades and 131 losing trades, giving a win rate of 39.63%. Despite fewer winning than losing trades, the strategy finished the test with positive net profit.
The average winning trade was $505.85, compared with an average losing trade of $229.05. This illustrates how the relationship between average wins and average losses can matter just as much as win rate when assessing a trading system.
Evaluate APEX PRO+ for Your Trading Approach
APEX PRO+ is designed for traders who want a systematic approach to the markets. This NAS100 backtest offers one example of its performance under a specific configuration: long-only trading over the period tested.