Currencies Strength Lines and Table

separate indicator window for Currencies Strength smooth lines for up to 20 symbols based on (5) time frames

 &&&

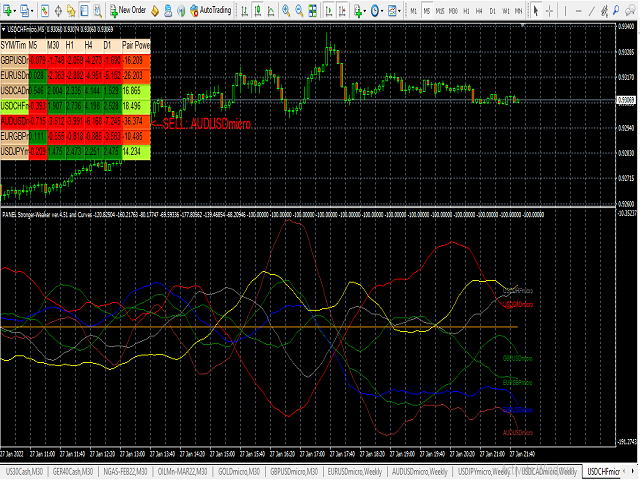
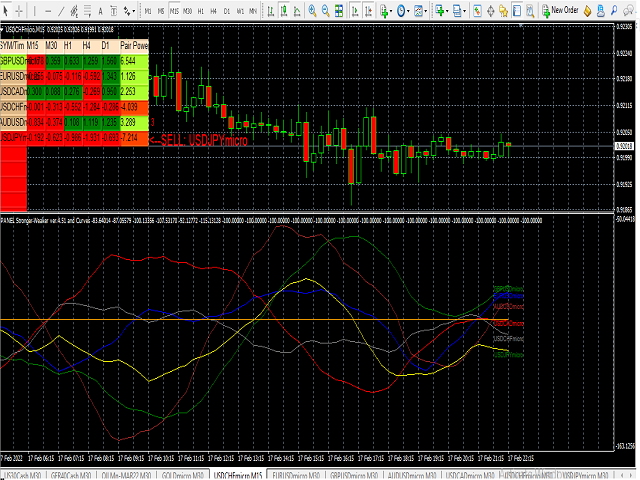
MAIN Window Power TABLE for up to 20 Symbols for (5) timeframes and the Total calculated Symbols strength for each


1- Currencies Strength 

- It draws smooth lines for up to 20 currencies pairs representing Volatility  strength and power calculated by 5 selected time frames not only

***Works on any Time frame but i recommend from M15 M30 H1 .... (lowest frames need higher index of calculation values)


2- Power Table :::

YOU DON'T HAVE TO SHIFT ON ALL TIME FRAMES FOR EACH CURRENCY PAIR TO CONCLUDE ITS TREND AND ITS POWER

YOU HAVE IT ALL IN ONE TABLE , 20 CURRENCY PAIR WITH 5 TIME FRAMES

ALSO , COMPARE BETWEEN CURRENCIES STRENGTH

AND ALERTS THE STRONGER /WEAKER PAIR BASED ON 5 TIMEFRAMES CALCULATIONS

- helpful tool to indicate the TREND strength of up to 20 currencies pairs 

using 5 time frames    (latest version You SELECT you own 5 timeframes from M1 to D1)

table shows the   STRONG pair among all 20 pairs in   GREEN 

able shows the   WEAKER pair among all 20 pairs in   RED

An advisory label " BUY pair " is shown with the STRONGER pair calculated

An advisory label " SELL pair " is shown with the WEAKER pair calculated

Click symbol label to open its chart to trade

Click on Advisory BUY/SELL labels to open corresponding symbol chart to trade

when all cells values in a row for a pair is in RED -->indicates very BEAR Trend

when all cells values in a row for a pair is in GREEN-->indicates very BULL Trend

USE IT ON any  chart TimeFrame

Inputs: 1- powerindex : 5/   10/20/30.... (I use 30 !)

           up to 20 pairs (   you can compare 2,3,5,....20 : but any incorrect pairs will STOP the indicator - leave unwanted symbols empty "")

           2- Up to 20 different symbols pairs 

   3- 5 input time frames

STRATEGY1: BUY STRONGER PAIR / SELL WEAKER PAIR

STRATEGY2: BUY STRONGER PAIR When low timeframe value turns from Red to Green

                    SELL WEAKER PAIR When low time frame value turns from Green to Red

CLOSE open BUY trade when All / Lower time frames M5/M1 and M5/M15/M30 color turns RED 

CLOSE open SELL trade when All /Lower time frame M5/M1 and M5/M15/M30 color turns GREEN 


*make sure to download enough symbols data  M1to D1 for all input symbols before installing

**make sure for correct input symbols (as symbols differs from brokers to another and from account to another)

**make sure to test it before purshase !


Recommended products
Alpha Trend sign has been a very popular trading tool in our company for a long time. It can verify our trading system and clearly indicate trading signals, and the signals will not drift. Main functions: Based on the market display of active areas, indicators can be used to intuitively determine whether the current market trend belongs to a trend market or a volatile market. And enter the market according to the indicator arrows, with green arrows indicating buy and red arrows indicating se
Crypto_Forex Indicator "CCI with Dynamic OverSold/OverBought zones" for MT4, No Repaint. - Commodity Channel Index (CCI) is excellent for Momentum trading into the trend direction. - It is great to take Sell entries from dynamic OverBought zone and Buy entries from dynamic OverSold zone into the direction of main trend. - This indicator is excellent to combine with Price Action entries as well. - Dynamic OverBought zone - above yellow line. - Dynamic OverSold zone - below blue line. - CCI osci
SystemBinaryM1
Andrey Spiridonov
SystemBinaryM1 - a professional indicator for trading short-term binary options, is a complete, self-contained author's strategy for working in the binary options market. The unique algorithm for analyzing the foreign exchange market is based on the calculation of reference points on three different time periods M15, M5. M1. Thus, the indicator simultaneously analyzes the long-term, medium-term and short-term price behavior before issuing a signal. The indicator is set in the usual way and work
PABT Pattern Indicator - it's classical system one of the signal patterns. Indicator logic - the Hi & Lo of the bar is fully within the range of the preceding bar, look to trade them as pullback in trend. In the way if indicator found PABT pattern it's drawing two lines and arrow what showing trend way.  - First line - it's entry point and drawing at: 1. On the high of signal bar or on middle of the signal bar (depending from indicator mode) for buy; 2. On the low of signal bar or on middle of t
Introducing the "Extreme Exhaustion Levels": A powerful tool for traders looking to identify market exhaustion and potential trend reversals. The Exhaustion Indicator is an advanced technical analysis tool that helps traders identify when markets are overbought or oversold, potentially indicating an imminent reversal in the trend. With a unique combination of price action, moving averages, and Bollinger Bands, the Exhaustion Indicator provides traders with a comprehensive view of market condit
Infinity Trend Pro
Yaroslav Varankin
1 (1)
This is a trend indicator without redrawing Developed instead of the binary options strategy (by the color of the Martingale candlestick) Also works well in forex trading When to open trades (binary options) A signal will appear in the place with a candle signaling the current candle It is recommended to open a deal for one candle of the current timeframe M1 and M5 When a blue dot appears, open a deal up When a red dot appears, open a trade down. How to open trades on Forex. When a signal is rec
Trend Oscillator - is an advanced custom  Crypto_Forex indicator, efficient trading tool! Advanced new calculation method is used - 20 options for parameter "Price for calculation". Smoothest oscillator ever developed. Green color for upward trends,  Red color for downward trends. Oversold values: below 5, O verbought values: over 95. There are plenty of opportunities to upgrade even standard strategies with this indicator. With PC and Mobile alerts. Click here to see high quality Trading Robot
Indicator for determining the trend. The arrows and lines on the chart show the price reversal and the probable current trend or correction. You should always trade in the direction of the arrow. It is best to use the indicator on several time frames at once and enter the market when all time frames have the same arrow. For example, we open a sell trade if there is a red arrow on the M5, M30 and H4 timeframes. Or we open a buy deal if the indicator shows a blue arrow on all timeframes. Advanta
VR Cub
Vladimir Pastushak
VR Cub is an indicator for getting high-quality entry points. The indicator was developed to facilitate mathematical calculations and simplify the search for entry points into a position. The trading strategy for which the indicator was written has been proving its effectiveness for many years. The simplicity of the trading strategy is its great advantage, which allows even novice traders to successfully trade with it. VR Cub calculates position opening points and Take Profit and Stop Loss targe
The CCI Divergence is a reasonably useful indicator in itself, but it is even more effective when used with divergence pattern trading. The CCI Divergence indicator signal is one of the most potent signals among the indicators that exist in the market. Here is new version for Divergence Indicator using CCI method, with more improvements. Divergences indicate a potential investment point because the directional moment does not confirm the price. A bullish divergence occurs when the underlying va
Trend Hunter Pro
Yaroslav Varankin
The indicator is designed for opening trades for a long period. he is set up to get as many points from each trade as possible. he uses the scalping method... you can trade on any currency pairs indicator is already  you can trade at any time of the day but the preferred time of trading during the European American session. currency pairs eur / jpy, eur / usd currency pairs with high volatility then the results are much better.
Indicator based trading according to the price analysis of bars, the most popular among traders. The indicators calculated based on larger periods are used for identification of a stable trend on the market, and the ones calculated based on smaller periods are used for entering the market after a correction. The oscillators with overbought and oversold levels have a special place in indicator-based trading. The values of such indicators are subjected to wave structure - the higher waves (chart t
Laser Trend
Nicolas Zouein
The trend is your friend! This is what this indicator is all about. Follow this famous saying and be safe. Characteristics: Buy/Sell signals fixed on the close of a bar. Works on all symbols and all timeframes. Clear visual market trend laser line, Buy/Sell signal arrows, market strength meter, TP1 & TP2 boxes. Visual signals when to enter, when to exit the market. No repainting. Compatible with Flexible EA for trading automation. (Ask for a free set file optimized to perform 2010-2018) Parame
Crypto_Forex   Indicator HTF Ichimoku for MT4. Ichimoku indicator is   one of the most powerful trend indicators . H TF means -   H igher TimeFrame. This indicator is excellent for Trend Traders as well as combination with Price Action entries. HTF Ichimoku  Indicator allows you to attach Ichimoku from higher timeframe to your current chart. Up trend   - red line above blue one (and both lines are above cloud) /  Down trend   - red line below blue one  (and both lines are below cloud). Open BUY
Elite Renko
Jermaine Wedderburn
5 (2)
Renko Charts with Heiken Ashi Filter now have the alerts and the    Win-rate . Now you can know which signal will give you that edge your trading needs. Risk to Reward Settings  Wins versus Losses Count There are four alert types to choose from for notification on screen, email or phone notification. The alert types also have buffers for use with automation. This indicator can be incorporated with any system that requires renko charts. The four (4) alert types are: Three-bar Formation ;  Pinbar
Insider Scalper Binary This tool is designed to trade binary options. for short temporary spends. to make a deal is worth the moment of receiving the signal and only 1 candle if it is m1 then only for a minute and so in accordance with the timeframe. for better results, you need to select well-volatile charts.... recommended currency pairs eur | usd, usd | jpy .... the indicator is already configured, you just have to add it to the chart and trade .... The indicator signals the next candle.
EZZ Zig Zag MT4
Paulo Rocha
5 (1)
EZZ Elite Zig Zag is an indicator for the MetaTrader 4 terminal. This indicator traces the peak of the trend based on the market reversal, thus showing various opportunities in the financial market. EZZ Elite Zig Zag is a visual tool, intuitive, and easy to understand and use.  Test it Yourself by Downloading it for Free. Author Paulo Rocha all rights reserved
Crypto_Forex Indicator "FORCE index and 2 Moving Averages" for MT4. No repaint. - This indicator is excellent for momentum trading into the trend direction. - "FORCE index and 2 Moving Averages"  Indicator allows you to see Fast and Slow Moving Averages of Force index. - Force index is one of the top indicators that combines   price and volume data   into a single value. - Force index itself is powerful oscillator - that measures the amount of power used to move the price. - Indicator gives opp
Next Trend Pro
Eduard Bartashevich
Next Trend Pro INDICATOR - the best trend indicator on the market, the indicator works on all timeframes and assets, the indicator is built on the basis of 12 years of experience in forex and many other markets. You know that many trend indicators on the internet are not perfect, late and difficult to trade with, but the Next Trend Pro indicator is different, the Next Trend Pro indicator shows a buy or sell signal, colored candles confirm the signal, and support levels and resistance levels give
Alpha Trend
Evgeny Belyaev
3 (4)
Alpha Trend is a trend indicator for the MetaTrader 4 platform; it has been developed by a group of professional traders. The Alpha Trend indicator finds the most probable tendency reversal points, which allows making trades at the very beginning of a trend. This indicator features notifications, which are generated whenever a new signal appears (alert, email, push-notification). This allows you to open a position in a timely manner. Alpha Trend does not redraw, which makes it possible to evalua
Indicador Taurus All4
Fabio Oliveira Magalhaes
Taurus All4 Taurus All4 is a high-performance indicator, it will tell you the strength of the trend, and you will be able to observe the strength of the candle. Our indicator has more than 4 trend confirmations. It is very simple and easy to use. Confirmation Modes Candle Trend Confirmations: When the candle switches to light green the trend is high. When the candle switches to light red the trend is reverting down. When the candle changes to dark red the trend is low. Trendline Trend Confirm
[ZhiBiCCI] indicators are suitable for all cycle use, and are also suitable for all market varieties. [ZhiBiCCI] Green solid line is a reversal of bullish divergence. The green dotted line is a classic bullish divergence. [ZhiBiCCI] The solid line to the red is a reverse bearish divergence. The red dotted line is a classical bearish divergence. [ZhiBiCCI] can be set in the parameters (Alert, Send mail, Send notification), set to (true) to send instant signals to the alarm window, email, insta
Easy Technical
Sayed Mohammad Mosavi
Easy Technical Indicator is a powerful tool to detect the market trend and its strength . in addition, The signal Line reduce volatility and convert main trends to  reliable Buy or Sell Signals  ---   Contact me in messages for free gift after purchase!     --- HISTOGRAM: It shows the main trend of the market. A histogram above zero means that the market is bullish A histogram below zero means that the market is bearish The height of the histogram bars indicates the strength of the trend weak,
The indicator displays the data of the Stochastic oscillator from a higher timeframe on the chart. The main and signal lines are displayed in a separate window. The stepped response is not smoothed. The indicator is useful for practicing "manual" forex trading strategies, which use the data from several screens with different timeframes of a single symbol. The indicator uses the settings that are identical to the standard ones, and a drop-down list for selecting the timeframe. Indicator Paramet
The   RSI Divergence + FVG Signal   indicator combines   Relative Strength Index (RSI) Divergence   with   Fair Value Gap (FVG)   detection to generate high-probability buy and sell signals based on both momentum shifts and institutional imbalance zones. Core Features: RSI Divergence Detection : Identifies both regular and hidden bullish/bearish divergences between price and RSI. Divergences indicate potential trend reversals or continuation. FVG Zone Recognition : Detects Fair Value Gaps (imbal
New, more accurate version of the Xmaster indicator. More than 200 traders from around the world have conducted more than 15,000 tests of different combinations of this indicator on their PCs in order to get the most effective and accurate formula. And here we present to you the "Xmaster formula indicator forex no repaint" indicator, which shows accurate signals and does not repaint. This indicator also sends signals to the trader by email and push. With the arrival of each new tick, it constan
Kangaroo Tailz
Brenden Caleb Luebeck
Looking for an indicator that identifies high-probability price action patterns? Love counter-trend trading? The Kangaroo Tailz indicator might be just for you. This indicator is meant to be used as a reversal detector. I personally would rather enter a position at the beginning of a trend rather than catch the last couple of moves. This indicator does a good job of alerting when price may reverse by identifying price action patterns that occur frequently in markets. Even though this indicator i
Daily Candle Predictor is an indicator that predicts the closing price of a candle. The indicator is primarily intended for use on D1 charts. This indicator is suitable for both traditional forex trading and binary options trading. The indicator can be used as a standalone trading system, or it can act as an addition to your existing trading system. This indicator analyzes the current candle, calculating certain strength factors inside the body of the candle itself, as well as the parameters of
Magic Channel
Evgeny Belyaev
4.5 (2)
Magic Channel is a channel indicator for the MetaTrader 4 terminal. This indicator allows finding the most probable trend reversal points. Unlike most channel indicators, Magic Channel does not redraw. The alert system (alerts, email and push notifications) will help you to simultaneously monitor multiple trading instruments. Attach the indicator to a chart, and the alert will trigger once a signal emerges. With our alerting system, you will never miss a single position opening signal! You can t
Rainbow Price Visualizer v1.21 See where the market really breathes. Turns your MT4 chart into an ultra-precise heatmap that highlights price zones favored by big players. Why it matters 300 price levels at 0.2‑pip resolution — microscopic detail. 8 visual themes (Rainbow, Fire, Ocean…) for instant readibility. Smart opacity: low noise fades, real zones pop. Lightweight rendering with automatic cleanup. Fully customizable: saturation, opacity, resolution, history depth. Bands project into the f
Buyers of this product also purchase
Neuro Poseidon MT4
Daria Rezueva
4.95 (21)
Neuro Poseidon is a new indicator by Daria Rezueva. It combines precise trading signals with adaptive TP/SL levels - creating best possible trades as a result! Message me and get  Neuro Poseidon Assistant  as a gift to automize your trading process! What makes it stand out? 1. Proven profitability on all assets and timeframes 2. Only confirmed BUY and SELL signals present on the chart 3. Adaptive TP & SL levels generated by the software for each trade 4. Easy to understand - suitable for all
Scalper Inside PRO
Alexey Minkov
4.74 (68)
Scalper Inside PRO Scalper Inside PRO is an intraday trend and scalping indicator for MetaTrader 4 that uses an exclusive algorithm to quickly detect market direction and key target levels. It automatically calculates entry, exit and multiple profit targets, and shows detailed performance statistics so you can see how different instruments and strategies performed. This helps you choose the most suitable trading instruments for the current market conditions. Additionally, you can easily integrat
M1 Sniper
Oleg Rodin
5 (23)
M1 SNIPER is an easy to use trading indicator system. It is an arrow indicator which is designed for M1 time frame. The indicator can be used as a standalone system for scalping on M1 time frame and it can be used as a part of your existing trading system. Though this trading system was designed specifically for trading on M1, it still can be used with other time frames too. Originally I designed this method for trading XAUUSD and BTCUSD. But I find this method helpful in trading other markets a
Gann Made Easy
Oleg Rodin
4.84 (164)
Gann Made Easy is a professional and easy to use Forex trading system which is based on the best principles of trading using the theory of W.D. Gann. The indicator provides accurate BUY and SELL signals including Stop Loss and Take Profit levels. You can trade even on the go using PUSH notifications. PLEASE CONTACT ME AFTER PURCHASE TO GET TRADING  INSTRUCTIONS AND GREAT EXTRA INDICATORS   FOR FREE! Probably you already heard about the Gann trading methods before. Usually the Gann theory is a ve
PRO Renko System
Oleg Rodin
5 (30)
PRO Renko System is a highly accurate trading system specially designed for trading RENKO charts. The ARROWS and Trend Indicators DO NOT REPAINT! The system effectively neutralizes so called market noise giving you access to accurate reversal signals. The indicator is very easy to use and has only one parameter responsible for signal generation. You can easily adapt the tool to any trading instrument of your choice and the size of the renko bar. I am always ready to provide extra support to help
Trend Catcher ind
Ramil Minniakhmetov
5 (1)
TREND CATCHER INDICATOR Trend Catcher Indicator analyzes market price movements, using a combination of the author’s proprietary and customized adaptive trend-analysis indicators.  It identifies the true market direction by filtering out short-term noise and focusing on underlying momentum strength, volatility expansion, and price structure behavior.  It also uses a combination of smoothing and trend-filtering customized indicators such as moving averages, RSI, and volatility filters.   Real ope
Trend Lines PRO
Roman Podpora
5 (1)
TREND LINES PRO    helps understand where the market is truly changing direction. The indicator shows real trend reversals and points where major players re-enter. You see   BOS lines   Trend changes and key levels on higher timeframes — without complex settings or unnecessary noise. Signals don't repaint and remain on the chart after the bar closes. VERSION MT 5     -     Reveals its maximum potential when paired with the   RFI LEVELS PRO  indicator What the indicator shows: Real shifts   tren
Enigmera
Ivan Stefanov
5 (8)
ENIGMERA: The core of the market (This is a manual indicator and contains features that may not supported by the MetaTrader current testing environment) Introduction This indicator and trading system is a remarkable approach to the financial markets . ENIGMERA uses the fractal cycles to accurately calculate support and resistance levels. It shows the authentic accumulation phase and gives direction and targets.  A system that works whether we are in a trend or a correction.   How It Works Most
Dynamic Forex28 Navigator
Bernhard Schweigert
4.43 (7)
Specials Discount now. The Next Generation Forex Trading Tool. Dynamic Forex28 Navigator is the evolution of our long-time, popular indicators, combining the power of three into one: Advanced Currency Strength28 Indicator (695 reviews) + Advanced Currency IMPULSE with ALERT (520 reviews) + CS28 Combo Signals (recent Bonus) Details about the indicator  https://www.mql5.com/en/blogs/post/758844 What Does The Next-Generation Strength Indicator Offer? Everything you loved about the originals, now
This indicator is an indicator for automatic wave analysis that is perfect for practical trading! Case... Note:   I am not used to the Western name for wave classification. Influenced by the naming habit of Chaos Theory (Chanzhongshuochan), I named the basic wave as   pen   , the secondary wave band as   segment   , and the segment with trend direction   as main trend segment   (this naming method will be used in future notes, let me tell you in advance), but the algorithm is not closely relat
RFI levels PRO
Roman Podpora
5 (1)
The indicator accurately shows the reversal points and price return zones where the   Major players . You see where new trends are forming and make decisions with maximum precision, maintaining control over every trade. VERSION MT5     -     Reveals its maximum potential when combined with the   TREND LINES PRO   indicator What the indicator shows: Reversal structures and reversal levels with activation at the beginning of a new trend. Display of   TAKE PROFIT   and   STOP LOSS   levels with mi
Genesis Matrix Pro is a professional multi-timeframe trend detection indicator designed to help traders identify high-quality market alignment with clarity and structure. It combines 12 different technical indicators into one visual alignment matrix, allowing traders to quickly see when market conditions are bullish, bearish, or neutral. A signal is generated only when the selected strategies are aligned, helping reduce noise and improve decision-making. PLEASE CONTACT ME AFTER PURCHASE TO GET
This product was   updated   for the   2026 market   and   optimized   for the   latest MT5 builds . PRICE UPDATE NOTICE: Smart Trend Trading System   is currently available for $99. The price will   increase to $199   after the next   30 purchases. SPECIAL OFFER:  After purchasing Smart Trend Trading System, send me a private message to claim the Smart Universal EA for FREE and turn your Smart Trend signals into automated trades. Smart Trend Trading System is a complete non-repainting, non-re
MTF Supply Demand Zones
Georgios Kalomoiropoulos
4.82 (22)
Next Generation Of Automated Supply And Demand Zones. New and Innovative Algorithm that Works At Any Chart. All Zones Are Being Created Dynamically According To Price Action Of The Market. AMAZING OFFER --> Activations from 5 to 20 for "MTF Supply Demand Zones" and "Automated Trendlines" If you get the MTF Supply Demand Zones you can join the " Trade Like Me " Video Series. It contains 14 Live Sessions where  i am placing trades on Forex, Stocks, Indices and Metals. You will be able to see ho
PZ Trend Trading
PZ TRADING SLU
4.8 (5)
Capture every opportunity: your go-to indicator for profitable trend trading Trend Trading is an indicator designed to profit as much as possible from trends taking place in the market, by timing pullbacks and breakouts. It finds trading opportunities by analyzing what the price is doing during established trends. [ Installation Guide | Update Guide | Troubleshooting | FAQ | All Products ] Trade financial markets with confidence and efficiency Profit from established trends without getting whips
Step into the world of Forex trading with confidence, clarity, and precision using   Gold Indicator   a next-generation tool engineered to take your trading performance to the next level. Whether you’re a seasoned professional or just beginning your journey in the currency markets, Gold Indicator equips you with powerful insights and help you trade smarter, not harder. Built on the proven synergy of three advanced indicators, Gold Indicator focuses exclusively on medium and long-term trends eli
MetaBands M4
Vahidreza Heidar Gholami
3.5 (6)
MetaBands uses powerful and unique algorithms to draw channels and detect trends so that it can provide traders with potential points for entering and exiting trades. It’s a channel indicator plus a powerful trend indicator. It includes different types of channels which can be merged to create new channels simply by using the input parameters. MetaBands uses all types of alerts to notify users about market events. Features Supports most of the channel algorithms Powerful trend detection algorith
M30/H1/H4 Swing Version Available Want to catch the big moves that M5/M15 can't reach? Gold Signal Swing Pro (M30/H1/H4) is now available. Target $20-$80+ per trade. https://www.mql5.com/en/market/product/177643 KURAMA GOLD SIGNAL PRO (MT4) — Complete XAUUSD Trading System with 7-Layer Filter, Auto TP/SL, and Quality Scoring NON-REPAINTING. NON-REDRAWING. NON-LAGGING. Every signal is permanent. What you see is what you get. BONUS: Buy the lifetime li
Current event:  https://c.mql5.com/1/326/A2SR2025_NoMusic.gif A. What is A2SR ?   * It's a leading technical indicator (no repaint, no lagging). -- Guidance : -- at   https://www.mql5.com/en/blogs/post/734748/page4#comment_16532516 -- and  https://www.mql5.com/en/users/yohana/blog A2SR has a special technique in determining the levels of Support ( demand ) and Resistance ( supply ) . Unlike the ordinary way that we seen on the net, A2SR has a original concept in determining actual SR levels.
BTMM State Engine Pro is a MetaTrader 4 indicator for traders who use the Beat The Market Maker approach: Asian session context, kill zone timing, level progression, peak formation detection, and a multi-pair scanner from a single chart. It combines cycle state logic with a built-in scanner dashboard so you do not need the same tool on many charts at once. What it does Draws the Asian session range; session times can follow broker server offset or be set in inputs. Tracks level progression (L
Neo Wave PRO
Nikolay Raykov
Price & Time Market Structure Indicator A professional market structure tool that analyzes waves through both price and time — not price alone. Main Description NeoWave PRO is a professional market structure indicator for MetaTrader 4 designed for traders who want to move beyond traditional one-dimensional wave tools such as ZigZag, swing indicators, and basic high/low systems. Most wave indicators analyze only one thing: Price. But a real market wave is not only a price movement. A true wave de
Quant Direction
Georgios Kalomoiropoulos
Quant Direction is a 3 dimensional market analysis tool. It provides a purely objective, algorithmic view of the market by calculating exact percentage-based biases across multiple dimensions simultaneously. Developed utilizing advanced AI modeling tools and subjected to thorough testing, this algorithm is engineered to read the market with unique precision. It can analyze any currency pair or financial instrument available on your platform.  Quant Direction is the ideal tool whether you are a S
MonsterDash Harmonic Indicator is a harmonic pattern dashboard. It recognizes all major patterns. MonsterDash is a dashboard that displays all detected patterns for all symbols and (almost) all timeframes in sortable and scrollable format. Users can add their own user defined patterns . MonsterDash can open and update charts with the pattern found. Settings MonsterDash's default settings are good enough most of the time. Feel free to fine tune them to your needs. The color settings are for thos
NAM Order Blocks
NAM TECH GROUP, CORP.
3.67 (3)
MT4 Multi-timeframe Order Blocks detection indicator. Features - Fully customizable on chart control panel, provides complete interaction. - Hide and show control panel wherever you want. - Detect OBs on multiple timeframes. - Select OBs quantity to display. - Different OBs user interface. - Different filters on OBs. - OB proximity alert. - ADR High and Low lines. - Notification service (Screen alerts | Push notifications). Summary Order block is a market behavior that indicates order collection
Apollo SR Master is a Support/Resistance indicator with special features which make trading with Support/Resistance zones easier and more reliable. The indicator calculates Support/Resistance zones in real-time without any time lag by detecting local price tops and bottoms. Then to confirm the newly formed SR area, the indicator shows special signal which signalizes that the SR zone can be taken into consideration and used as an actual SELL or BUY signal. In this case the strength of the SR zone
PowerBall Signals is a BUY/SELL signals indicator based on the idea of using support/resistance zones. The indicator detects special reversal patterns based on support/resistance zones and provide these signals on your chart. The main idea of the indicator is using the MTF (Multi Time Frame) analysis and provide signals based on the levels from your current and next higher time frame. This method allows to predict possible price reversals on any market be it currencies, metals, indices or even c
Auto Optimized Parabolic RSI: Advanced 3D Momentum Engine Most retail indicators fail because they rely on static inputs that break the moment market volatility shifts. Auto Optimized Parabolic RSI solves the problem of "indicator decay" by continuously recalculating its own mathematical edge, bringing institutional-grade quantitative adaptation directly to your MT5 terminal. The Core Advantage: Custom In-Memory 3D Optimization   Standard auto-optimizers often freeze the MT5 platform because the
GoldRush Trend Arrow Signal V1.6 The GoldRush Trend Arrow Signal indicator V1.6 continues to provide precise, real-time trend analysis tailored for high-speed, short-term scalpers in XAU/USD , but it now has additional features and improved efficiency and reliability. Built specifically for the 1-minute time frame, this tool displays directional arrows for clear entry points, allowing scalpers to navigate volatile market conditions with confidence. The indicator consists of PRIMARY and SECONDARY
PZ 123 Pattern
PZ TRADING SLU
1 (1)
Unlock powerful breakout opportunities The 123 Pattern is one of the most popular, powerful and flexible chart patterns. The pattern is made up of three price points: a bottom, a peak or valley, and a Fibonacci retracement between 38.2% and 71.8%. A pattern is considered valid when the price breaks beyond the last peak or valley, moment at which the indicator plots an arrow, rises an alert, and the trade can be placed. [ Installation Guide | Update Guide | Troubleshooting | FAQ | All Products  ]
Bull versus Bear
Mohamed Hassan
4.5 (18)
Send us a message after your purchase to receive more information on how to get your  BONUS  for FREE  that works in great combination with Bull vs Bear ! Bull versus Bear is an easy-to-use Forex indicator that gives traders clear and accurate signals based on clear trend retests . Forget about lagging indicators or staring at charts for hours because  Bull vs Bear provides real-time entries with no lag and no repaint, so you can trade with confidence. Bull vs Bear  helps you enter trades during
More from author
Trend and Reversal V1
Mohamed yehia Osman
Trend Follower and Reversal Trend handler * EA opens X Lot position (calculated according to Lot risk value) with trend with indicated TP if Trend reversal occurs * EA opens 5 X Lot (if input " Reversal Lot scaling" = 5     ) position with reversal trend with indicated TP and same SL for old trend position * Increasing LOT risk value + Increasing Reversal Lot scaling value = High Risk and High Profit and High DD * Decreasing LOT risk value + Decreasing Reversal Lot scaling = Low Risk and Low Pr
HEDGING  MASTER line indicator    It compares the power/strength lines of two user input symbols and create a SMOOTHED line that indicates the degree of deviation of the 2 symbols Strategy#1- FOLLOW THE INDICATOR THICK LINE when CROSSING O LEVEL DOWN --- TRADE ON INDICATOR THICK LINE (TREND FRIENDLY) !! Strategy#2- TRADE INDICATOR PEAKS (Follow indicator Reversal PEAKS Levels)!! you input - the index of calculation ( 10/20/30....)                 - the indicator Drawing start point (indicator hi
Trend Lines Signal
Mohamed yehia Osman
This Indicator provides Buy/Sell Signal based on calculations on Higher frame (Trend) and Lower frame(Entry signals) * You should select the higher and lower frame for indicator calculations * You select the Trend line colors as you prefer * Enable or disable Alerts! Trend lines UP/Down are drawn when a trend is detected Wait for small arrows for entry : *Normally an UP arrow in an UP Trend is a BUY signal : ---you Close the BUY position IF a Reverse DOWN Trend signal appears Or when Up trend li
Automatic redrawing of Trend Supports and resistances levels and Possible Wedge pattern formation to indicate price breaking of Rising Wedge (signal SELL) or price breaking of falling Wedge (signal BUY) Very simple and smart indicator  ALERTS AND MOBILE NOTIFICATIONS availavle !!! you can edit the calculation bars of the bars count for formation of the trend lines and the initial shift from current price  Smaller values for bars /shift inputs when using Higher Time frames (D1-H4) and the reverse
:::: It is programmed to work on any M5 Chat windows !! Used to determine the Strongest currency pairs and the Weakest pairs also detect the peak of deviation of currencies strength  IT CAN BE USED FOR INDICES AND STOCKS TOO !! Strategy one : It can be used in to BUY Strongest pair and SELL Weakest one Strategy two: It can be used on Daily basis to Hedge BUY Strongest pair with high % (ex: +1%) and BUY Weakest one with % lower(ex: -0.7%) the same with SELL  Strategy three: on 3days  or above ca
Auto redrawn Pivot support resistance horizontal lines  with signal of Buy/Sell possibilities with SL level and with trend support resistance lines too used for all symbols and time frames  you can adjust inputs parameters (only 2) and test it on various symbols and time frames input number of bars for calculation and moving average for signal accuracy example : use it on M30 time frame with input 200 for bars count and 100 for MA
Price Predictor
Mohamed yehia Osman
Price Predictor is an indicator that shows precise price reversals taking into account a higher time frame and a lower time frame candle patterns calculations it is great for scalping and swing trading  . Buy and sell arrows are shown on the chart as for entry signals.  BIG Arrows indicates the trend - SMALL Arrows signal a trade (BUY/SELL)   - A Green BIG UP Arrow with a support green line indicates a Bull Market : wait for buy signal       - A Green SMALL Up Arrow after a BIG green arrow is
A simple Approach to Elliot waves patterns Signal generated on trend continuation when breaking the "5" level or on corrective direction after 1-5 waves detected 1-5 labeled points arrows used for signal UP/DOWN direction Chaotic patterns in Blue are drawn all times until  a 1-5 Elliot wave pattern detected  1-5 Red pattern in Bull Market : UP arrow in BULL trend continuation OR DOWN arrow  as a reversal DOWN direction as pattern correction 1-5 Green pattern in Bear Market :DOWN arrow in BEAR tr
YOU DON'T HAVE TO SHIFT ON ALL TIME FRAMES FOR EACH CURRENCY PAIR TO CONCLUDE ITS TREND AND ITS POWER YOU HAVE IT ALL IN ONE TABLE , 20 CURRENCY PAIR WITH 5 TIME FRAMES ALSO , COMPARE BETWEEN CURRENCIES STRENGTH AND ALERTS THE STRONGER /WEAKER PAIR BASED ON 5 TIMEFRAMES CALCULATIONS The Power meter currencies table is a very helpful tool to indicate the TREND strength of up to 20 currencies pairs  using 5 time frames M5 M30 H1 H4 and D1 ( latest version You SELECT you own 5 timeframes from M1 t
Auto redrawn Pivot support resistance horizontal lines  with signal of Buy/Sell possibilities with SL level and with trend support resistance lines too used for all symbols and time frames  you can adjust inputs parameters (only 2) and test it on various symbols and time frames input number of bars for calculation and moving average for signal accuracy example : use it on M30 time frame with input 200 for bars count and 100 for MA
Smart and simple Indicator based on wolves waves reversal pattern also near to falling and rising wedge and butterfly patterns with Stoploss and entry signal preferred time frame M30 : with parameters bars count used for calculation = 200 and moving average for accuracy = 100; you can try it for other higher or lower parameters and try your own set of inputs higher timeframe = lower input !!! important note ::: Indicator don't back draw when first installed on Chart  once installed wait for new
Moving Trend Lines
Mohamed yehia Osman
Simple moving trend lines with support and resistance moving levels  used on any time frame on any symbols input: # of bars for trend lines (10-20- 50-100-200----) as per your time frame and your strategy  and     moving period ( 10-20 -50-100-200----) as per your time frame and your strategy Direction Arrows : UP and DOWN are drawn when breaking the trend lines ALerts available at Arrows appearance...  
Buy Sell Zones
Mohamed yehia Osman
Simple indicator for BUY / Sell Zones moving Buy and Sell zones : Closest zone is wide and clear : Red for Sell zone , Green for Buy zone >>> old far zones are in bold lines :::BUY Zones (GREEN) appear only in UP Trend and disappear in DOWN Trend :::SELL Zones (RED) appear only in DOWN Trend and disappear in UP Trend input parameters ::: index bars : bars range for zone calculation levels : number of zones  Up move/Down move arrows mail and message Alerts !! used on any symbol used on any timefr
Crazy Dancing moving RES/SUP Levels Automatic redrawing of moving Supports and resistances levels  to indicate price breaking supports (signal SELL)  or breaking resistance levels (signal BUY) Very simple appearing indicator but very clever and smart too !!!! Main Inputs: # of bars for the support and resistances levels + the initial shift from start + moving average for filter signaling Smaller values for bars /shift inputs when using Higher Time frames (D1-H4) and the reverse higher values for
Select from up to 6 Strategies solo or Combine different strategies for signal generation  (Combining more than 2 strategies may LIMIT a lot the number of signals)! ALL From Chart !!! Also Inputs editing from Chart !!! Push your strategy bottom (one strategy) OR Combine signal from as may strategies (up to 6) : Selected and enabled strategies will be in GREEN !!! 1- BUY SELL areas 2- Support resistance break signal 3- Elliot wave continuation /reversal signal 4- Advanced Moving averages 5- Tren
SMOOTH DEVIATION line indicator for 2 symbols   It compares the power/strength lines of two user input symbols and create a SMOOTHED line that indicates the degree of deviation of the 2 symbols Strategy#1- FOLLOW THE INDICATOR THICK LINE when CROSSING O LEVEL DOWN --- TRADE ON INDICATOR THICK LINE (TREND FRIENDLY) !! Strategy#2- TRADE INDICATOR PEAKS (Follow indicator Reversal PEAKS Levels)!! you input - the index of calculation ( 10/20/30....)                 - the indicator Drawing start point
Simple 3 Moving  supports and resistance levels (Your Review /comment and feedback is important  !! Thanks) Signal UP and Down possibilities created on crossing the multi supports/resistance levels supports all time frames Adjusted inputs for area covered for generating the levels and the shifts needed to cover 3 areas supports /resistances levels for example you may use main parameters in M30 time frames: extern int ShiftFromStart=20;  extern int barsCount=20; extern int sequenceShifts=50;  in
SMOOTH STRENGTH METER INDICATOR (SMOOTH LINE) it draws Currencies TREND Volatility Power / Strength lines : -       Detects the 2 highly TRENDED Volatile pairs  ( will be the Bold Lines ) - A very Helpful Indicator - It draws smooth lines for up to 20 currencies pairs representing Volatility  strength and power - First it indicates the most powerful trended direction pairs : Strongest / Weaker -       MAIN FUNCTION  :it gives indication of the       UP trend most Volatile Line  and the      DOWN
Trend Whale
Mohamed yehia Osman
Smart EA based on Trend and Support Resistance Levels with SL results given on EURUSD  H1 for last 10 months IF AUTOLOT enabled: **if LotRisk =1- 3 ---- Profit up to 50%  DD up to 17% **if LotRisk > 5 /10 /20 --- HIGH RISK --- HIGH Profit up to 1600 % or More but High DD up to 40% tested also on other symbols GBPUSD with positive results *** used parameters on H1 timeframe  bars 25  shift 4 ma index 0.85 for lower time frames Inputs will me doubled or tripled ...  for higher time frames inputs
Trend Balance Bar
Mohamed yehia Osman
Trend Bar Balance Indicator Simple indicator based on trend detection and support resistance breakage  It detects the major trend and the minor support and resistance levels *** a signal for UP /BUY is detected and alerted in a BULL trend and a resistance level break *** a signal for DOWN /SELL is detected and alerted  in a Bear trend and a support level break THE POWER OF THIS INDICATOR I USE IT WHEN YOU COMBINE ITS DAILY SIGNALS FROM DIFFERENT CHART SYMBOLS AT SAME TIME AND CLOSE ALL ORDERS BY
PowerMeter Currencies Table1
Mohamed yehia Osman
5 (1)
SYMBOL POWER based on inputted 5 time frames and Compared to 20 Other Symbols !! Great Indicator YOU DON'T HAVE TO SHIFT ON ALL TIME FRAMES FOR EACH CURRENCY PAIR TO CONCLUDE ITS TREND AND ITS POWER YOU HAVE IT ALL IN ONE TABLE , 20 CURRENCY PAIR WITH 5 TIME FRAMES ALSO , COMPARE BETWEEN CURRENCIES STRENGTH AND ALERTS THE STRONGER /WEAKER PAIR BASED ON 5 TIMEFRAMES CALCULATIONS ALEERTS enable /disable using 5 time frames M5 M30 H1 H4 and D1   ( latest version You SELECT you own 5 timeframes from
Automatic redrawing of Trend Supports and resistances levels and Possible Wedge pattern formation to indicate price breaking of Rising Wedge (signal SELL) or price breaking of falling Wedge (signal BUY) Very simple and smart indicator  ALERTS AND MOBILE NOTIFICATIONS availavle !!! you can edit the calculation bars of the bars count for formation of the trend lines and the initial shift from current price  Smaller values for bars /shift inputs when using Higher Time frames (D1-H4) and the reverse
Multi Strategies Single Combined   Select from up to 6 Strategies solo or Combine different strategies for signal generation  (Combining more than 2 strategies may LIMIT a lot the number of signals)! ALL inputs and Strategies selection From Chart !!! Also Inputs editing from Chart !!! Push your strategy bottom (one strategy) OR Combine signal from as may strategies (up to 6) : Selected and enabled strategies will be in GREEN !!! 1- BUY SELL areas 2- Support resistance break signal 3- Elliot wave
Buy Sell Zones1
Mohamed yehia Osman
Buy Sell Zones   Simple indicator for BUY / Sell Zones moving Buy and Sell zones : Closest zone is wide and clear : Red for Sell zone , Green for Buy zone >>> old far zones are in bold lines :::BUY Zones (GREEN) appear only in UP Trend and disappear in DOWN Trend :::SELL Zones (RED) appear only in DOWN Trend and disappear in UP Trend input parameters ::: index bars : bars range for zone calculation levels : number of zones  Up move/Down move arrows mail and message Alerts !! used on any symbol u
Trend Lines Signal   This Indicator provides Buy/Sell Signal based on calculations on Higher frame (Trend) and Lower frame(Entry signals) * You should select the higher and lower frame for indicator calculations * You select the Trend line colors as you prefer * Enable or disable Alerts! Trend lines UP/Down are drawn when a trend is detected Wait for small arrows for entry : *Normally an UP arrow in an UP Trend is a BUY signal : ---you Close the BUY position IF a Reverse DOWN Trend signal appear
Multi Strategies Combined Signal All in One   Multi Strategies Single Combined   Select from up to 6 Strategies solo or Combine different strategies for signal generation  (Combining more than 2 strategies may LIMIT a lot the number of signals)! ALL inputs and Strategies selection From Chart !!! Also Inputs editing from Chart !!! Push your strategy bottom (one strategy) OR Combine signal from as may strategies (up to 6) : Selected and enabled strategies will be in GREEN !!! 1- BUY SELL areas 2-
SYMBOL POWER based on inputted 5 time frames and Compared to 20 Other Symbols !! Great Indicator YOU DON'T HAVE TO SHIFT ON ALL TIME FRAMES FOR EACH CURRENCY PAIR TO CONCLUDE ITS TREND AND ITS POWER YOU HAVE IT ALL IN ONE TABLE , 20 CURRENCY PAIR WITH 5 TIME FRAMES ALSO , COMPARE BETWEEN CURRENCIES STRENGTH AND ALERTS THE STRONGER /WEAKER PAIR BASED ON 5 TIMEFRAMES CALCULATIONS ALEERTS enable /disable using 5 time frames M5 M30 H1 H4 and D1     ( latest version You SELECT you own 5 timeframes fr
TWO SYMBOLS CORRELATION  line indicator    It compares the power/strength lines of two user input symbols and create a SMOOTHED line that indicates the degree of deviation of the 2 symbols Strategy#1- FOLLOW THE INDICATOR THICK LINE when CROSSING O LEVEL DOWN --- TRADE ON INDICATOR THICK LINE (TREND FRIENDLY) !! Strategy#2- TRADE INDICATOR PEAKS (Follow indicator Reversal PEAKS Levels)!! you input - the index of calculation ( 10/20/30....)                 - the indicator Drawing start point (ind
Symbols Strength meter Graph  :::: It is programmed to work on any M5 Chat windows !! Used to determine the Strongest currency pairs and the Weakest pairs also detect the peak of deviation of currencies strength  IT CAN BE USED FOR INDICES AND STOCKS TOO !! Strategy one : It can be used in to BUY Strongest pair and SELL Weakest one Strategy two: It can be used on Daily basis to Hedge BUY Strongest pair with high % (ex: +1%) and BUY Weakest one with % lower(ex: -0.7%) the same with SELL  Strateg
Filter:
No reviews
Reply to review