VR Cub is an indicator for getting high-quality entry points. The indicator was developed to facilitate mathematical calculations and simplify the search for entry points into a position. The trading strategy for which the indicator was written has been proving its effectiveness for many years. The simplicity of the trading strategy is its great advantage, which allows even novice traders to successfully trade with it. VR Cub calculates position opening points and Take Profit and Stop Loss targe
Gvs Undefeated Trend indicator is designed for trend and signal trading. This indicator generates trend signals. It uses many algorithms and indicators to generate this signal. It tries to generate a signal from the points with the highest trend potential. This indicator is a complete trading product. This indicator does not need any additional indicators. You can only trade with this indicator. The generated signals are displayed on the graphical screen. Thanks to the alert features you ca
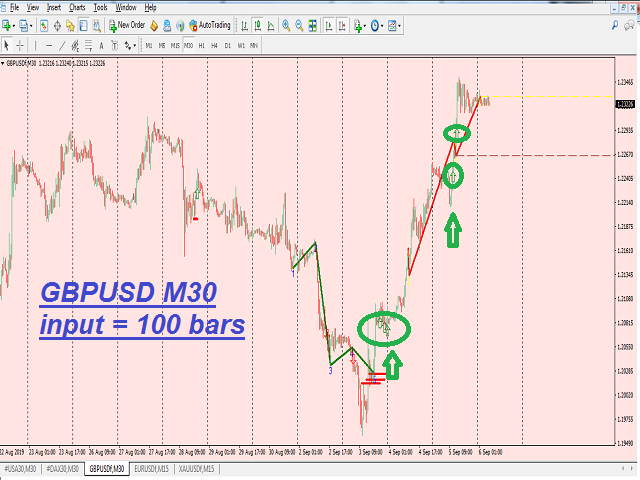
Alpha Trend sign has been a very popular trading tool in our company for a long time. It can verify our trading system and clearly indicate trading signals, and the signals will not drift.
Main functions:
Based on the market display of active areas, indicators can be used to intuitively determine whether the current market trend belongs to a trend market or a volatile market.
And enter the market according to the indicator arrows, with green arrows indicating buy and red arrows indicating se
Indicator for binary options arrow is easy to use and does not require configuration works on all currency pairs, cryptocurrencies buy signal blue up arrow sell signal red down arrow tips do not trade during news and 15-30 minutes before their release, as the market is too volatile and there is a lot of noise it is worth entering trades one or two candles from the current period (recommended for 1 candle) timeframe up to m 15 recommended money management fixed lot or fixed percentage of the depo
Trade smarter, not harder: Empower your trading with Harmonacci Patterns This is arguably the most complete harmonic price formation auto-recognition indicator you can find for the MetaTrader Platform. It detects 19 different patterns, takes fibonacci projections as seriously as you do, displays the Potential Reversal Zone (PRZ) and finds suitable stop-loss and take-profit levels. [ Installation Guide | Update Guide | Troubleshooting | FAQ | All Products ] It detects 19 different harmonic pric
The Fisher Yur4ik MT4 is an advanced trading indicator that harnesses the power of technical analysis to provide traders with precise insights into market trends. Designed specifically for MetaTrader 4, this indicator is ideal for traders looking to enhance their decision-making process and improve their trading outcomes. By utilizing the Fisher Yur4ik MT4, traders can gain a competitive edge with real-time alerts and clear visual signals, enabling them to seize profitable trading opportunities
Daily Candle Predictor is an indicator that predicts the closing price of a candle. The indicator is primarily intended for use on D1 charts. This indicator is suitable for both traditional forex trading and binary options trading. The indicator can be used as a standalone trading system, or it can act as an addition to your existing trading system. This indicator analyzes the current candle, calculating certain strength factors inside the body of the candle itself, as well as the parameters of
Super Reversal Pattern Indicator
Unlock the power of advanced pattern recognition with our Super Reversal Pattern Indicator. Designed for traders seeking precision and reliability, this indicator identifies one of the most effective reversal patterns in technical analysis, offering a significant edge in your trading strategy. Key Features: Non-Repainting Accuracy: Enjoy the confidence of non-repainting technology. Once a Super Reversal Pattern is detected, it remains static, providing consiste
Apollo SR Master is a Support/Resistance indicator with special features which make trading with Support/Resistance zones easier and more reliable. The indicator calculates Support/Resistance zones in real-time without any time lag by detecting local price tops and bottoms. Then to confirm the newly formed SR area, the indicator shows special signal which signalizes that the SR zone can be taken into consideration and used as an actual SELL or BUY signal. In this case the strength of the SR zone
"Auto FIBO Pro" Crypto_Forex indicator - is great auxiliary tool in trading! Indicator automatically calculate and place on chart Fibo levels and local trend lines (red color). Fibonacci levels indicate key areas where price can reverse. Most important levels are 23.6%, 38.2%, 50% and 61.8%.
You can use it for reversal scalping or for zone grid trading. There are plenty of opportunities to improve your current system using Auto FIBO Pro indicator as well. It has Info Spread Swap Displa
EZZ Elite Zig Zag is an indicator for the MetaTrader 4 terminal. This indicator traces the peak of the trend based on the market reversal, thus showing various opportunities in the financial market. EZZ Elite Zig Zag is a visual tool, intuitive, and easy to understand and use.
Test it Yourself by Downloading it for Free.
Author Paulo Rocha all rights reserved
This is a trend indicator without redrawing Developed instead of the binary options strategy (by the color of the Martingale candlestick) Also works well in forex trading When to open trades (binary options) A signal will appear in the place with a candle signaling the current candle It is recommended to open a deal for one candle of the current timeframe M1 and M5 When a blue dot appears, open a deal up When a red dot appears, open a trade down. How to open trades on Forex. When a signal is rec
KT Renko Patterns scans the Renko chart brick by brick to find some famous chart patterns that are frequently used by traders across the various financial markets. Compared to the time-based charts, patterns based trading is easier and more evident on Renko charts due to their uncluttered appearance.
KT Renko Patterns features multiple Renko patterns, and many of these patterns are extensively explained in the book titled Profitable Trading with Renko Charts by Prashant Shah. A 100% automated
The Th3Eng PipFinite indicator is based on a very excellent analysis of the right trend direction with perfect custom algorithms. It show the true direction and the best point to start trading. With StopLoss point and Three Take Profit points. Also it show the right pivot of the price and small points to order to replace the dynamic support and resistance channel, Which surrounds the price. And Finally it draws a very helpful Box on the left side on the chart includes (take profits and Stop loss
Volume Profile Sniper v11.1 is a comprehensive market analysis tool A professional approach to trading Volume Profile Sniper v11.1 combines more than 15 key filters in one indicator, providing clear signals based on a comprehensive assessment of the market situation.
Main features Volume imbalance analysis – the algorithm calculates the share of buyers and sellers in each candle, signaling the predominance of one of the parties (configurable threshold from 50% to 90%).
Multilevel signal filte
"Dynamic Trading Oscillator" - is an advanced custom Crypto_Forex indicator - efficient Trading tool for MT4! - New generation of Oscillators - see pictures to check how to use it. - Dynamic Trading Oscillator has adaptive Oversold/Overbought zones. - Oscillator is an auxiliary tool to find exact entry points from dynamic OverSold/OverBought areas. - Oversold values: below Blue line, Overbought values: above Red line . - This indicator is great to combine with Price Action patterns as well. -
Perfect Trade System indicator is designed for trend and signal trading. This indicator generates trend signals. It uses many algorithms and indicators to generate this signal. It tries to generate a signal from the points with the highest trend potential. This indicator is a complete trading product. This indicator does not need any additional indicators. You can only trade with this indicator. The generated signals are displayed on the graphical screen. Thanks to the alert features you ca
This unique multi-currency strategy simultaneously determines the strength of trends and market entry points, visualizing this using histograms on the chart. The indicator is optimally adapted for trading on the timeframes М5, М15, М30, Н1. For the convenience of users, the indicator renders the entry point (in the form of an arrow), recommended take profit levels (TP1, TP2 with text labels) and the recommended Stop Loss level. The take profit levels (TP1, TP2) are automatically calculated for
Fibonacci retracement and extension line drawing tool
Fibonacci retracement and extended line drawing tool for MT4 platform is suitable for traders who use golden section trading
Advantages: There is no extra line, no too long line, and it is easy to observe and find trading opportunities
Trial version: https://www.mql5.com/zh/market/product/35884
Main functions:
1. Multiple groups of Fibonacci turns can be drawn directly, and the relationship between important turning points can be seen
The WaveTrend Oscillator MT4 is a powerful trading indicator designed to enhance your market analysis by identifying momentum shifts and potential trend reversals. Ideal for traders of all levels, this tool offers valuable insights into overbought and oversold conditions across various markets, including forex, cryptocurrencies, and commodities. With its ability to generate accurate buy and sell signals, the WaveTrend Oscillator MT4 empowers traders to make informed decisions, effectively increa
Introducing Koala Supply Demand ( We encourage you to share your review or feedback—whether positive or negative—so other traders can benefit from your experience.) Welcome to Koala Supply Demand Indicator. This indicators designed to identify unbroken supply and demand zones in different time frames, this indicator can help trader to view market as zone areas, you can see how price respect some power full zones, this indicator also can show you price action signals when they formed inside zon
Pro Trend Tracking indicator is designed for trend and signal trading. This indicator generates trend signals. It uses many algorithms and indicators to generate this signal. It tries to generate a signal from the points with the highest trend potential. This indicator is a complete trading product. This indicator does not need any additional indicators. You can only trade with this indicator. The generated signals are displayed on the graphical screen. Thanks to the alert features you can
Crypto_Forex Indicator "MFI FLAT Detector" - is an efficient auxiliary tool in trading! No Repaint. I offer you to upgrade your trading methods with this great indicator for MT4. - Indicator shows price Flat areas on the chart. It has "Flat sensitivity" parameter - which is responsible for flat detection. - "MFI FLAT Detector" is very useful for divergence detection and it is great to combine with Price Action as well. - You can use it for trend following systems to detect flat zones and avoid
"Dynamic Scalping Oscillator" - is an advanced custom Crypto_Forex indicator - efficient Trading tool for MT4! - New generation of Oscillators - see pictures to check how to use it. - Dynamic Scalping Oscillator has adaptive Oversold/Overbought zones. - Oscillator is an auxiliary tool to find exact entry points from dynamic OverSold/OverBought areas. - Oversold values: below Green line, Overbought values: over Orange line . - This indicator is great to combine with Price Action patterns as wel
This indicator is based on the Weis wave principle of wave volume. Below are few features of the indicator It draws the wave on the chart while the accumulated volume per wave in a different window at the bottom of the chart You can configure the turning point move It displays the accumulated volume (in thousands, eg for 15000 volume it will show 15) at the end of each wave You can also configure to show number of candles in the wave along with the wave volume The indicator calculates the distin
This indicator is another variant of the famous powerful indicator Fibonacci-SS https://www.mql5.com/en/market/product/10136 but has different behaviour in placing Pending Order and TP Line. Automatically places Fibonacci retracement lines from the last highest and lowest visible bars on the chart with: An auto Pending Order (Buy/Sell). Taking Profit 1, Taking Profit 2 is pivot point and Taking Profit 3 for extended reward opportunity. The best risk and reward ratio.
Simple and powerful indicat
This Supply & Demand indicator uses a unique price action detection to calculate and measures the supply & demand area. The indicator will ensure the area are fresh and have a significant low risk zone. Our Supply Demand indicator delivers functionality previously unavailable on any trading platform.
Trading idea You may set pending orders along the supply & demand area. You may enter a trade directly upon price hit the specific area (after a rejection confirmed).
Input parameters Signal - Set
We present you the indicator "Candle closing counter", which will become your indispensable assistant in the world of trading.
That’s why knowing when the candle will close can help:
If you like to trade using candle patterns, you will know when the candle will be closed. This indicator will allow you to check if a known pattern has formed and if there is a possibility of trading. The indicator will help you to prepare for market opening and market closure. You can set a timer to create a pre
Forex Gump is a fully finished semi-automatic trading system. In the form of arrows, signals are displayed on the screen for opening and closing deals. All you need is to follow the instructions of the indicator. When the indicator shows a blue arrow, you need to open a buy order. When the indicator shows a red arrow, you need to open a sell order. Close orders when the indicator draws a yellow cross. In order to get the most effective result, we recommend using the timeframes H1, H4, D1. There
Super Signal – Skyblade Edition Professional No-Repaint / No-Lag Trend Signal System with Exceptional Win Rate | For MT4 / MT5 It works best on lower timeframes, such as 1-minute, 5-minute, and 15-minute charts.
Core Features: Super Signal – Skyblade Edition is a smart signal system designed specifically for trend trading. It applies a multi-layered confirmation mechanism to detect only strong, directional moves supported by real momentum. This system does not attempt to predict tops or bottoms
Gann Made Easy is a professional and easy to use Forex trading system which is based on the best principles of trading using the theory of W.D. Gann. The indicator provides accurate BUY and SELL signals including Stop Loss and Take Profit levels. You can trade even on the go using PUSH notifications. PLEASE CONTACT ME AFTER PURCHASE TO GET TRADING INSTRUCTIONS AND GREAT EXTRA INDICATORS FOR FREE!
Probably you already heard about the Gann trading methods before. Usually the Gann theory is a
Prop Firm Sniper MT4 is a professional market structure indicator that automatically identifies high-probability BUY and SELL opportunities using BOS and CHoCH analysis.
Recommended Timeframes: For backtesting, use the indicator on M5 or M15 for Gold (XAUUSD), and M15 or H1 for more volatile Forex pairs such as GBPUSD, USDJPY, EURGBP , and similar markets.
CONTACT ME AFTER PURCHASE TO CLAIM YOUR FREE BONUSES!
Prop Firm Sniper is a professional market structure indicator designed t
Neuro Poseidon is a new indicator by Daria Rezueva. It combines precise trading signals with adaptive TP/SL levels - creating best possible trades as a result! Message me and get Neuro Poseidon Assistant as a gift to automize your trading process!
What makes it stand out?
1. Proven profitability on all assets and timeframes
2. Only confirmed BUY and SELL signals present on the chart
3. Adaptive TP & SL levels generated by the software for each trade
4. Easy to understand - suitable for all
Scalper Inside PRO Scalper Inside PRO is an intraday trend and scalping indicator that uses exclusive built-in algorithms to evaluate market direction and key target levels. The indicator automatically calculates entry and exit points and several profit target levels, and it shows detailed performance statistics, so you can see how different instruments and strategies behaved on historical data. This helps you select instruments that fit current market conditions. You can also connect your own a
M1 SNIPER is an easy to use trading indicator system. It is an arrow indicator which is designed for M1 time frame. The indicator can be used as a standalone system for scalping on M1 time frame and it can be used as a part of your existing trading system. Though this trading system was designed specifically for trading on M1, it still can be used with other time frames too. Originally I designed this method for trading XAUUSD and BTCUSD. But I find this method helpful in trading other markets
only 10 copies left at the low price of 39 $ .
ZORYK — Advanced XAUUSD Signal System for MetaTrader 4
You know the feeling.
You spend time analyzing gold. You wait for the entry. You finally open the trade, and price immediately moves against you. You close too early, move the Stop Loss, or hesitate for a few seconds. Then the market reaches the exact destination you originally expected without you.
The direction was not always the problem.
The real problem was uncertainty.
You did not kn
TREND CATCHER INDICATOR Trend Catcher Indicator analyzes market price movements, using a combination of the author’s proprietary and customized adaptive trend-analysis indicators. It identifies the true market direction by filtering out short-term noise and focusing on underlying momentum strength, volatility expansion, and price structure behavior. It also uses a combination of smoothing and trend-filtering customized indicators such as moving averages, RSI, and volatility filters. Real ope
This product was updated for the 2026 market and optimized for the latest MT5 builds. PRICE UPDATE NOTICE:
Atomic Analyst is currently available for $99.
The price will increase to $199 after the next 30 purchases.
SPECIAL OFFER: After purchasing Atomic Analyst, send me a private message to claim the Smart Universal EA for FREE and turn your Atomic Analyst signals into automated trades. Atomic Analyst is a non-repainting, non-redrawing, and non-lagging price action trading indic
Currency Strength Wizard is a very powerful indicator that provides you with all-in-one solution for successful trading. The indicator calculates the power of this or that forex pair using the data of all currencies on multiple time frames. This data is represented in a form of easy to use currency index and currency power lines which you can use to see the power of this or that currency. All you need is attach the indicator to the chart you want to trade and the indicator will show you real str
BTMM State Engine Pro is a MetaTrader 4 indicator for traders who use the Beat The Market Maker approach: Asian session context, kill zone timing, level progression, peak formation detection, and a multi-pair scanner from a single chart. It combines cycle state logic with a built-in scanner dashboard so you do not need the same tool on many charts at once.
What it does
Draws the Asian session range; session times can follow broker server offset or be set in inputs. Tracks level progression (L
This product was updated for the 2026 market and optimized for the latest MT5 builds . PRICE UPDATE NOTICE:
Smart Trend Trading System is currently available for $99.
The price will increase to $199 after the next 30 purchases.
SPECIAL OFFER: After purchasing Smart Trend Trading System, send me a private message to claim the Smart Universal EA for FREE and turn your Smart Trend signals into automated trades. Smart Trend Trading System is a complete non-repainting, non-re
Gold Signal Swing Pro XAUUSD with Auto TP SL (MT4) — 7-Layer Filter + RR Guarantee System for XAUUSD Swing Trading No repaint. No redraw. No lag. All signals lock after confirmation. Bonus for buyers: Get AI Zone Radar ($59 value) + PDF manual free with purchase. Send me a message on MQL5 after buying. AI Zone Radar: https://www.mql5.com/en/market/product/175834 MT5 version also available: https://www.mql5.com/ja/market/product/177643?source=Site +Profile+Seller Used and trusted by gold traders
Next Generation Of Automated Supply And Demand Zones. New and Innovative Algorithm that Works At Any Chart. All Zones Are Being Created Dynamically According To Price Action Of The Market.
AMAZING OFFER --> Activations from 5 to 20 for "MTF Supply Demand Zones" and "Automated Trendlines"
If you get the MTF Supply Demand Zones you can join the " Trade Like Me " Video Series. It contains 14 Live Sessions where i am placing trades on Forex, Stocks, Indices and Metals. You will be able to see ho
This indicator is very usefull to TRADE Trading Ranges and helps identify the following TREND. Every Trader knows that any market stay 80% of the time in trading ranges and only 20% of the time in TREND; this indicator has been built to help traders trade trading ranges. Now instead of waiting for the next TREND, You can SWING TRADE on trading ranges with this simple yet very effective indicator.
TRADING with CONGESTIONI INDICATOR:
The CONGESTIONI Indicator identify a new trading range and ale
CURRENTLY 20% OFF ! Best Solution for any Newbie or Expert Trader! This Indicator is specialized to show currency strength for any symbols like Exotic Pairs Commodities, Indexes or Futures. Is first of its kind, any symbol can be added to the 9th line to show true currency strength of Gold, Silver, Oil, DAX, US30, MXN, TRY, CNH etc. This is a unique, high quality and affordable trading tool because we have incorporated a number of proprietary features and a new formula. Imagine how your trading
Trading Special – 30% OFF
This dashboard is a very powerful piece of software working on multiple symbols and up to 9 timeframes. It is based on our main indicator (Best reviews: Advanced Supply Demand ).
The dashboard gives a great overview. It shows: Filtered Supply and Demand values including zone strength rating, Pips distances to/and within zones, It highlights nested zones, It gives 4 kind of alerts for the chosen symbols in all (9) time-frames. It is highly configurable for your pers
Limited Special Price! Only $79! Price will increase after 10 sales, final price $199. After purchase contact me to get a FREE bonus EA that can trade the breakout signals fully automated and optimized set files.
Catch clean session breakouts with confidence! ORB Seeker is a professional Opening Range Breakout (ORB) indicator built for traders who want accuracy, simplicity, flexibility, and clear chart structure. It automatically plots the pre-market or custom session range on any instrument,
DayTrader PRO DayTrader PRO is an advanced trading indicator that combines John Ehlers' Laguerre Filter with a powerful Auto-Optimization Engine. Instead of using fixed parameters, the indicator automatically searches for the best settings based on recent market conditions, helping you adapt to changing volatility without constant manual adjustments. The indicator generates clear BUY and SELL signals together with adaptive Stop Loss and Take Profit levels calculated from curre
Gold Pro Scalper
Precise entry points for currencies, crypto, metals, stocks, indices! Indicator 100% does not repaint!!!
If a signal appeared, it does not disappear! Unlike indicators with redrawing, which lead to loss of deposit, because they can show a signal, and then remove it.
Trading with this indicator is very easy.
Wait for a signal from the indicator and enter the deal, according to the arrow
(Blue arrow - Buy, Red - Sell).
I recommend using it with the Trend Filter (download
Official BlueDigitsFx Ecosystem Access Get infrastructure updates, workflow resources, product releases, and ecosystem access through the official BlueDigitsFx ecosystem. Telegram Ecosystem
Website
MT5 Version BlueDigitsFx Easy 123 System — Powerful Reversal and Breakout Detection for MT4 All-In-One Non-Repaint System for Spotting Market Reversals and Breakouts – Built for traders who value structure, clarity, and confirmation-based trading workflows. The BlueDigitsFx Easy 123 System is a vis
Day Trader Master is a complete trading system for traders who prefer intraday trading. The system consists of two indicators. The main indicator is the one which is represented by arrows of two colors for BUY and SELL signals. This is the indicator which you actually pay for. I provide the second indicator to my clients absolutely for free. This second indicator is actually a good trend filter indicator which works with any time frame. THE INDICATORS DO NOT REPAINT AND DO NOT LAG! The system is
Gold Trend M1 - Optimized Scalping Tool for Gold (XAUUSD) Gold Trend M1 is a high-frequency trading indicator for the MetaTrader 4 platform, specifically optimized for the M1 timeframe on the Gold market. It combines a powerful SuperTrend trend filter with buy/sell signals derived from Heiken Ashi calculation logic, helping traders identify precise and disciplined entry points for optimal trading performance.
Key Features Optimized for M1 Scalping: Specifically developed for high-speed scalping
Special offer : ALL TOOLS , just $35 each! New tools will be $30 for the first week or the first 3 purchases ! Trading Tools Channel on MQL5 : Join my MQL5 channel to update the latest news from me The Volumetric Order Blocks Multi Timeframe indicator is a powerful tool designed for traders who seek deeper insights into market behavior by identifying key price areas where significant market participants accumulate orders. These areas, known as Volumetric Order Blocks, can serve as
Attention: beware of SCAMS, TRENDMAESTRO is only ditributed throught MQL5.com market place. note: this indicator is for METATRADER4, if you want the version for METATRADER5 this is the link: https://www.mql5.com/it/market/product/108106 TRENDMAESTRO ver 2.5 TRENDMAESTRO recognizes a new TREND from the start, he never makes mistakes. The certainty of identifying a new TREND is priceless. DESCRIPTION TRENDMAESTRO identifies a new TREND in the bud, this indicator examines the volatility, volumes a
CRT Candle Range Theory HTF MT4. Ultimate CRT Indicator: Advanced ICT Concepts and Malaysian SnR Trading System Master the Market Maker's Footprints with the Most Advanced Candle Range Theory Indicator Unlock the true power of Smart Money Concepts (SMC) and trade precisely like the institutions with the Ultimate CRT Indicator . Built exclusively for serious traders, this indicator automates the highly effective Candle Range Theory (CRT) , a core pillar of ICT Concepts (Inner Circle Trader
Identify ranges | Get earliest signals of Trends | Get clear exits before reversal | Spot the Fibo levels the price will test Non-repainting, non-delayed indicator - ideal for manual and automated trading - for all assets and all time units After purchase, please contact me for recommended and personalised settings Version MT4 - MT5 | Check our 3 steps MetaMethod to maximise your profits: 1. TrendDECODER 2. PowerZONES 3. BladeSCALPER
What is it about?
TrendDECODER is a c
M1 Arrow is an indicator which is based on natural trading principles of the market which include volatility and volume analysis. The indicator can be used with any time frame and forex pair. One easy to use parameter in the indicator will allow you to adapt the signals to any forex pair and time frame you want to trade. Besides the main algorithm which is based on buy and sell signals, the indicator also has multiple built-in extra strategies which you can choose in the inputs. These strategies
This product was updated for the 2026 market and optimized for the latest MT5 builds . PRICE UPDATE NOTICE:
Smart Price Action Concepts is currently available for $200.
The price will increase to $299 after the next 30 purchases.
SPECIAL OFFER: After purchasing , send me a private message to claim FREE Bonus + Gift. First of all Its worth emphasizing here that this Trading Tool is Non Repainting , Non Redrawing and Non Lagging Indicator , Which makes it ideal for profes
Effortless trading: non-repainting indicator for accurate price reversals This indicator detects price reversals in a zig-zag fashion, using only price action analysis and a donchian channel. It has been specifically designed for short-term trading, without repainting or backpainting at all. It is a fantastic tool for shrewd traders aiming to increase the timing of their operations. [ Installation Guide | Update Guide | Troubleshooting | FAQ | All Products ] Amazingly easy to trade It provides
Trend Follower and Reversal Trend handler * EA opens X Lot position (calculated according to Lot risk value) with trend with indicated TP if Trend reversal occurs * EA opens 5 X Lot (if input " Reversal Lot scaling" = 5 ) position with reversal trend with indicated TP and same SL for old trend position * Increasing LOT risk value + Increasing Reversal Lot scaling value = High Risk and High Profit and High DD * Decreasing LOT risk value + Decreasing Reversal Lot scaling = Low Risk and Low Pr
This Indicator provides Buy/Sell Signal based on calculations on Higher frame (Trend) and Lower frame(Entry signals) * You should select the higher and lower frame for indicator calculations * You select the Trend line colors as you prefer * Enable or disable Alerts! Trend lines UP/Down are drawn when a trend is detected Wait for small arrows for entry : *Normally an UP arrow in an UP Trend is a BUY signal : ---you Close the BUY position IF a Reverse DOWN Trend signal appears Or when Up trend li
HEDGING MASTER line indicator It compares the power/strength lines of two user input symbols and create a SMOOTHED line that indicates the degree of deviation of the 2 symbols Strategy#1- FOLLOW THE INDICATOR THICK LINE when CROSSING O LEVEL DOWN --- TRADE ON INDICATOR THICK LINE (TREND FRIENDLY) !! Strategy#2- TRADE INDICATOR PEAKS (Follow indicator Reversal PEAKS Levels)!! you input - the index of calculation ( 10/20/30....) - the indicator Drawing start point (indicator hi
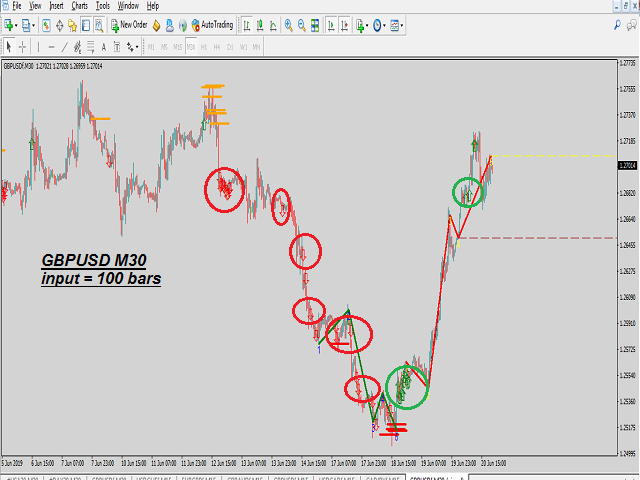
Automatic redrawing of Trend Supports and resistances levels and Possible Wedge pattern formation to indicate price breaking of Rising Wedge (signal SELL) or price breaking of falling Wedge (signal BUY) Very simple and smart indicator ALERTS AND MOBILE NOTIFICATIONS availavle !!! you can edit the calculation bars of the bars count for formation of the trend lines and the initial shift from current price Smaller values for bars /shift inputs when using Higher Time frames (D1-H4) and the reverse
:::: It is programmed to work on any M5 Chat windows !! Used to determine the Strongest currency pairs and the Weakest pairs also detect the peak of deviation of currencies strength IT CAN BE USED FOR INDICES AND STOCKS TOO !! Strategy one : It can be used in to BUY Strongest pair and SELL Weakest one Strategy two: It can be used on Daily basis to Hedge BUY Strongest pair with high % (ex: +1%) and BUY Weakest one with % lower(ex: -0.7%) the same with SELL Strategy three: on 3days or above ca
Auto redrawn Pivot support resistance horizontal lines with signal of Buy/Sell possibilities with SL level and with trend support resistance lines too used for all symbols and time frames you can adjust inputs parameters (only 2) and test it on various symbols and time frames input number of bars for calculation and moving average for signal accuracy example : use it on M30 time frame with input 200 for bars count and 100 for MA
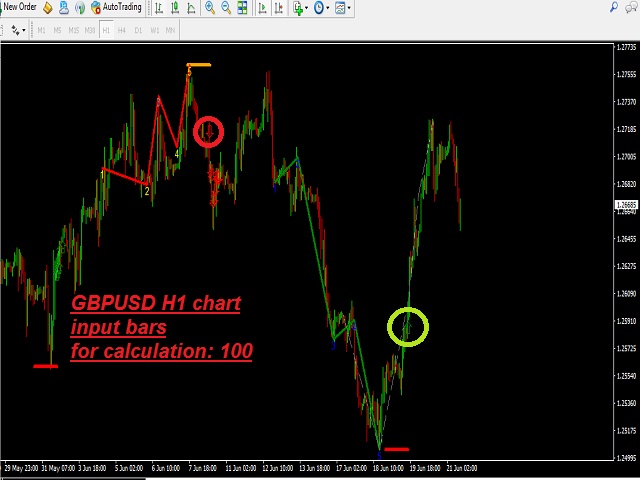
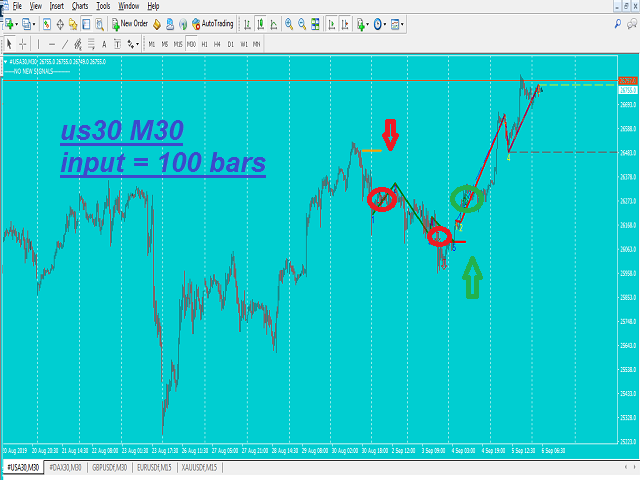
Price Predictor is an indicator that shows precise price reversals taking into account a higher time frame and a lower time frame candle patterns calculations it is great for scalping and swing trading . Buy and sell arrows are shown on the chart as for entry signals. BIG Arrows indicates the trend - SMALL Arrows signal a trade (BUY/SELL) - A Green BIG UP Arrow with a support green line indicates a Bull Market : wait for buy signal - A Green SMALL Up Arrow after a BIG green arrow is
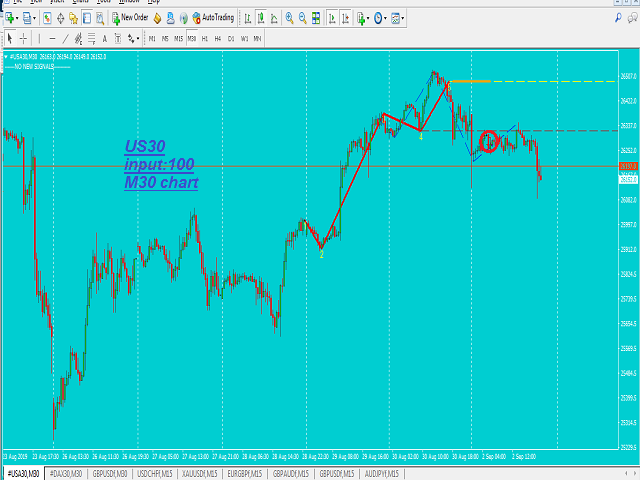
A simple Approach to Elliot waves patterns Signal generated on trend continuation when breaking the "5" level or on corrective direction after 1-5 waves detected 1-5 labeled points arrows used for signal UP/DOWN direction Chaotic patterns in Blue are drawn all times until a 1-5 Elliot wave pattern detected 1-5 Red pattern in Bull Market : UP arrow in BULL trend continuation OR DOWN arrow as a reversal DOWN direction as pattern correction 1-5 Green pattern in Bear Market :DOWN arrow in BEAR tr
YOU DON'T HAVE TO SHIFT ON ALL TIME FRAMES FOR EACH CURRENCY PAIR TO CONCLUDE ITS TREND AND ITS POWER YOU HAVE IT ALL IN ONE TABLE , 20 CURRENCY PAIR WITH 5 TIME FRAMES ALSO , COMPARE BETWEEN CURRENCIES STRENGTH AND ALERTS THE STRONGER /WEAKER PAIR BASED ON 5 TIMEFRAMES CALCULATIONS The Power meter currencies table is a very helpful tool to indicate the TREND strength of up to 20 currencies pairs using 5 time frames M5 M30 H1 H4 and D1 ( latest version You SELECT you own 5 timeframes from M1 t
Auto redrawn Pivot support resistance horizontal lines with signal of Buy/Sell possibilities with SL level and with trend support resistance lines too used for all symbols and time frames you can adjust inputs parameters (only 2) and test it on various symbols and time frames input number of bars for calculation and moving average for signal accuracy example : use it on M30 time frame with input 200 for bars count and 100 for MA
Smart and simple Indicator based on wolves waves reversal pattern also near to falling and rising wedge and butterfly patterns with Stoploss and entry signal preferred time frame M30 : with parameters bars count used for calculation = 200 and moving average for accuracy = 100; you can try it for other higher or lower parameters and try your own set of inputs higher timeframe = lower input !!! important note ::: Indicator don't back draw when first installed on Chart
once installed wait for new
Simple moving trend lines with support and resistance moving levels used on any time frame on any symbols input: # of bars for trend lines (10-20- 50-100-200----) as per your time frame and your strategy and moving period ( 10-20 -50-100-200----) as per your time frame and your strategy Direction Arrows : UP and DOWN are drawn when breaking the trend lines ALerts available at Arrows appearance...
Simple indicator for BUY / Sell Zones moving Buy and Sell zones : Closest zone is wide and clear : Red for Sell zone , Green for Buy zone >>> old far zones are in bold lines :::BUY Zones (GREEN) appear only in UP Trend and disappear in DOWN Trend :::SELL Zones (RED) appear only in DOWN Trend and disappear in UP Trend input parameters ::: index bars : bars range for zone calculation levels : number of zones Up move/Down move arrows mail and message Alerts !! used on any symbol used on any timefr
Crazy Dancing moving RES/SUP Levels Automatic redrawing of moving Supports and resistances levels to indicate price breaking supports (signal SELL) or breaking resistance levels (signal BUY) Very simple appearing indicator but very clever and smart too !!!! Main Inputs: # of bars for the support and resistances levels + the initial shift from start + moving average for filter signaling Smaller values for bars /shift inputs when using Higher Time frames (D1-H4) and the reverse higher values for
Select from up to 6 Strategies solo or Combine different strategies for signal generation (Combining more than 2 strategies may LIMIT a lot the number of signals)! ALL From Chart !!! Also Inputs editing from Chart !!! Push your strategy bottom (one strategy) OR Combine signal from as may strategies (up to 6) : Selected and enabled strategies will be in GREEN !!! 1- BUY SELL areas 2- Support resistance break signal 3- Elliot wave continuation /reversal signal 4- Advanced Moving averages 5- Tren
SMOOTH DEVIATION line indicator for 2 symbols It compares the power/strength lines of two user input symbols and create a SMOOTHED line that indicates the degree of deviation of the 2 symbols Strategy#1- FOLLOW THE INDICATOR THICK LINE when CROSSING O LEVEL DOWN --- TRADE ON INDICATOR THICK LINE (TREND FRIENDLY) !! Strategy#2- TRADE INDICATOR PEAKS (Follow indicator Reversal PEAKS Levels)!! you input - the index of calculation ( 10/20/30....) - the indicator Drawing start point
Simple 3 Moving supports and resistance levels (Your Review /comment and feedback is important !! Thanks) Signal UP and Down possibilities created on crossing the multi supports/resistance levels supports all time frames Adjusted inputs for area covered for generating the levels and the shifts needed to cover 3 areas supports /resistances levels for example you may use main parameters in M30 time frames: extern int ShiftFromStart=20; extern int barsCount=20; extern int sequenceShifts=50; in
SMOOTH STRENGTH METER INDICATOR (SMOOTH LINE) it draws Currencies TREND Volatility Power / Strength lines : - Detects the 2 highly TRENDED Volatile pairs ( will be the Bold Lines ) - A very Helpful Indicator - It draws smooth lines for up to 20 currencies pairs representing Volatility strength and power - First it indicates the most powerful trended direction pairs : Strongest / Weaker - MAIN FUNCTION :it gives indication of the UP trend most Volatile Line and the DOWN
Smart EA based on Trend and Support Resistance Levels with SL results given on EURUSD H1 for last 10 months IF AUTOLOT enabled: **if LotRisk =1- 3 ---- Profit up to 50% DD up to 17% **if LotRisk > 5 /10 /20 --- HIGH RISK --- HIGH Profit up to 1600 % or More but High DD up to 40% tested also on other symbols GBPUSD with positive results *** used parameters on H1 timeframe bars 25 shift 4 ma index 0.85 for lower time frames Inputs will me doubled or tripled ... for higher time frames inputs
Trend Bar Balance Indicator Simple indicator based on trend detection and support resistance breakage It detects the major trend and the minor support and resistance levels *** a signal for UP /BUY is detected and alerted in a BULL trend and a resistance level break *** a signal for DOWN /SELL is detected and alerted in a Bear trend and a support level break THE POWER OF THIS INDICATOR I USE IT WHEN YOU COMBINE ITS DAILY SIGNALS FROM DIFFERENT CHART SYMBOLS AT SAME TIME AND CLOSE ALL ORDERS BY
SYMBOL POWER based on inputted 5 time frames and Compared to 20 Other Symbols !! Great Indicator YOU DON'T HAVE TO SHIFT ON ALL TIME FRAMES FOR EACH CURRENCY PAIR TO CONCLUDE ITS TREND AND ITS POWER YOU HAVE IT ALL IN ONE TABLE , 20 CURRENCY PAIR WITH 5 TIME FRAMES ALSO , COMPARE BETWEEN CURRENCIES STRENGTH AND ALERTS THE STRONGER /WEAKER PAIR BASED ON 5 TIMEFRAMES CALCULATIONS ALEERTS enable /disable using 5 time frames M5 M30 H1 H4 and D1 ( latest version You SELECT you own 5 timeframes from
Automatic redrawing of Trend Supports and resistances levels and Possible Wedge pattern formation to indicate price breaking of Rising Wedge (signal SELL) or price breaking of falling Wedge (signal BUY) Very simple and smart indicator ALERTS AND MOBILE NOTIFICATIONS availavle !!! you can edit the calculation bars of the bars count for formation of the trend lines and the initial shift from current price Smaller values for bars /shift inputs when using Higher Time frames (D1-H4) and the reverse
Multi Strategies Single Combined Select from up to 6 Strategies solo or Combine different strategies for signal generation (Combining more than 2 strategies may LIMIT a lot the number of signals)! ALL inputs and Strategies selection From Chart !!! Also Inputs editing from Chart !!! Push your strategy bottom (one strategy) OR Combine signal from as may strategies (up to 6) : Selected and enabled strategies will be in GREEN !!! 1- BUY SELL areas 2- Support resistance break signal 3- Elliot wave
Buy Sell Zones Simple indicator for BUY / Sell Zones moving Buy and Sell zones : Closest zone is wide and clear : Red for Sell zone , Green for Buy zone >>> old far zones are in bold lines :::BUY Zones (GREEN) appear only in UP Trend and disappear in DOWN Trend :::SELL Zones (RED) appear only in DOWN Trend and disappear in UP Trend input parameters ::: index bars : bars range for zone calculation levels : number of zones Up move/Down move arrows mail and message Alerts !! used on any symbol u
Trend Lines Signal This Indicator provides Buy/Sell Signal based on calculations on Higher frame (Trend) and Lower frame(Entry signals) * You should select the higher and lower frame for indicator calculations * You select the Trend line colors as you prefer * Enable or disable Alerts! Trend lines UP/Down are drawn when a trend is detected Wait for small arrows for entry : *Normally an UP arrow in an UP Trend is a BUY signal : ---you Close the BUY position IF a Reverse DOWN Trend signal appear
Multi Strategies Combined Signal All in One Multi Strategies Single Combined Select from up to 6 Strategies solo or Combine different strategies for signal generation (Combining more than 2 strategies may LIMIT a lot the number of signals)! ALL inputs and Strategies selection From Chart !!! Also Inputs editing from Chart !!! Push your strategy bottom (one strategy) OR Combine signal from as may strategies (up to 6) : Selected and enabled strategies will be in GREEN !!! 1- BUY SELL areas 2-
SYMBOL POWER based on inputted 5 time frames and Compared to 20 Other Symbols !! Great Indicator YOU DON'T HAVE TO SHIFT ON ALL TIME FRAMES FOR EACH CURRENCY PAIR TO CONCLUDE ITS TREND AND ITS POWER YOU HAVE IT ALL IN ONE TABLE , 20 CURRENCY PAIR WITH 5 TIME FRAMES ALSO , COMPARE BETWEEN CURRENCIES STRENGTH AND ALERTS THE STRONGER /WEAKER PAIR BASED ON 5 TIMEFRAMES CALCULATIONS ALEERTS enable /disable using 5 time frames M5 M30 H1 H4 and D1 ( latest version You SELECT you own 5 timeframes fr
TWO SYMBOLS CORRELATION line indicator It compares the power/strength lines of two user input symbols and create a SMOOTHED line that indicates the degree of deviation of the 2 symbols Strategy#1- FOLLOW THE INDICATOR THICK LINE when CROSSING O LEVEL DOWN --- TRADE ON INDICATOR THICK LINE (TREND FRIENDLY) !! Strategy#2- TRADE INDICATOR PEAKS (Follow indicator Reversal PEAKS Levels)!! you input - the index of calculation ( 10/20/30....) - the indicator Drawing start point (ind
Symbols Strength meter Graph :::: It is programmed to work on any M5 Chat windows !! Used to determine the Strongest currency pairs and the Weakest pairs also detect the peak of deviation of currencies strength IT CAN BE USED FOR INDICES AND STOCKS TOO !! Strategy one : It can be used in to BUY Strongest pair and SELL Weakest one Strategy two: It can be used on Daily basis to Hedge BUY Strongest pair with high % (ex: +1%) and BUY Weakest one with % lower(ex: -0.7%) the same with SELL Strateg
the Advanced MOVING AVERAGE indicator This is a formula of moving average based on support and resistance levels Two Colors indicator : UP trend --> Green Down trend -->Red Arrows UP/Down are shown for trend reversal indication ALERTS and mobile Push NOTIFICATIONS Simple Strategy : BUY on price over new green line Sell on price under new red line
Works on any TIMEFRAME MAin Input for calculation : index = 20.. 50..100..500 ... 1000 (Lower time frame -> Hig


Nice Indicator for I need full time not Rental,It works for me