Market Structure Order Block Dashboard MT4

Market Structure Order Block Dashboard MT4 is a MetaTrader 4 indicator designed for traders who want to read market structure and the main price reaction zones directly on the chart. It combines BOS, ChoCH, Order Blocks, Fair Value Gaps (FVG), Liquidity, Kill Zones, Volume Profile, and a compact dashboard for quick analysis.

This indicator is intended for traders who use market structure, ICT and Smart Money concepts as a decision framework. It can help spot trend continuations, possible reversals, price imbalances, liquidity targets, and zones of interest in a more structured way.

Resources included for buyers

Complete PDF user guide and parameter setup tips available on simple request via MQL5 private messaging after purchase. Direct technical support via MQL5 private messaging.

This MT4 version covers all features of the MT5 version 1.20: Pending BOS / Pending ChoCH detection, draggable dashboard (click and hold the header to reposition the panel anywhere on the chart), Multi-Timeframe panel, Order Block performance statistics, and automatic risk / reward zones. Pending Breaks immediately display a pending break as soon as a candle closes beyond a previous swing, without waiting for the classic swing confirmation.

Important

This product is an indicator only. It does not open, close, or automatically manage positions. It is not an Expert Advisor.

Main features

  • Market structure: automatic detection of HH, HL, LH and LL with visual labels.
  • BOS and ChoCH: confirmed structure breaks displayed directly on the chart to read continuation or reversal.
  • Pending BOS / Pending ChoCH: early-alert logic based on a candle closing beyond the latest swing, before full confirmation.
  • Order Blocks: bullish and bearish zones with strength score, mitigation handling and optional extension.
  • Fair Value Gaps: automatic FVG detection with optional removal when the gap is sufficiently filled.
  • Liquidity: detection of Equal Highs, Equal Lows and liquidity sweeps, with distinct colors EQH (red) and EQL (green).
  • Sessions and Kill Zones: Asian, London and New York sessions with optional Kill Zones display.
  • Volume Profile: local profile with POC, VAH, VAL and coloring by buy (blue) / sell (red) dominance.
  • Dashboard: compact panel showing trend, last signal, active zones, session status and confluence score.
  • Draggable dashboard: click and hold the header to reposition the panel anywhere on the chart.
  • Alerts: Popup, sound, email and Push Notification on key events.

Advanced dashboard tools

The dashboard is designed to provide a quick summary of the current market context. In addition to market structure and Order Block logic, it also includes:

  • Multi-Timeframe panel: quick view of the trend on M15, H1, H4 and D1 with alignment count and confluence bonus.
  • OB Performance Stats: detected zones, active zones, mitigated zones, hit rate, mitigation rate and average strength.
  • Automatic risk / reward zones: optional visualization of entry, stop loss, TP1 and TP2 on recent high-probability Order Blocks.

How Pending Breaks work

A pending break appears when price closes beyond a previous swing high or swing low before a new swing is fully confirmed. This provides an earlier reading of a possible BOS or ChoCH.

  • Confirmation: the signal becomes a regular BOS or ChoCH when the new swing is validated.
  • Cancellation: the signal disappears if price moves back behind the broken swing.
  • Expiration: the signal is automatically removed after a defined number of bars without confirmation.

This logic is useful for traders who want a faster reading of structure while keeping a clear separation between confirmed breaks and early alerts.

Example workflow

  1. Start with the higher timeframe trend and recent market structure.
  2. Identify the most relevant zone: Order Block, Fair Value Gap, or liquidity zone.
  3. Watch for a confirmed or pending BOS / ChoCH around this zone.
  4. Use Volume Profile, session context, and the dashboard confluence score for additional confirmation.
  5. Build your own trading plan and risk management based on the context provided by the indicator.

Markets and timeframes

This indicator can be used on Forex pairs, gold, indices, cryptocurrencies, and other symbols available with your broker. It can be used on multiple timeframes, from intraday charts to higher timeframe structure analysis.

Keywords

Order Block MT4, ICT MT4, Smart Money Concepts MT4, BOS ChoCH MT4, Fair Value Gap MT4, FVG MT4, Liquidity sweep MT4, Market structure MT4, Volume profile MT4, Equal highs lows MT4, EQH EQL MT4, Kill zones MT4, SMC MT4, Multi timeframe MT4, Price action MT4, Smart money trading MT4, Institutional zones MT4, Order flow MT4.

Support

Support is available via the product comments section and MQL5 private messaging. Complete PDF user guide and parameter setup tips provided to buyers on simple request via MQL5 private messaging.

Risk warning

This product is provided for chart analysis and educational use. Trading involves risk. Always test any tool on a demo account before use and apply your own risk management rules.

Recommended products
Targets
Jose Ramon Miranda Ramos
5 (1)
Targets is an indicator to determine potential turning  points , targets  are calculated to determine levels in which the sentiment of the market could change from "bullish" to "bearish." This indicator can be used in any timeframe and any currency pair: IN CASE YOU DON'T SEE THE INDICATOR WHEN YOU ADD IT TO YOUR CHARTS JUST OPEN THE INDICATOR MENU AND CLOSE THE MENU AGAIN PLEASE TAKE NOTICE: For best results use this indicator as an extra tools after you have completed your regular analysis an
FREE
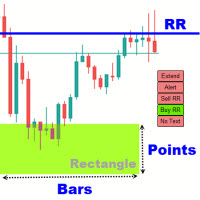
Rectangle Trading Custom   is a powerful technical analysis tool designed for price action and range-based traders. It allows users to define consolidation zones and receive alerts when the price breaks out of these zones or approaches trendlines drawn on the chart. Rectangles and Trendlines will be extended into future with one click. Rectangle point size, name and prices will be displayed around rectangle. Key Features: Draw Trading Zones (Rectangle Zones) Users can manually draw rectangles t
GO Trend MultiTimeFrame
Martin Alejandro Bamonte
The "GoTrend Multi-Timeframe" indicator is an essential tool for traders looking for a quick and efficient way to assess the overall and specific trends of a currency pair across different timeframes. This indicator allows traders to gain a clear and comprehensive view of market direction at a glance, optimizing decision-making and enhancing the effectiveness of their trading strategies. Main Features: Multi-Timeframe Analysis: This indicator provides an exhaustive analysis of six different ti
Market Ticker
John Louis Fernando Diamante
The only Market Ticker on the market! Add a professional novelty to your workspace, with built in mini-charts A scrolling Market Ticker that displays price changes from all symbols in the Market Watch list. Provides an easy snapshot of symbol prices, and keeps scrolling automatically while you trade and analyse the chart. The ticker color (+/- price changes) are based on either the current or completed candle, and the previous candle. Options include: - MTF, eg choose to show price changes of
The SPV Volatility indicator is one of the most effective filters. Volatility filter. Shows three volatility options. The so-called limit, real, and the last most effective filter for the filter is the percentage filter. Percentage display of folatility shows the ratio of limit to real volatility. And thus, if we trade in the middle of the channel, then it is necessary to set a condition that the percentage is less than a certain indicator value. If we trade on the channel breakout - following t
PDP indicator is used for: defining price probability distributions. This allows for a detailed representation of the channel and its borders and forecast the probability of a price appearing at each segment of its fluctuations; defining the channel change moment. Operation principles and features PDP analyzes a quote history on lower timeframes and calculates a price probability distribution on higher ones. Forecast algorithms allow the indicator to calculate probability distributions and mov
Smart Channel is a non-redrawing channel indicator based on moving averages. The indicator is used to identify trends in financial markets and indicates the direction of price movement. Smart Channel, in fact, is a miniature trading strategy, since, regardless of the construction methods, it uses the tactics of rebounding from the boundaries of the built channel, and the boundaries themselves are used as guidelines for the correct placement of stop loss and take profit orders. The key differe
Become a constantly profitable 5-star forex trader!  We offer a few indicators to support you understand and analyse the market! With our strategies you will improve your trading system and bacome an expert... We have indicators for trend direction, market direction and others.. for multi-time frames and that covers all majors or your favorite trading symbols! Some of them offer a customizable calculation parameters... or Graph features! See how powerful they are! The are also easy-to-use t
Indicator for binary options arrow is easy to use and does not require configuration works on all currency pairs, cryptocurrencies buy signal blue up arrow sell signal red down arrow tips do not trade during news and 15-30 minutes before their release, as the market is too volatile and there is a lot of noise it is worth entering trades one or two candles from the current period (recommended for 1 candle) timeframe up to m 15 recommended money management fixed lot or fixed percentage of the depo
SignalFxPro Breakout — Non-Repainting Indicator Overview: The SignalFxPro Breakout is a non-repainting breakout arrow indicator designed to capture explosive price moves after consolidation. It automatically marks Buy (green arrow) and Sell (red arrow) signals directly on the chart, giving traders a clear and reliable visual cue for potential entries. Key Features Non-Repainting Logic – signals confirmed only on closed bars, ensuring reliability. Dynamic Breakout Detection – identifies
The indicator is the main part of Michael Huddleston's ICT (Inner Circle Trader) trading strategy. His legendary trading strategy is based on the concept of "Smart Money". To analyze the medium -term trend , the  ICT offers an analysis based on  twenty -day levels . The indicator builds levels , while showing the turning points with arrows . An important feature of the indicator is the automatic display of levels for different periods . You do not have to change the indicator settings when chang
Beautiful
Tatiana Savkevych
The Beautiful indicator shows potential market reversal points. The intelligent algorithm of the indicator detects the trend well, filters out market noise and generates input signals and exit levels. Uses just one parameter for settings. Simple, visual and efficient trend detection. The indicator does not redraw and does not lag. You can set up message alerts as sound or email. Works on all currency pairs and on all timeframes. Ready-made trading system.
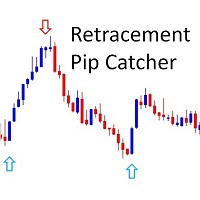
Retracement Pip Catcher
Christopher Graham Parish
!! FLASH SALE !!   Over 80% off !!     For ONE week only. Now only $47 - normally $297! >>>      Ends on 30 June 2023 - Don't miss it! Buy and Sell Arrows when price is about to retrace. It Also Sends Alerts – On MT4 To Your Phone To Your Email Does not repaint. Works ony any pair, any timeframe. 10 Activations allowed so you are free from limitations See an example of alerts from today (23 May 2020) using this and 2 more of my indicators  here . MT5 Version here . Spreads from 0.1pip RAW
Double HMA lines MTF
Pavel Zamoshnikov
5 (2)
This is a multi-timeframe version of the popular Hull Moving Average (HMA). The Double HMA MTF Light indicator combines two timeframes on a single chart. The HMA of the higher timeframe defines the trend, and the HMA of the current timeframe defines short-term price movements. The indicator is freely distributed and hasn't audio signals or messages. Its main function is the visualization of price movements. If you need advanced functionality of the HMA multi-timeframe indicator (information ab
FREE
Multi Level Trend Direction
Filip Maurice Daelman
1 (1)
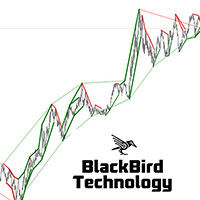
Multi Level Trend Direction is an indicator that identifies the most accurate buy/sell swing points with the highest probability, based on multi-level Zig Zag Swings. The indicator draws a color Zig Zag at the Higher Highs, Higher Lows, Lower Lows and Higher Lows in the chart, but based on two level Zig Zag Swing. If the fast price swing is in line with the trend of the slow price swing, then the buy/sell trend lines are bigger. If the price swing is against the trend, no lines are drawn to si
Godfather
Ivan Simonika
The intelligent algorithm of the Godfather indicator accurately determines the trend, filters out market noise and generates entry and exit levels. The indicator will help in finding entry points when analyzing the price chart. The program first receives a "snapshot" of the graph, then analyzes it. The results are reported to the trader in the form of signals. The main purpose of this indicator is to determine the moments of entries and exits from transactions, so the indicator displays only th
XFlow4
Maxim Kuznetsov
XFlow shows an expanding price channel that helps determine the trend and the moments of its reversal. It is also used when accompanying transactions to set take profit/stop loss and averages. It has practically no parameters and is very easy to use - just specify an important moment in the history for you and the indicator will calculate the price channel. DISPLAYED LINES ROTATE - a thick solid line. The center of the general price rotation. The price makes wide cyclical movements around the
The 4 headed dragon is an indicator that has two functions. 1) Set the background trend. 2) Mark the predominant trend. By combining these two indicator signals, we will be able to trade for or against the trend, adapting the signals to your reading of the market. You can download the demo and test it yourself. 1) Set the background trend.   Define four possibilities of trend that are the four heads of the dragon, marked by colors on the indicator, marking a) Powerful buying trend. b) Weak
Urgently
Tatiana Savkevych
The Urgently indicator is designed to quickly determine the situation in the market, reflect the state of the market and signal profitable levels for opening trades. Market conditions change quickly enough, requiring constant calibration of trading strategies. Recommended for use in conjunction with any of the oscillators. The Urgently forex market trend indicator shows the trend direction and entry points. It smooths out price fluctuations when generating a signal by averaging the data and the
Quantum Falcon Signal Free is a smart visual trading indicator for MetaTrader 4 designed for Forex and Gold traders. The indicator combines: • Trend analysis • RSI momentum confirmation • MACD momentum filtering • ATR volatility filtering • Higher timeframe confirmation • Smart exit signal detection Main Features: • Smart Buy and Sell signals • Exit Buy / Exit Sell alerts • Real-time dashboard on chart • Professional candle arrows • Multi-timeframe trend confirmation • ATR market volatility filt
FREE
RSI bands indicator is a mt4 indicator that shows various levels to enter trades based on market conditions. It consists of the below buffers; Yellow buffer Blue buffer White buffer When the yellow buffer is above blue buffer the market is trending up good place to open buy order. When the blue buffer is above yellow buffer the market is trending downwards good time to place sell order. Also another alternative scenario is when yellow buffer is above upper white band buffer indicates strong uptr
Smart Phase Box (SPB) — Indicator Description Smart Phase Box automatically locates consolidation zones (bases, flats) on the chart and analyzes the candle microstructure inside each zone — wicks, tick volume, body-to-range ratio, and where price closes relative to the zone — to estimate whether the zone looks more like accumulation (buyers absorbing supply) or distribution (sellers absorbing demand), based on classic Wyckoff / Smart Money concepts. MT5-version:  https://www.mql5.com/en/market/p
TPP : Turning Point Pattern   The indicator shows the market Turning Point Pattern as arrows. The reversal signals are based on observation of price action and market behavior. It is based on the principles of searching for extremums, volatility, and candlestick pattern. The indicator provides signals on the following principles: Search for the end of the ascending/descending trend Search for the reversal pattern based on candlestick pattern Confirmation of the reversal by the volatility. The in
FREE
Trend Sim
Ivan Simonika
This is a professional Trend Sim indicator. The intelligent algorithm of the Trend Sim indicator accurately detects the trend, filters out market noise and generates input signals and exit levels. Functions with advanced statistical calculation rules improve the overall performance of this indicator. The indicator displays signals in a simple and accessible form in the form of arrows (when to buy and when to sell). Knowing the entry point of each of the currencies is very important for every f
NNFX Strength System
Benjamin Joshua Nash
3 (1)
A complete NNFX algorithm in one indicator. NEW: Inbuilt backtester shows historical trade stats on the chart to show which pairs are most profitable. Don't be fooled. It's not enough to simply match a strong and weak currency to trade successfully with a strength meter, you need to know the intimate details of the relationship between two currencies. This is exactly what we've done with NNFX Strength, giving you all the information you need to make solid trading decisions. Years in the making
Automated Timeframe cycling with Symbols centered.  Force every timeframe onto one clock window, so the story you see on Daily is the same story you are slicing on H4, H1, and M1.  Traders usually flip timeframes and lose the span. A Daily chart shows a few weeks, then M15 shows a few hours, and the eye treats them as different markets. This indicator locks the window to N bars of the highest enabled timeframe — default 10 Daily — and maps every lower timeframe to that same stretch. You stay ins
FREE
Multiphase
Ivan Simonika
Multiphase is a non-redrawing channel indicator based on moving averages. The key difference between the Multiphase indicator and other channel indicators (for example, from the same Bollinger Band) is that Multiphase takes into account not simple moving averages, but double-smoothed ones, which, on the one hand, makes it possible to more clearly determine the market movement, but, with on the other hand, it makes the indicator less sensitive.
移動平均線クロス、ボリンジャーと移動平均線のクロス、移動平均線の角度でサイン表示 MT5インジケータ こちらに サイト とがあります。 このインジケータは3つのパターンでサインを表示(切り替え可能)します。 ①   移動平均線のクロス ②   ボリンジャーバンドと短期移動平均線とのクロス ③   ボリンジャーバンドと短期移動平均線とのクロスと、中期移動平均線と長期移動平均線の角度 移動平均線のクロス 指定した短期移動平均線と長期移動平均線のゴールデンクロスでは買いサイン、デットクロスでは売りサインを表示します。 ディフォルトでは短期は5,長期は20となっています。 もちろん変更可能になります。 移動平均線の種類をEMA(指数平滑移動平均線)やSMMA(平滑化移動平均)などに変更可能で適する価格も変更可能になります。 ボリンジャーバンドと短期移動平均線のクロス ボリンジャーバンド(以降BB)と短期移動平均線のクロスでサインを表示します。 ディフォルトではBB+1σと5MAのゴールデンクロスで買いサイン、BB-1σと5MAのデットクロスで売りサインでサインを表示します。 BBの期間や、B
RenkoVP
Kourosh Hossein Davallou
Overview RenkoVP is a professional tool for price structure analysis that runs fully online on the main chart. Unlike many other Renko indicators, it requires no offline charts. The indicator combines Renko bricks, volume profile, dynamic Fibonacci levels, and automatic pattern recognition to help traders identify trends, key zones, and precise entry/exit points. Renko Bricks Configuration The indicator offers both manual and automatic brick configuration: No offline chart required - runs direc
Buyers of this product also purchase
Trend SniperX MT4
Sarvarbek Abduvoxobov
5 (5)
Trend Sniper X is a multi-timeframe trend-following indicator for MetaTrader 5 that helps traders identify trend direction and potential reversal points with clarity and precision. For MT5: https://www.mql5.com/en/market/product/181101 Price Information: The current price is promotional and is subject to change as upcoming updates and new features are released. Code2Profit Channel Master the Market with Multi-Timeframe Analysis! How to Maximize Your Win Rate with Trend Sniper X: Key Rules & Sess
AW Prime Oscillator
AW Trading Software Limited
5 (1)
A combination of two oscillators. The first one displays the entry points, the second shows the current trend . The indicator can display oscillator signals by arrows in two modes, all fast oscillator signals or signals only in the direction of the current trend. It has a multi-timeframe panel and three types of signal notifications. Benefits: Suitable for day and scalping trading Trend filtering Simple and sensitive setup Multi-timeframe panel Suitable for integration into an advisor. Works on
Super Signal – Skyblade Edition Professional No-Repaint / No-Lag Trend Signal System with Exceptional Win Rate | For MT4 / MT5 It works best on lower timeframes, such as 1-minute, 5-minute, and 15-minute charts. Core Features: Super Signal – Skyblade Edition is a smart signal system designed specifically for trend trading. It applies a multi-layered confirmation mechanism to detect only strong, directional moves supported by real momentum. This system does not attempt to predict tops or bottoms
Tokyo mt4 Indicator
Vasiliy Strukov
5 (9)
Tokyo Indicator provides a clear visual overview of trend direction, potential trading signals, and market conditions. Its colour-coded, stepped trend line distinguishes bullish phases in blue from bearish phases in magenta. Matching directional arrows highlight potential buying and selling opportunities when the displayed trend changes. An integrated dashboard brings together the current signal, market bias, momentum, volatility, and signal quality in one convenient view. This allows traders t
Atomic Analyst
Issam Kassas
5 (14)
Atomic Analyst — MetaTrader 4 For product questions, setup guidance, or technical support, message me directly here on MQL5. The indicator turns complex market calculations into simple visual signals, color-coded candles, trend readings, stop-loss levels, and multiple take-profit zones that traders can understand quickly and use in real market conditions. Main Trading Uses: Scalping and intraday trading: Designed for fast decision-making, clear arrows, alerts, candle colors, and structured entry
Trading Special – 30% OFF Best Solution for any Newbie or Expert Trader! This dashboard software is working on 28 currency pairs plus one. It is based on 2 of our main indicators (Advanced Currency Strength 28 and Advanced Currency Impulse). It gives a great overview of the entire Forex market plus Gold or 1 indices. It shows Advanced Currency Strength values, currency speed of movement and signals for 28 Forex pairs in all (9) timeframes. Imagine how your trading will improve when you can watch
SR Liquidity
Oleg Rodin
5 (2)
SR Liquidity is a trading indicator designed to reveal the hidden zones where market liquidity concentrates and price reacts most strongly. These special liquidity areas act as powerful support and resistance levels, giving you a clear map of where the market is most likely to reverse. Instead of drawing ordinary Support/Resistance lines, SR Liquidity analyzes real price behavior to detect the zones where buying and selling pressure accumulate. These are actually the pools of liquidity that driv
M1 Sniper
Oleg Rodin
4.97 (30)
M1 SNIPER  is an easy to use trading indicator system. It is an arrow indicator which is designed for M1 time frame. The indicator can be used as a standalone system for scalping on M1 time frame and it can be used as a part of your existing trading system. Though this trading system was designed specifically for short-term trading, it still can be helpful for all traders. This trading system can be used with any forex pair and time frame, though lower time frames are recommended from M1 up to M
Liquidity Scalper System: a liquidity-based trading system in indicator form. Most indicators only show an arrow, and the trader then has to decide where the stop goes, where the target is and whether the signal can be trusted at all. Liquidity Scalper System covers the full trade cycle: it finds liquidity pools, gives a signal when they are broken, immediately calculates Entry, Stop Loss and three targets, and shows statistics and out-of-sample test results on the panel. The system picks its o
Smart Trend Trading System is a chart indicator for MetaTrader 4 that brings trend information, entry and exit signals, and price levels into one workspace. It combines 10+ trading tools into one system, including trend detection, reversal zones, smart cloud, trailing stop logic, support and resistance, candle coloring, alerts, and multi-timeframe analysis. The system is designed to help you trade different market conditions: Trending markets: Identify the main trend, detect pullbacks, follow mo
Advanced Supply Demand
Bernhard Schweigert
4.91 (302)
Trading Special – 30% OFF Best Solution for any Newbie or Expert Trader! This indicator is a unique, high quality and affordable trading tool because we have incorporated a number of proprietary features and a new formula. With this update, you will be able to show double timeframe zones. You will not only be able to show a higher TF but to show both, the chart TF, PLUS the higher TF: SHOWING NESTED ZONES. All Supply Demand traders will love it. :) Important Information Revealed Maximize the pot
This is a professional chart indicator designed for traders focused on stability and clear price action. It helps filter market noise and provides clear visual entry and exit zones for your trading decisions. Core Features: Strictly Non-Repainting: The system is built with strict non-repaint logic. What you see on the chart is the true historical performance. Confirmed Signals: Signals are triggered and confirmed only after the candle closes . Once a trading arrow appears on a closed candle, it
PRO Renko System
Oleg Rodin
5 (31)
PRO Renko System is a highly accurate trading system specially designed for trading RENKO charts. The ARROWS and Trend Indicators DO NOT REPAINT! The system effectively neutralizes so called market noise giving you access to accurate reversal signals. The indicator is very easy to use and has only one parameter responsible for signal generation. You can easily adapt the tool to any trading instrument of your choice and the size of the renko bar. I am always ready to provide extra support to help
Currency Strength Wizard is a very powerful indicator that provides you with all-in-one solution for successful trading. The indicator calculates the power of this or that forex pair using the data of all currencies on multiple time frames. This data is represented in a form of easy to use currency index and currency power lines which you can use to see the power of this or that currency. All you need is attach the indicator to the chart you want to trade and the indicator will show you real str
CRT Multi-Timeframe Market Structure & Liquidity Sweep Indicator Non-Repainting | Multi-Asset | MT5 Version Available MT5 Version:   https://www.mql5.com/en/market/product/162075 Full User Guide — explains what each feature does and why:   https://www.mql5.com/en/blogs/post/767525 Quick Start User Guide  — explains how to configure and in what order:  https://www.mql5.com/en/blogs/post/767540 Indicator Overview CRT Ghost Candle HTF Fractal is a complete institutional-grade market structure too
Day Trader Master is a complete trading system for traders who prefer intraday trading. The system consists of two indicators. The main indicator is the one which is represented by arrows of two colors for BUY and SELL signals. This is the indicator which you actually pay for. I provide the second indicator to my clients absolutely for free. This second indicator is actually a good trend filter indicator which works with any time frame. THE INDICATORS DO NOT REPAINT AND DO NOT LAG! The system is
Gann Made Easy
Oleg Rodin
4.82 (174)
Gann Made Easy is a professional and easy to use Forex trading system which is based on the best principles of trading using the theory of W.D. Gann. The indicator provides accurate BUY and SELL signals including Stop Loss and Take Profit levels. You can trade even on the go using PUSH notifications. PLEASE CONTACT ME AFTER PURCHASE TO GET TRADING  INSTRUCTIONS   AND GREAT EXTRA INDICATORS  FOR FREE! Probably you already heard about the Gann trading methods before. Usually the Gann theory is a
Pips Generator
Oleg Rodin
4.6 (10)
Apollo Pips Generator  is a channel based indicator which provides entry signals in the direction of the trend. The indicator provides multiple entry points so you can always find a trading opportunity to profit on. The tool also provides you with clear exit signals in a form of stars. ALL SIGNALS DO NOT REPAINT! The indicator can be used with any forex pair and time frame. The indicator provides all types of alerts including PUSH notifications. PLEASE CONTACT ME AFTER PURCHASE TO GET TRADING IN
All in One package includes the  Oscillator Predictor ,  MACD Predictor ,  Thrust Scanner  and  Advanced Fibonacci  indicators which are mandatory for applying  Dinapoli  trade plans.  Please visit below links for detailed explanations of indicators. Advanced Fibonacci Indicator =>  https://www.mql5.com/en/market/product/52834 Thrust Scanner Indicator => https://www.mql5.com/en/market/product/52830 Overbought /Oversold Predictor indicator => https://www.mql5.com/en/market/product/52621 Macd P
Trading Special –40% OFF Best Solution for any Newbie or Expert Trader! This Indicator is a unique, high quality and affordable trading tool because we have incorporated a number of proprietary features and a new formula. With only ONE chart you can read Currency Strength for 28 Forex pairs! Imagine how your trading will improve because you are able to pinpoint the exact trigger point of a new trend or scalping opportunity? User manual: click here That's the first one, the original! Don't buy a
An arrow tells you to buy. Obsidian Scalper Pro tells you where to buy, where the stop goes, where the three targets are, how big the position should be for your risk, and how good the setup is out of 100. Every signal arrives as a finished trade plan drawn on the chart, and a built in statistics window shows the honest result of the last hundred of them, win rate with a confidence interval and all. Every decision is made on a closed bar, so the history you are looking at is the history you woul
GoldRush Trend Arrow Signal V1.6 The GoldRush Trend Arrow Signal indicator V1.6 continues to provide precise, real-time trend analysis tailored for high-speed, short-term scalpers in XAU/USD , but it now has additional features and improved efficiency and reliability. Built specifically for the 1-minute time frame, this tool displays directional arrows for clear entry points, allowing scalpers to navigate volatile market conditions with confidence. The indicator consists of PRIMARY and SECONDARY
UR TrendExhaustion
Krzysztof Jan Debski
UR TrendExhaustion   UR   TrendExhaustion is the best solution for traders who don't want to deal with parameter values nor other set-ups - it is both easy and visually-understandable for everyone. Advantages of using UR TrendExhaustion: No parameters You have 3 lines that describe best what's going on on the chart:   Trend Exhaustion Line ,   Whale Money Line   and   Retail Money Line . The interface showcases the exhaustion of either line on both extremes (red areas) The best advantage: Easy a
Alright. This indicator works on MT4 and is very easy to use. When you receive a signal from it, you wait for that candle with the signal to close and you enter your trade at the beginning of the next new candle. A red arrow means sell and a green arrow means buy. All arrows comes with a long dotted like for easy identification of trade signal. Are you okay with that?   100% non repaint Work All Major currency  Pair,  1 minute time frame 1 minute expire
Neuro Poseidon MT4
Daria Rezueva
4.74 (46)
Neuro Poseidon is a new indicator by Daria Rezueva. It combines precise trading signals with adaptive TP/SL levels - creating best possible trades as a result! Message me and get  Neuro Poseidon Assistant  as a gift to automize your trading process! What makes it stand out? 1. Proven profitability on all assets and timeframes 2. Only confirmed BUY and SELL signals present on the chart 3. Adaptive TP & SL levels generated by the software for each trade 4. Easy to understand - suitable for all
This indicator works on MT4 and is very easy to use. When you receive a signal from it, you wait for that candle with the signal to close and you enter your trade at the beginning of the next new candle . A red arrow means sell and a green arrow means buy. All arrows comes with Alert  like for easy identification of trade signal. Are you okay with that? 1 minute candle 1 minute expire
Scalper Vault
Oleg Rodin
5 (40)
Scalper Vault is a powerful, fully-equipped trading system designed for traders who want to achieve consistency in intraday trading . This high-precision indicator serves as a complete, standalone trading system that delivers institutional-grade analysis for both Forex and Binary Options traders. PLEASE CONTACT ME AFTER PURCHASE TO GET MY TRADING TIPS PLUS A GREAT BONUS! By eliminating the guesswork and complex manual analysis, Scalper Vault allows you to focus purely on execution using easy t
Trend Lines PRO
Roman Podpora
5 (1)
TREND LINES PRO    helps understand where the market is truly changing direction. The indicator shows real trend reversals and points where major players re-enter. You see   BOS lines   Trend changes and key levels on higher timeframes — without complex settings or unnecessary noise. Signals don't repaint and remain on the chart after the bar closes. VERSION MT 5     -     Reveals its maximum potential when paired with the   RFI LEVELS PRO  indicator What the indicator shows: Real shifts   tren
Extreme Value Sniper is a detrended price indicator  Indicator finds the potential reversal levels by checking value ranges and price cycles. MT5 Version of the product :  https://www.mql5.com/en/market/product/114550 It shows the overbought and oversold levels using the average range. Overbought Levels are between 4 and 10 Oversold levels are bewtween -4 and -10 Those levels can be used as a reversal levels. Extreme Value Sniper look for some special divergence and convergence patterns to c
KT Parabolic RSI MT4
KEENBASE SOFTWARE SOLUTIONS
KT Parabolic RSI overlays Parabolic SAR directly on the RSI line to highlight likely market turning points. Classic RSI overbought and oversold readings already hint at reversals, but the added PSAR filter removes much of the noise and sharpens those signals, giving you clearer and more reliable trade setups. Big Square Signals: A Parabolic SAR flip on an RSI that sits in overbought or oversold territory. These mark high-probability market turns. Small Square Signals: A SAR flip inside the neutr
More from author
Market Structure Order Block Dashboard MT5 is an MT5 indicator designed for traders who want to read market structure and the main price reaction zones directly on the chart. It combines BOS, ChoCH, Order Blocks, Fair Value Gaps (FVG), Liquidity, Kill Zones, Volume Profile, and a compact dashboard for quick analysis. This indicator targets traders who use market structure, ICT and Smart Money concepts as a decision framework. It can help spot trend continuations, possible reversals, price imbala
One click trading panel, lot size calculator and trade manager for MetaTrader 5 Trading Panel PRO MT5 is a trade panel to prepare, execute and manage manual and semi-manual trades directly from the chart, with visual risk control at every step. It combines one click execution of market, limit and stop orders, a risk calculator that sizes the lot from your risk in percent, in account currency or as a fixed lot, entry, stop loss and take profit zones you drag on the chart, an ATR stop loss, a take
Position Size Calculator Lite MT5 - Free Risk Management Indicator (v2.0) Free Lite version of the Position Size Calculator. If you need interactive drag and drop of SL/TP lines, Fixed Lot mode and adjustable Risk/R:R/ATR from the panel, see the PRO version on the Market: Position Size Calculator PRO MT5 . Overview Position Size Calculator Lite MT5 is a free indicator that calculates the recommended lot size for a trade based on a risk percentage, an ATR-based Stop Loss and a target risk/reward
FREE
Session Volume Profile Value Area shows you where the market actually traded during the current session - not just where price went. It builds a horizontal volume profile directly on your chart and marks the three levels traders watch: the POC, the VAH and the VAL. Most charts only show price. Volume Profile adds the missing dimension: how much was traded at each price . Prices where a lot of volume changed hands are areas the market accepted; prices it moved through quickly are areas it reject
FREE
Double top, double bottom and head and shoulders indicator for MT5 with entry, stop and target levels This MT5 indicator detects reversal chart patterns on closed bars: the double top and the double bottom (the M and W patterns), the head and shoulders and the inverse head and shoulders . Each pattern becomes three prices written on the chart: the entry on the neckline breakout, the stop and the measured target. A pattern is shown while it is still forming, is confirmed on a bar close, and each
Currency strength meter for MetaTrader 4 This currency strength indicator reads up to 28 major pairs and turns them into one number per currency, for the 8 majors: USD, EUR, GBP, JPY, CHF, CAD, AUD and NZD. Instead of opening chart after chart to work out who is leading, you read one panel on your MetaTrader 4 chart and you know which currency is being bought and which one is being sold. What you see on the chart A ranked strength bar for each of the 8 currencies, with its percentage A multi-tim
Trailing Stop Manager Basic — Free Trailing Stop EA (MT5) Trailing Stop Manager Basic is the free version of Trailing Stop Manager PRO. This MetaTrader 5 Expert Advisor automates fixed-pip trailing stop management, break-even, and 1-level partial close across all open positions on your account. It works with manual orders and orders generated by any other EA. The tool includes a professional visual dashboard identical to the PRO version — daily statistics, real-time P&L, position status, and int
FREE
Lot & Risk Calculator PRO MT5 (v2.30) Position Size Calculator PRO is an advanced risk management tool for MetaTrader 5 that calculates the recommended lot volume based on your risk per trade, your Stop Loss distance, and the symbol specifications (tick value, tick size, volume min/max/step, margin). No trading operations: this indicator does not open or close orders and does not manage positions. It is a decision-support tool to standardize your money management and reduce sizing errors before
SMC Trade Pilot MT5
Prime Horizon
5 (1)
Order block, BOS and ChoCH expert advisor for MetaTrader 5, with Telegram alerts SMC Trade Pilot MT5 reads market structure on your chart and sends the signal to Telegram. It marks break of structure (BOS) and change of character (ChoCH), draws order blocks with a strength score , tracks fair value gaps (FVG) and liquidity sweeps, displays a volume profile with point of control, value area high and low, and sums everything up in a compact dashboard with a multi-timeframe panel, a confluence scor
Currency strength meter and dashboard for MetaTrader 5 This currency strength indicator reads up to 28 forex pairs and turns them into one number per currency, for the 8 majors: USD, EUR, GBP, JPY, CHF, CAD, AUD and NZD. It combines a currency strength meter, a multi-timeframe agreement matrix, a strength history sparkline per currency, a best and worst pair finder, a 28 pairs differential panel, CSV export, one-click chart switching and configurable alerts, in a single dashboard on your MetaTra
Liquidity Sweeps Detector PRO MT4 A Smart Money Concepts (SMC / ICT) indicator that maps buy-side and sell-side liquidity, detects when price sweeps a liquidity level, and confirms the following Market Structure Shift (MSS). Each valid sweep + MSS is marked with an arrow and graded by multi-timeframe confluence, with an automatic risk-reward projection and a live on-chart dashboard. WHAT IT DOES Maps buy-side (BSL) and sell-side (SSL) liquidity from confirmed swing highs and lows. Detects a li
Liquidity Sweeps Detector PRO MT5 — Version 1.5 Multi-Timeframe Liquidity Sweeps Detector PRO MT5 is a technical analysis indicator for MetaTrader 5 that detects liquidity sweeps with Market Structure Shift (MSS) confirmation. Based on Smart Money Concepts / ICT methodology, it identifies Buy Side Liquidity (BSL) and Sell Side Liquidity (SSL) levels, and signals stop hunts followed by structure shift. The indicator provides native multi-timeframe analysis with A+ / A / B / C confluence scoring.
Multi-symbol SMC scanner and dashboard for MetaTrader 5 This Smart Money Concepts scanner reads your whole symbol list and puts one row per symbol on a single dashboard . For each symbol it runs the same SMC engine: market structure with break of structure and change of character, order blocks, fair value gaps and liquidity. Each row shows the structure trend on three timeframes, a Buy or Sell signal, a confluence score from 0 to 100, the nearest unmitigated order block and the latest liquidity
Multi Currency Strength Dashboard Mini (FREE) – Currency Strength Meter for MetaTrader 5 Multi Currency Strength Dashboard Mini is a free indicator for MetaTrader 5 that displays the relative strength of the 8 major currencies (USD, EUR, GBP, JPY, CHF, CAD, AUD, NZD) in real time, in a clear and quick-to-read dashboard. Goal: identify in seconds which currencies are strong and which are weak, so you can build a focused watchlist (for example, pick pairs where a strong currency faces a weak one).
FREE
SuperTrend indicator MT5: multiple take profits, stop loss and lot size Trendline Targets Dashboard is a trend-following indicator for MetaTrader 5. It combines an adaptive SuperTrend trend line, an optional Heikin Ashi reading, a Triple SuperTrend confluence mode, an automatic stop loss and up to three take profit targets (TP1, TP2, TP3), partial exits, move to breakeven, a risk reward model in R multiples, a lot size calculator, an ADX trend-strength filter, an ATR volatility filter, a higher-
Trailing Stop Manager PRO: trailing stop, break-even and partial close EA for MetaTrader 5 Trailing Stop Manager PRO is a trade manager for MetaTrader 5. It applies a trailing stop, a break-even, partial closes and drawdown protection to every open position on the account, whether the position was opened by hand or by another Expert Advisor. The stop is the part of a trade most often left unmanaged. This utility moves it for you, on a rule you choose, and it never moves a stop against the positi
Position Size Calculator PRO MT4 V2.0 – Lot Size + Visual SL/TP Zones (Drag & Drop) for Faster, Safer Risk Management Position Size Calculator PRO MT4 V2.0 is a position sizing (money management) indicator for MetaTrader 4. It automatically calculates the optimal lot size based on your risk per trade , your Stop Loss distance, and symbol specifications (tick value, tick size, margin, leverage, etc.). Version 2.0 is a major upgrade: instead of only reading a panel, you can manage the trade direct
SMC Trade Pilot MT4 Semi-automatic trading assistant for Smart Money Concepts traders. Receive signals directly on Telegram with a chart screenshot, then place the trade with a single tap. Manage your positions from your phone, even when you are away from your computer. The problem it solves Smart Money setups do not wait. Order Blocks and Liquidity Sweeps form during the London open, the New York open or in the middle of the Asian session, often while you are at work, in a meeting or simply awa
Session Volume Profile SMC shows you where the market actually traded - not just where price went. For every session (Day, Week or Month) it builds a horizontal volume profile directly on your chart, revealing the price levels that attracted the most activity and that price tends to respect later. Most charts only show price. Volume Profile adds the missing dimension: how much was traded at each price . This indicator turns that into a clean, session-based read and layers a Smart Money Concepts
Filter:
No reviews
Reply to review