Smart Breakout Channels MT4
- Indicators
- Duc Hoan Nguyen
- Version: 1.12
- Updated: 12 August 2025
- Activations: 10
New tools will be $30 for the first week or the first 3 purchases!
Trading Tools Channel on MQL5: Join my MQL5 channel to update the latest news from me
See more MT5 version at: Smart Breakout Channels MT5 Scanner
See more MT4 version at: Smart Breakout Channels MT4 Scanner
See more products at: All Products
CONCEPTS
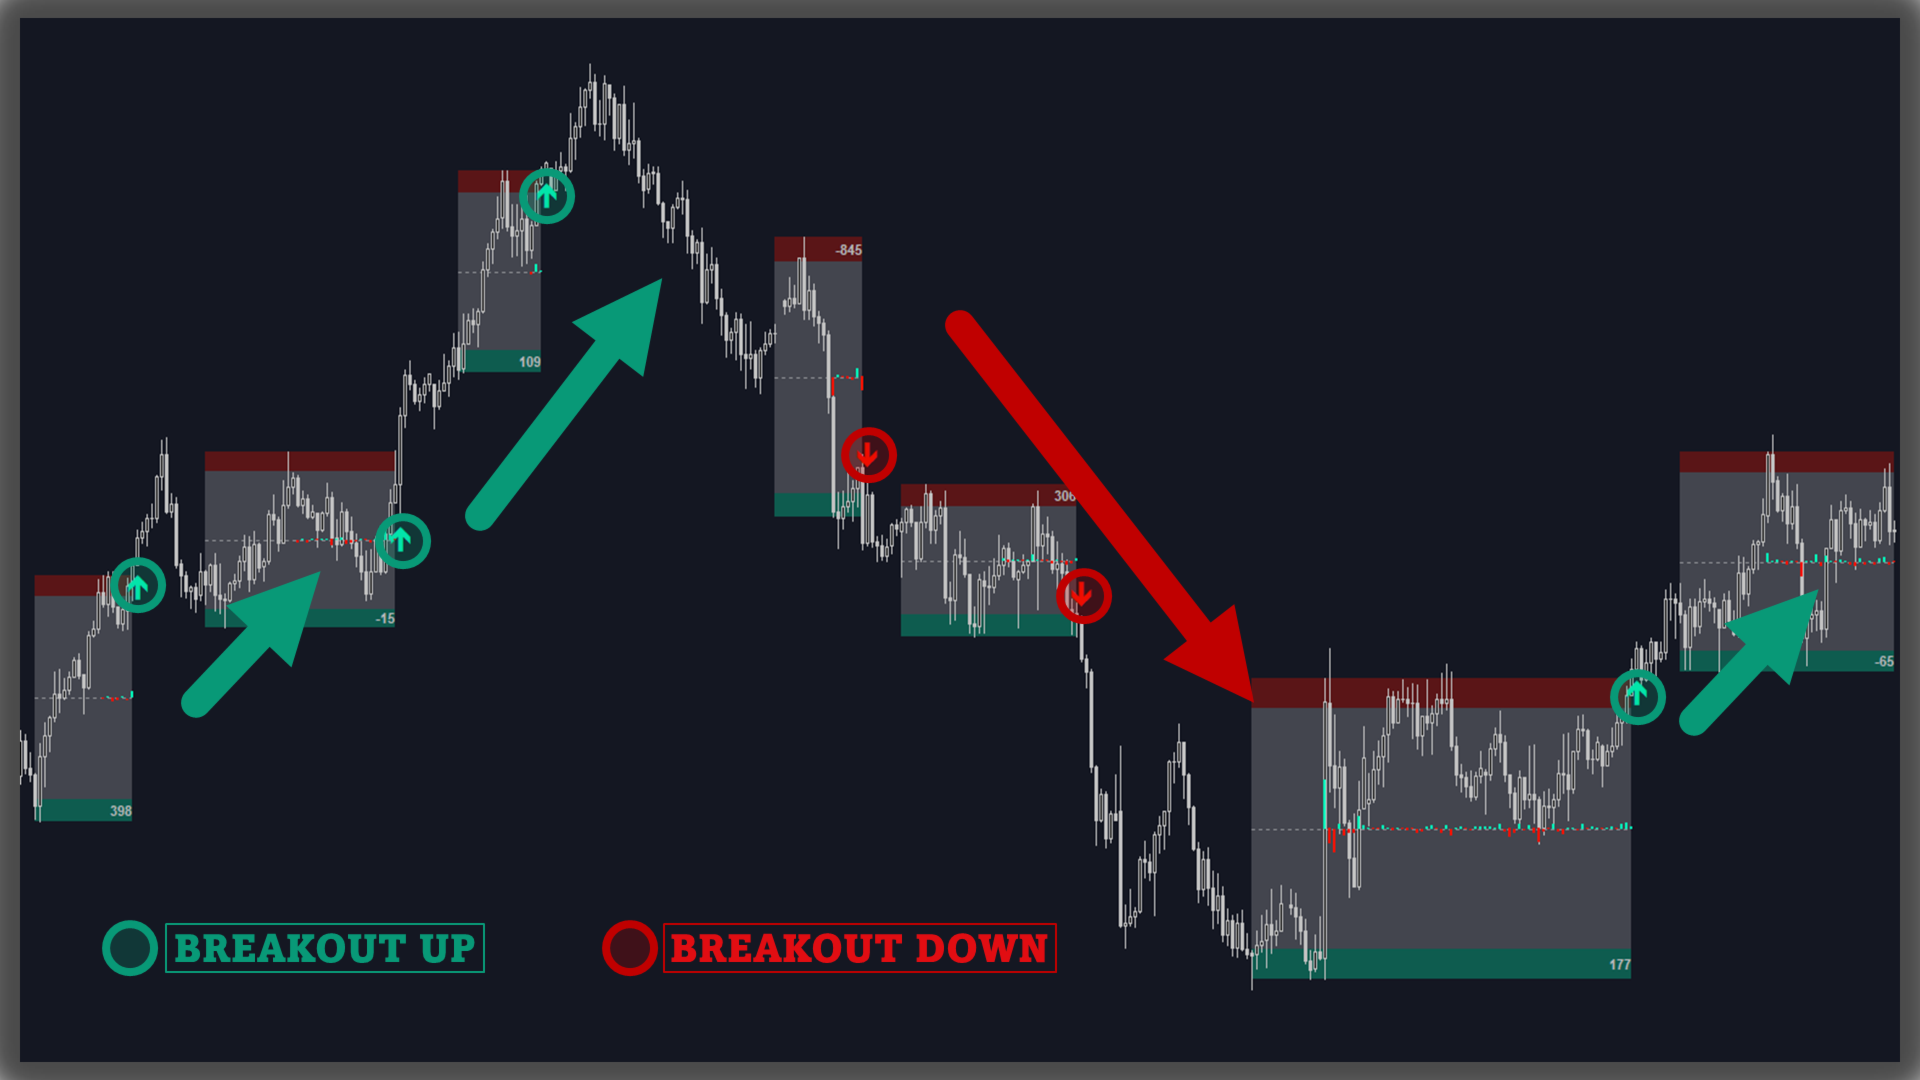
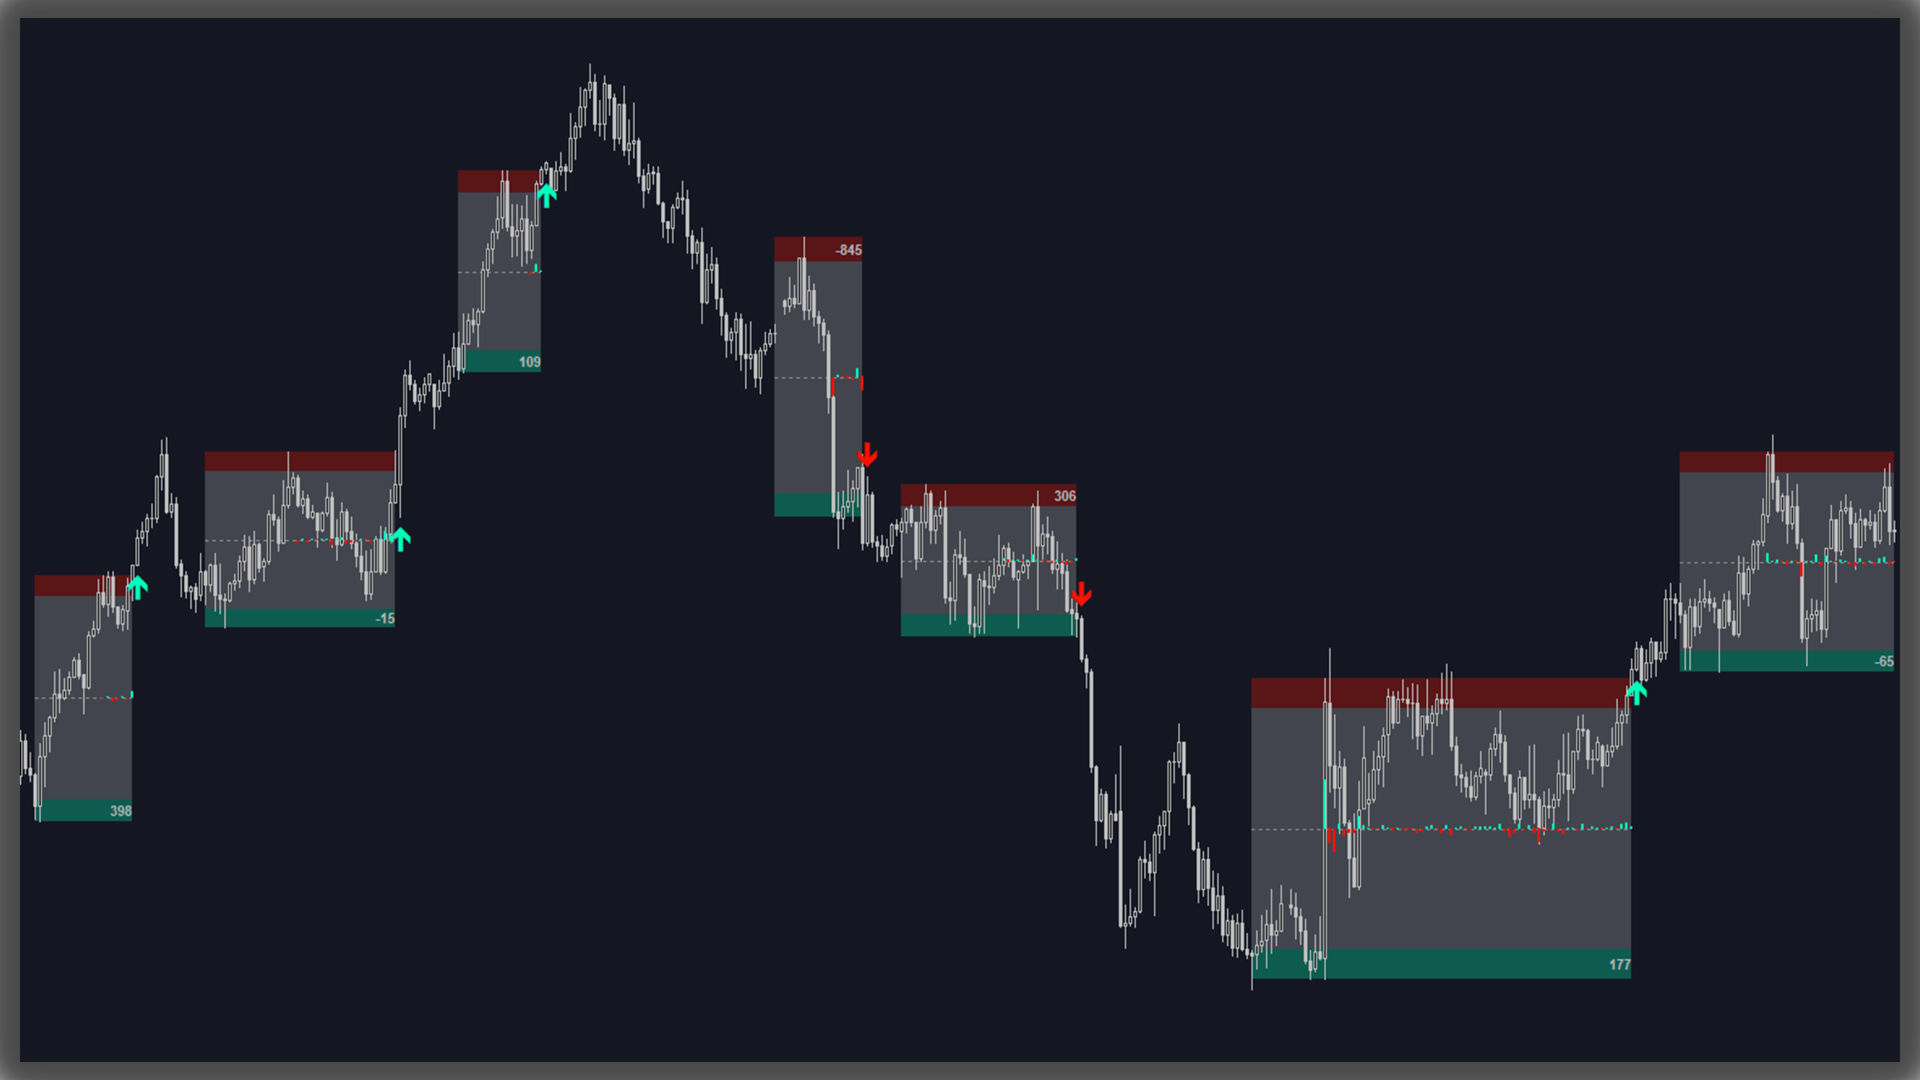
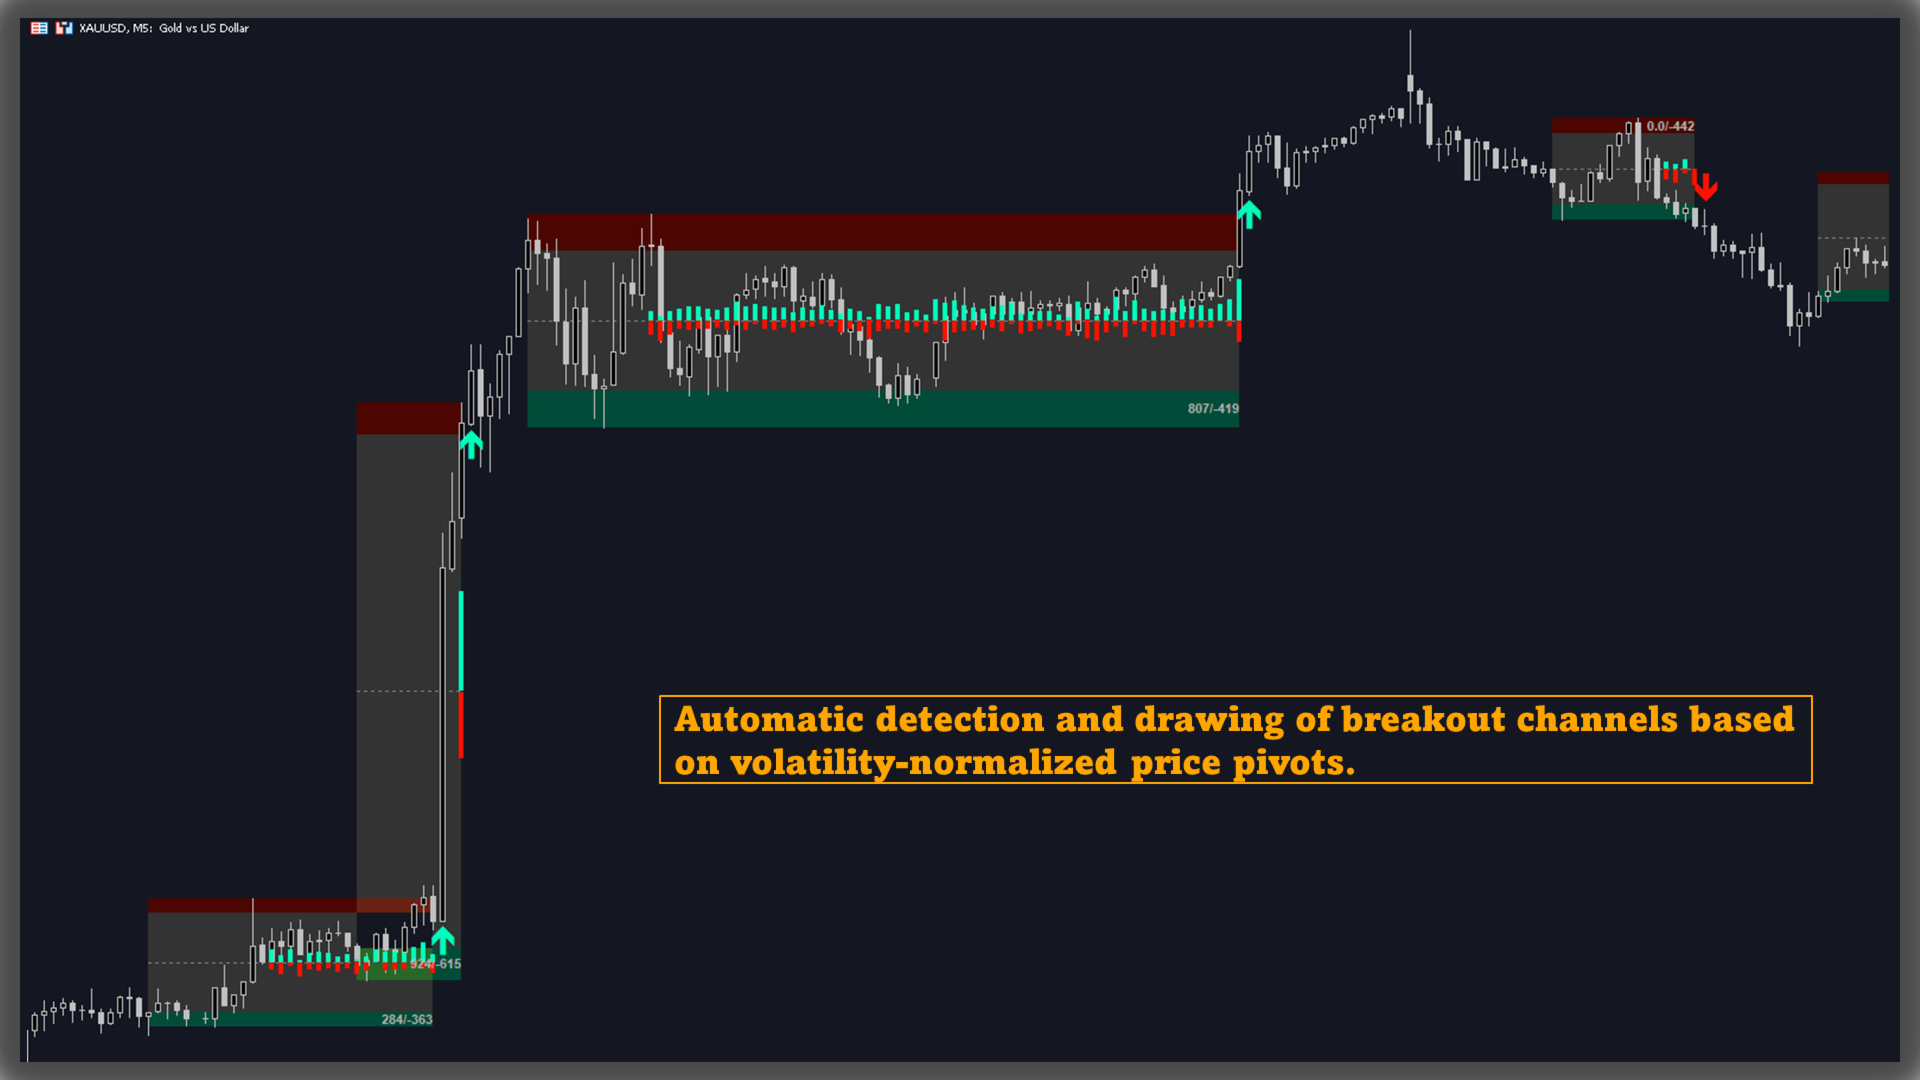
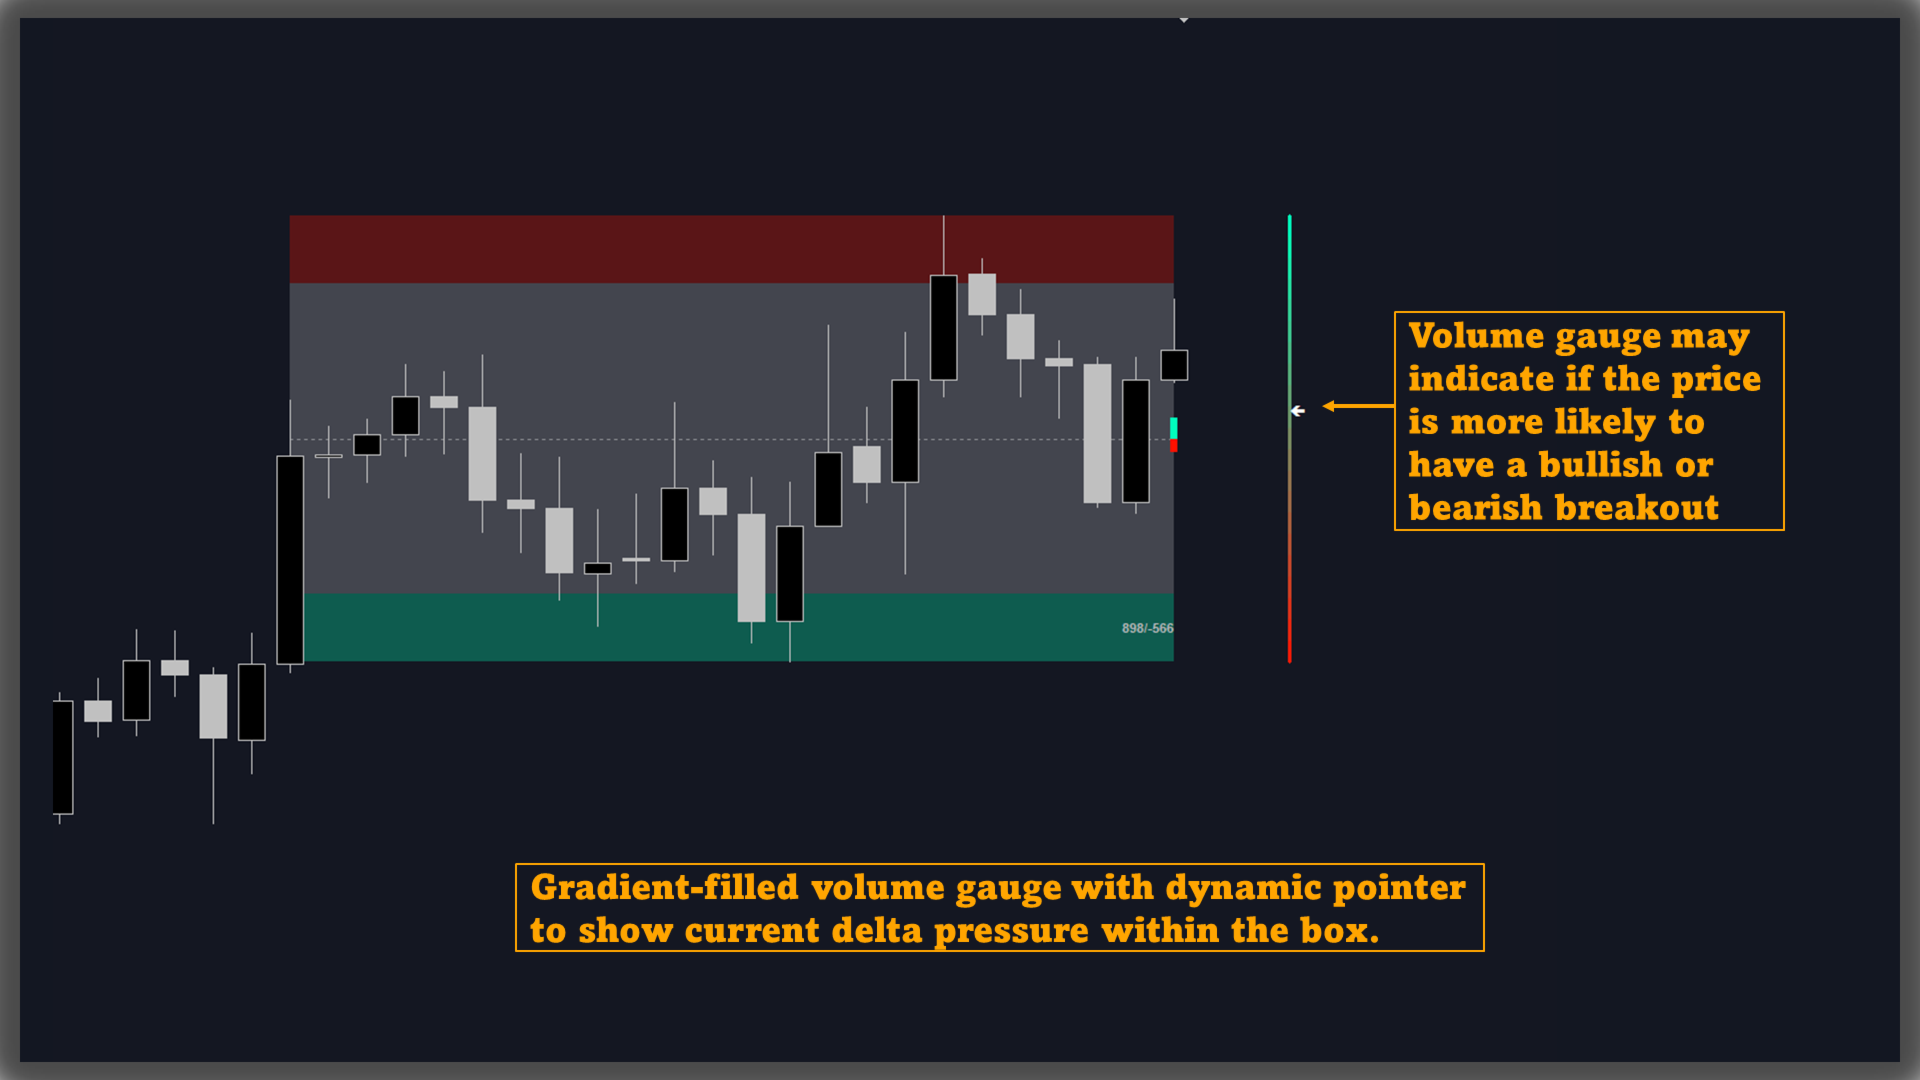
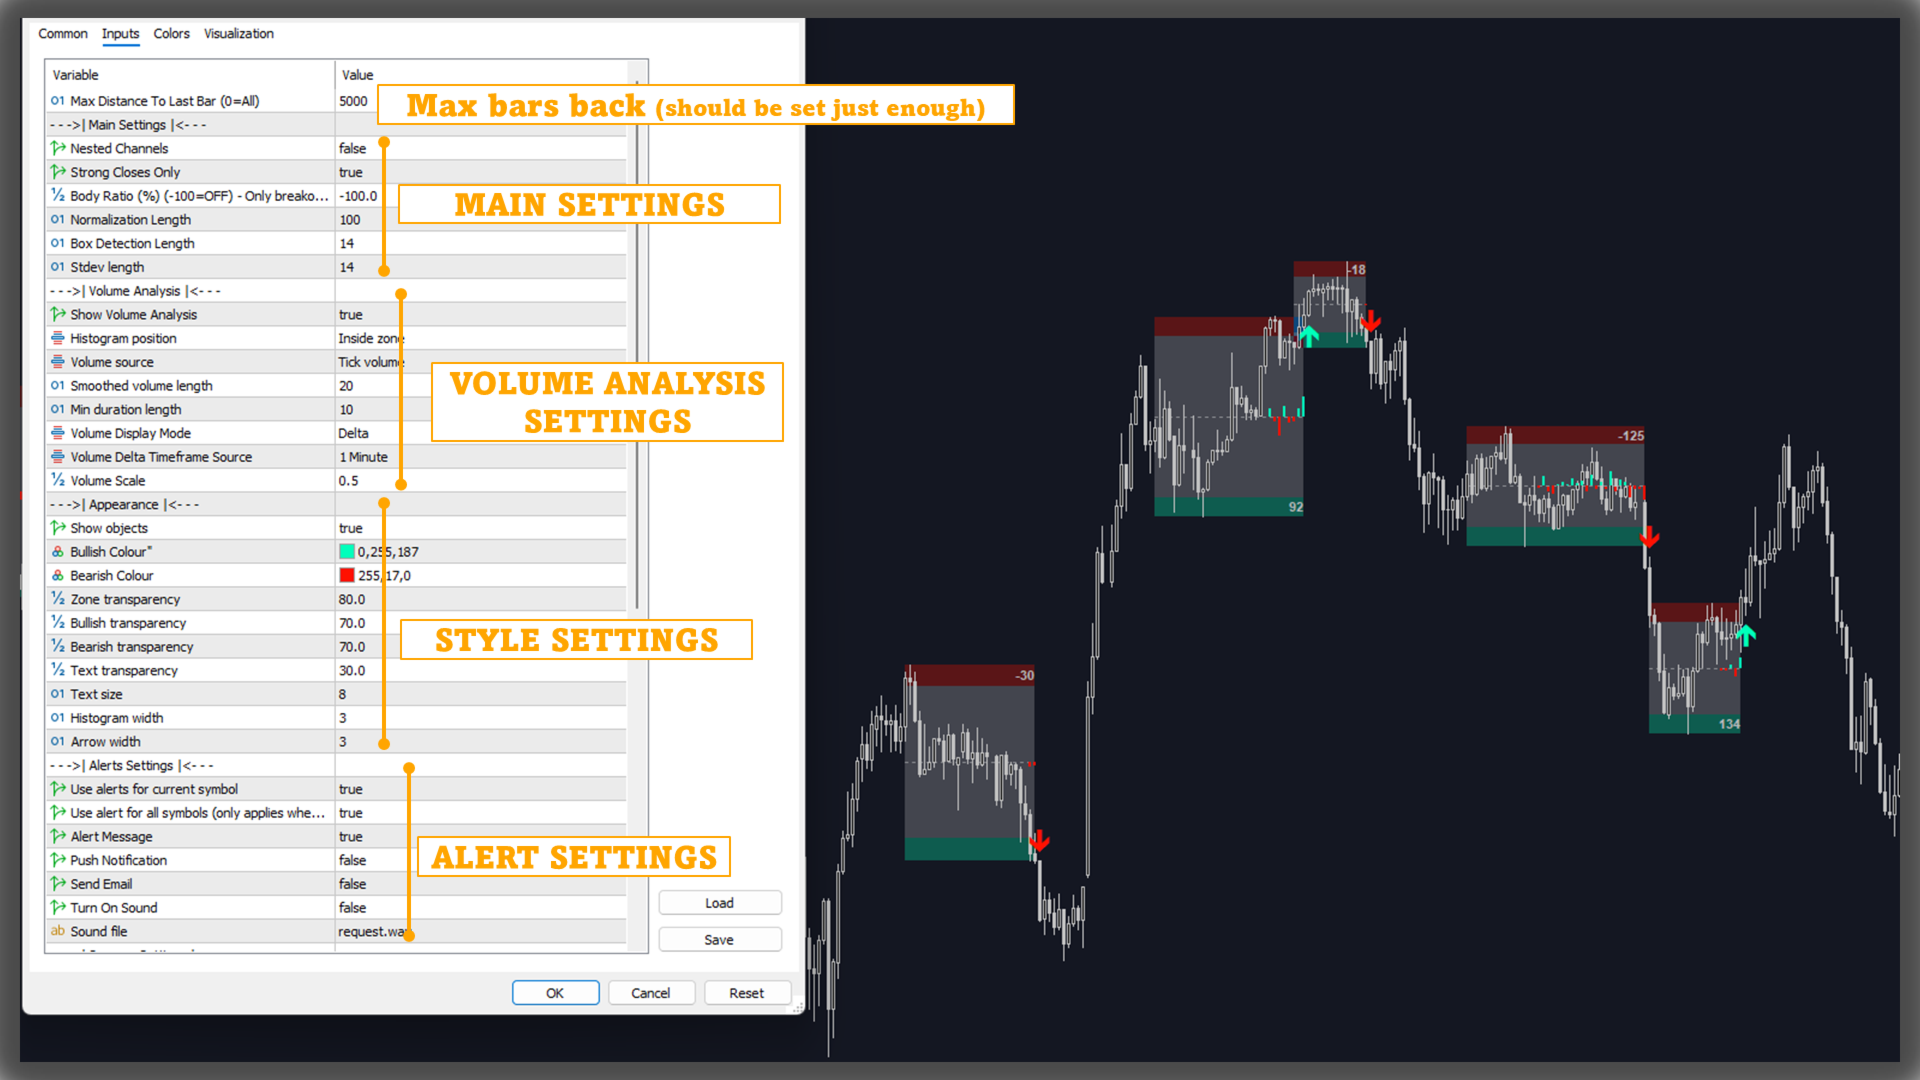
The calculation of normalized price volatility is performed by measuring the standard deviation of price and mapping it to a [0,1] scale using the highest and lowest prices over a defined lookback period. When normalized volatility reaches a local low and then begins to rise, a boxed channel is drawn between the highest and lowest prices in that zone. These boxes remain until price moves beyond them, either with a candle close (configurable) or by touching the boundary. Volume information is displayed as delta bars inside the box, showing volume distribution during the channel. A real-time visual gauge indicates the position of volume delta within the channel range.
FEATURES
-
Detection and drawing of breakout channels based on volatility-normalized price pivots.
-
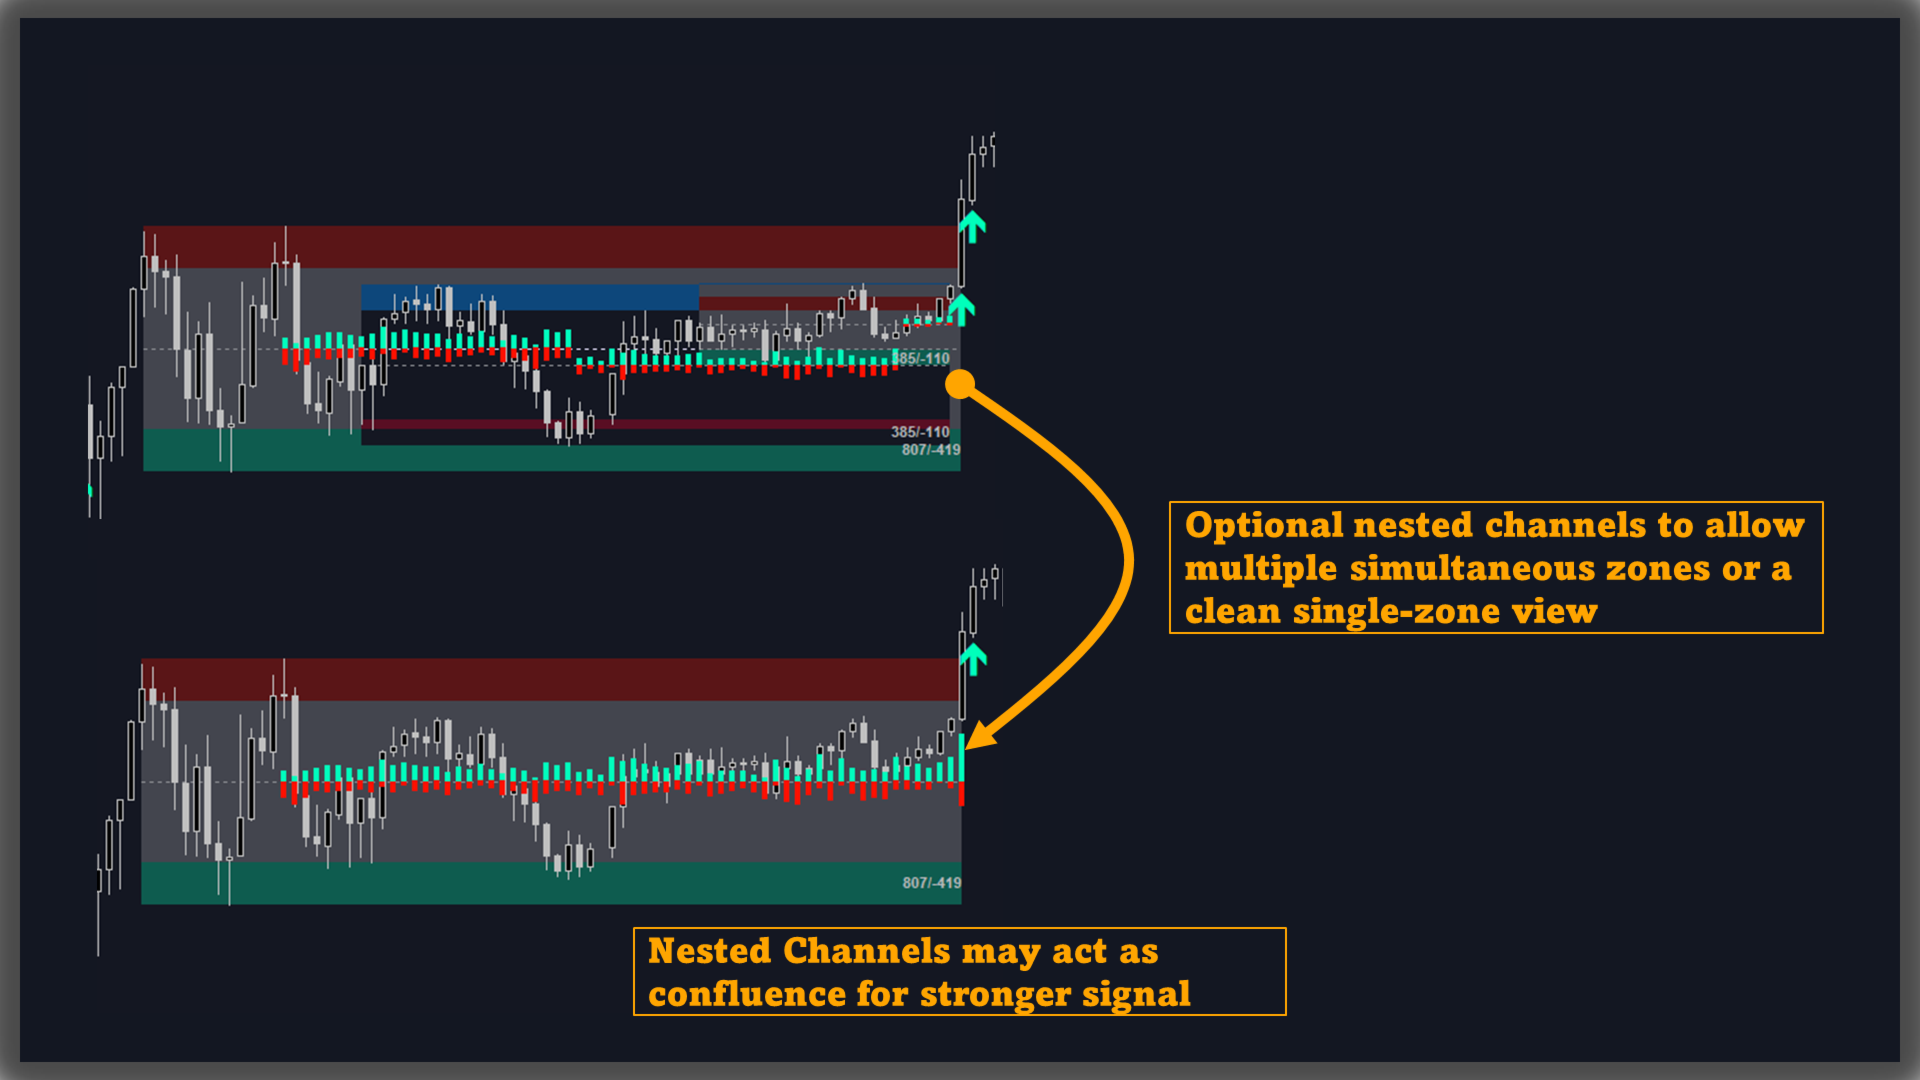
Optional nested channels to allow multiple simultaneous zones or a single-zone view.
-
Gradient-filled volume gauge with dynamic pointer to display current delta position within the box.
-
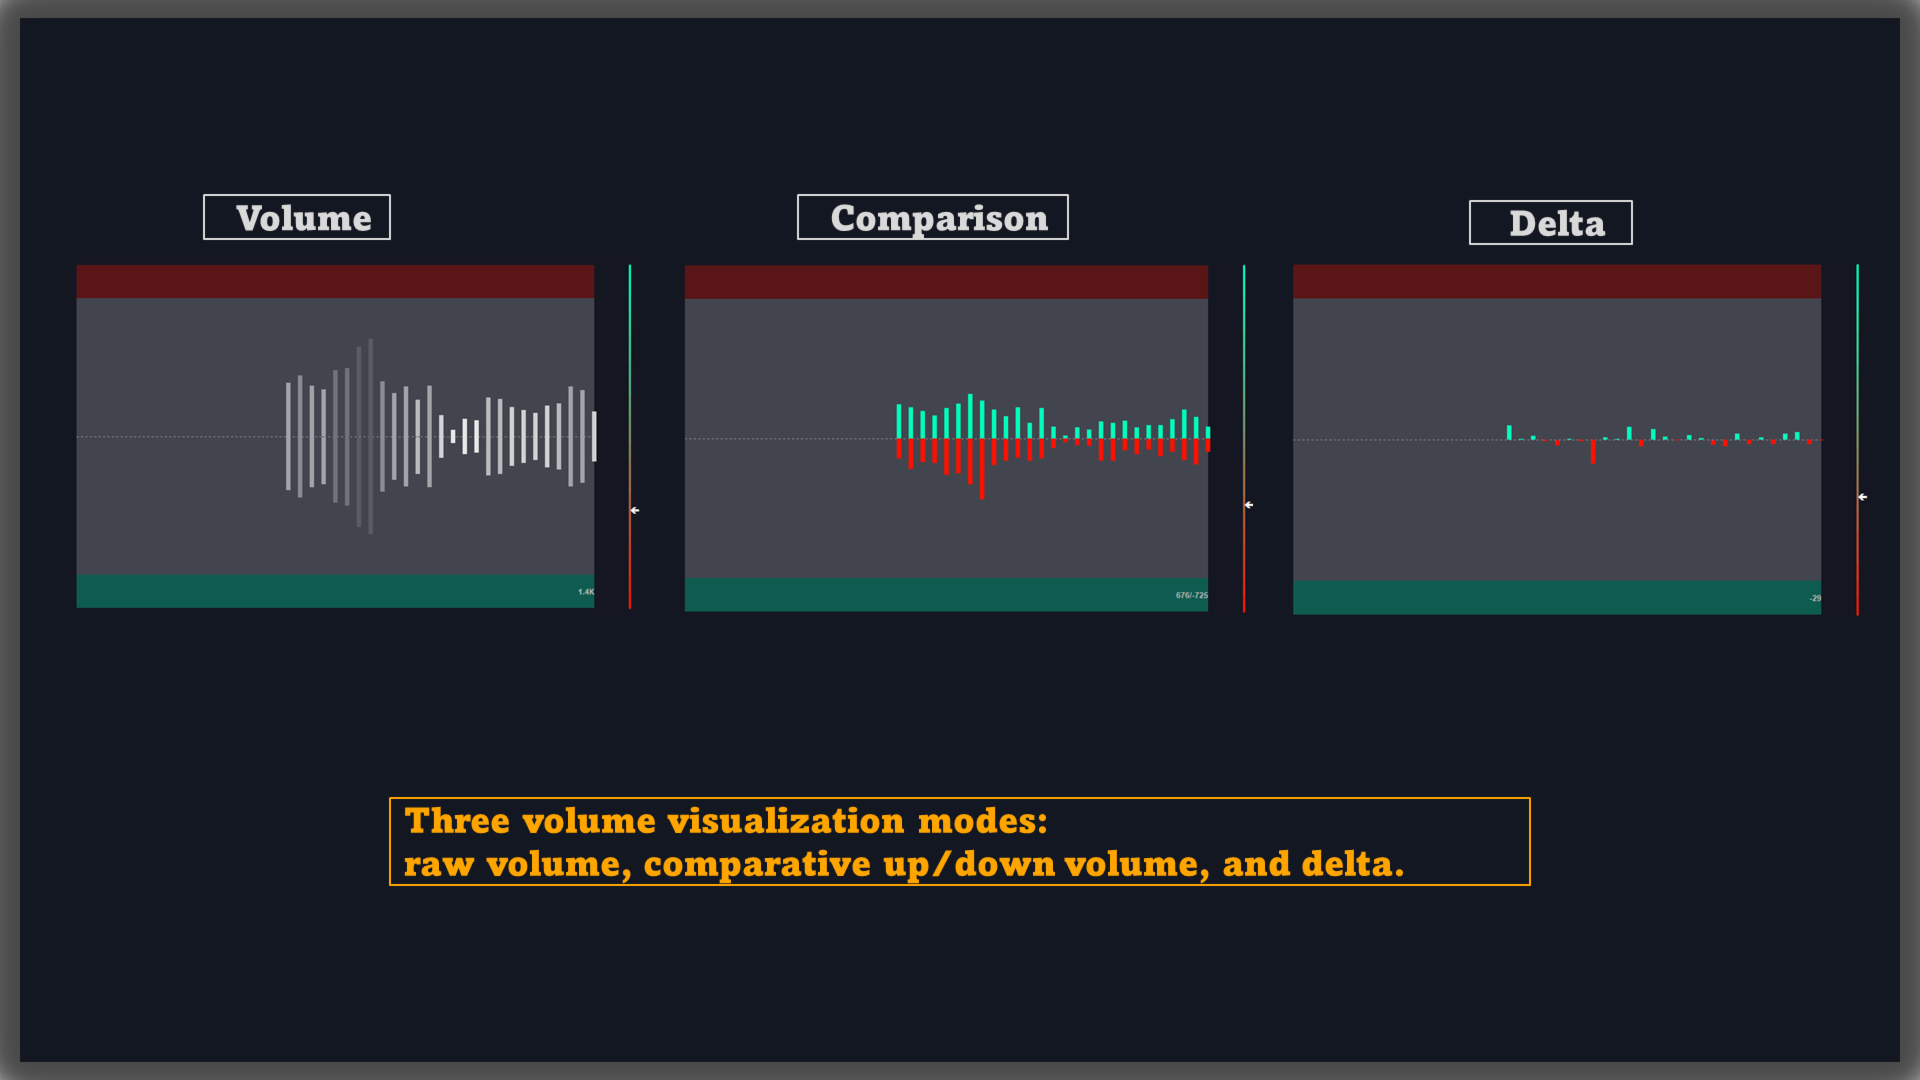
Three volume display modes: raw volume, comparative up/down volume, and delta.
-
Alerts for new channel formation and breakout events.
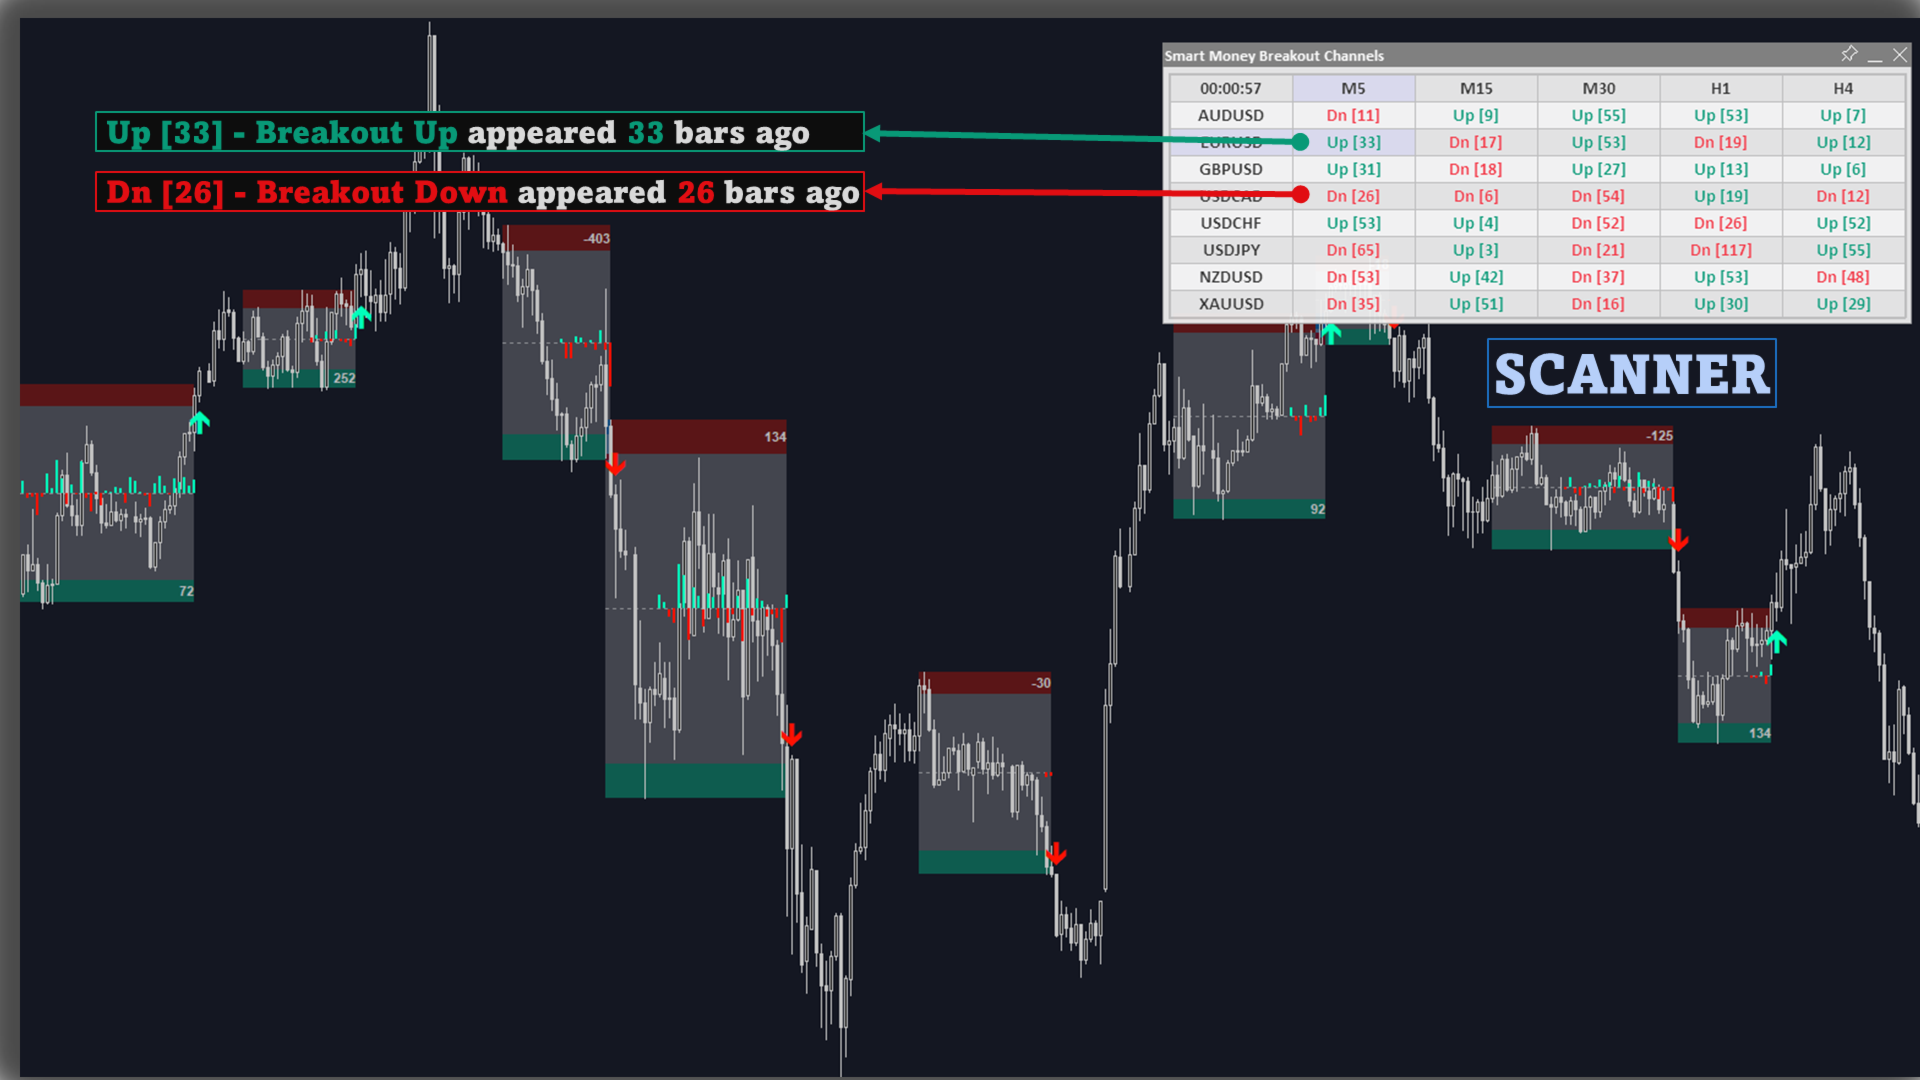
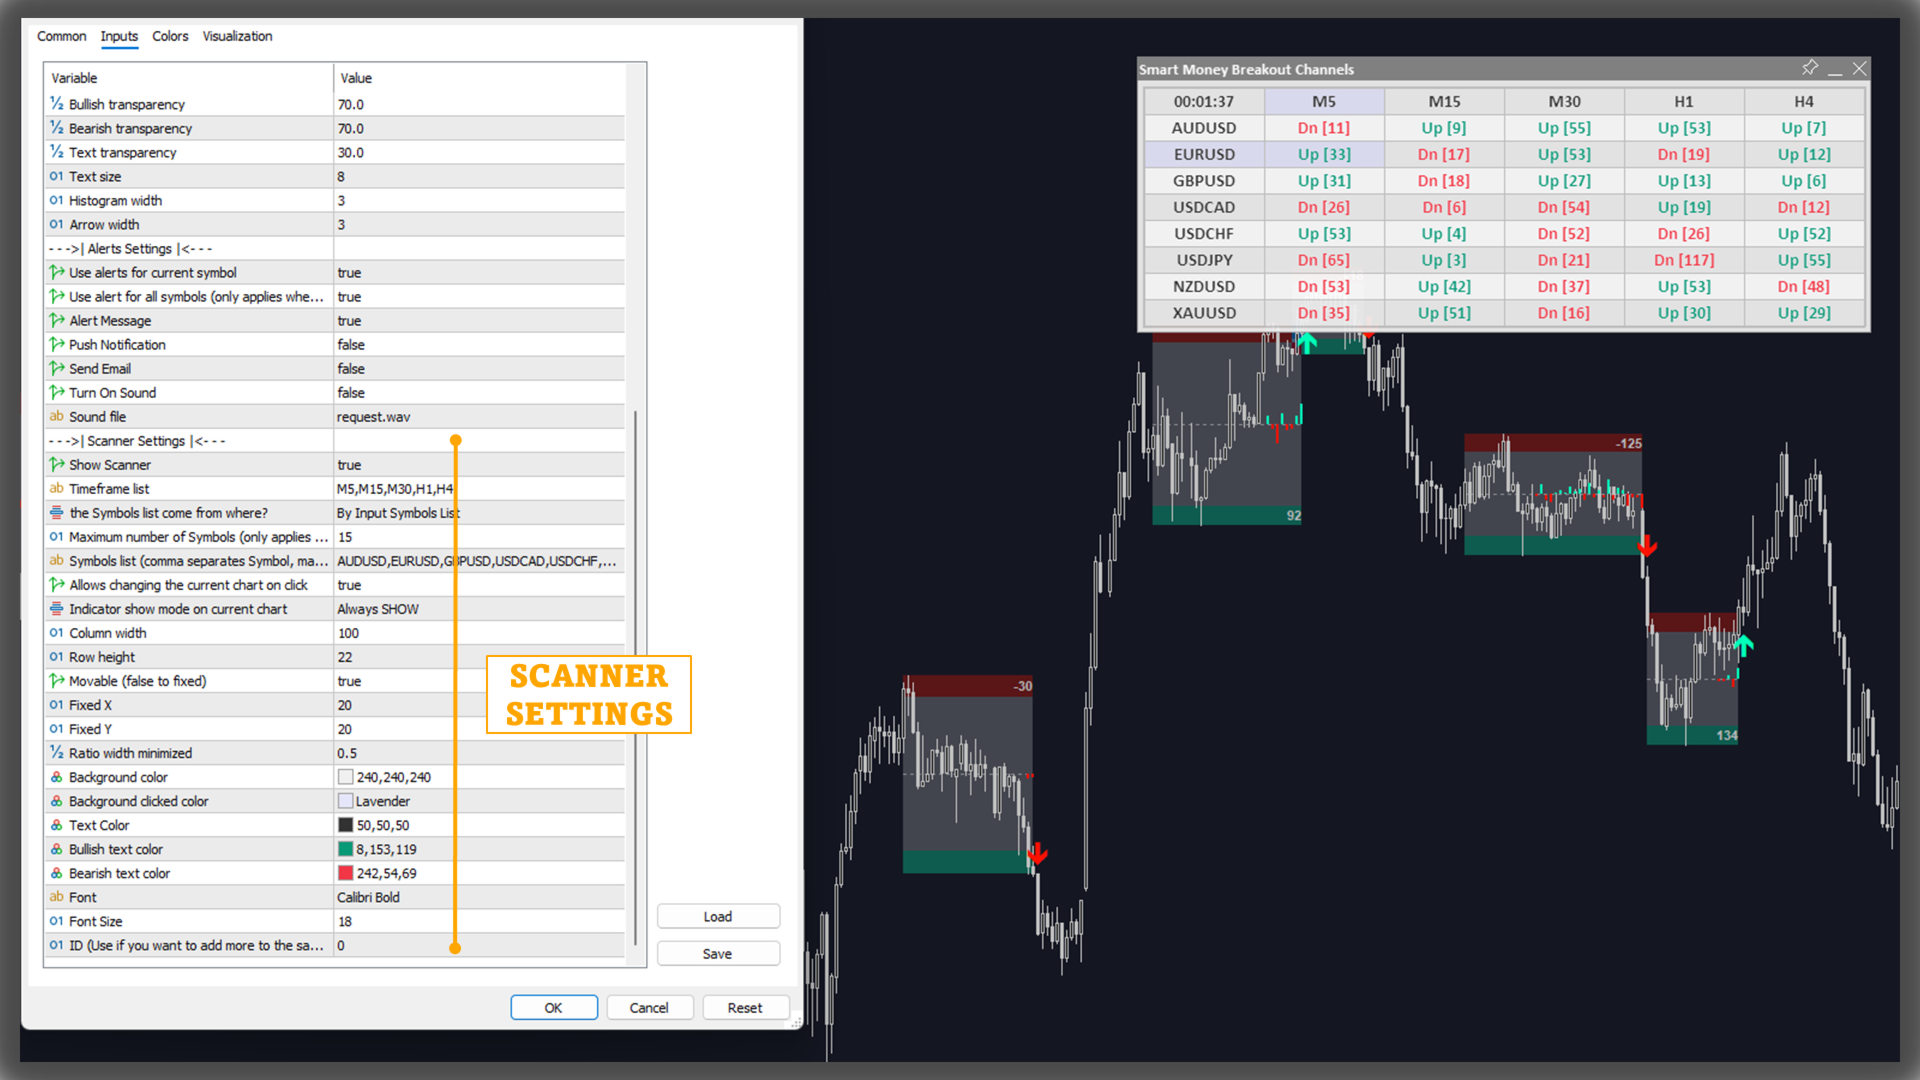
SCANNER AND ALERTS
Users can turn on/off the scanner to monitor other charts quickly.USAGE
The indicator has signal alerts when Buy/Sell appear, Breakout arrows appear, users can easily grasp market information with these alerts (especially when using Scanner)
Apply the indicator to any chart. A breakout box appears when volatility changes and a stable range forms. Monitor price in relation to box boundaries. A move above the upper boundary may indicate upward continuation, and a move below the lower boundary may indicate downward continuation. The “Strong Closes Only” option can be used to filter signals.
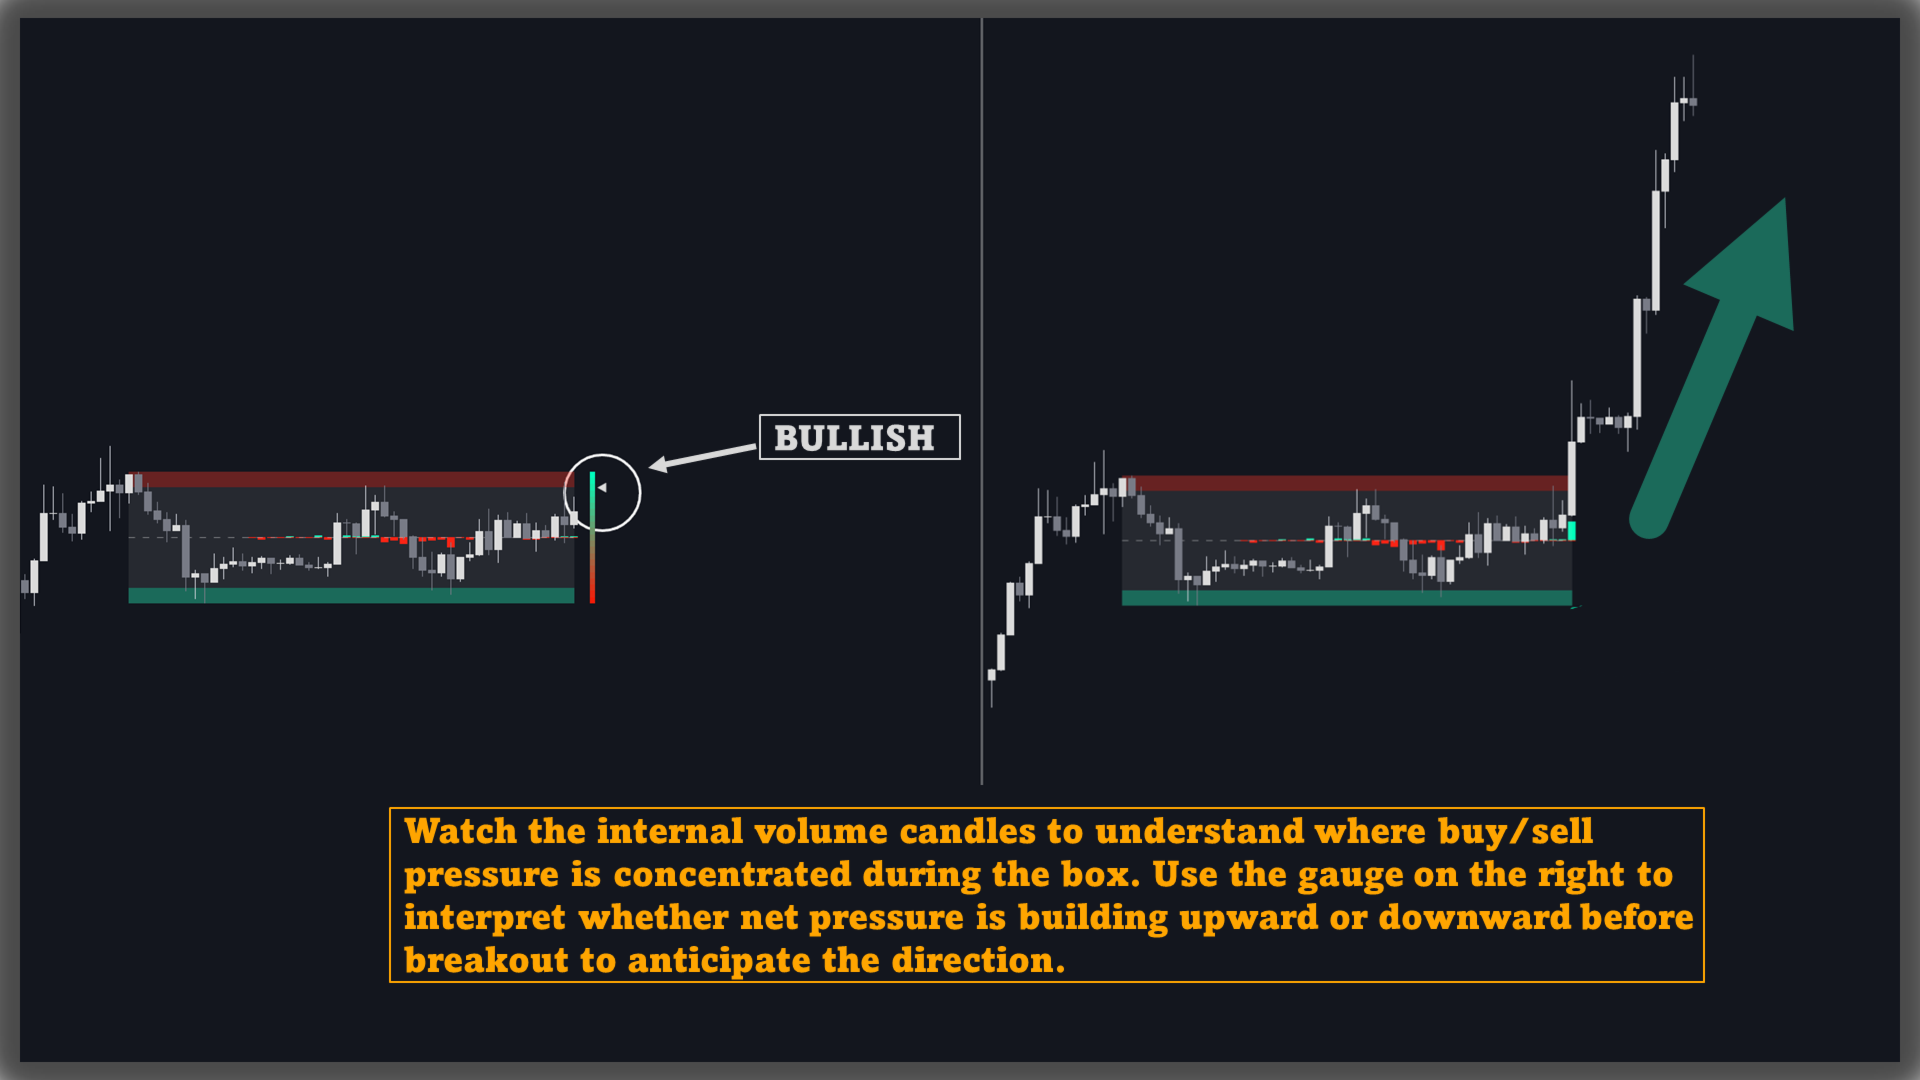
Observe internal volume candles to assess the concentration of buy/sell activity within the box. The gauge on the right can be used to interpret whether net pressure is leaning upward or downward before a breakout.
Alerts can be used to receive notifications of breakout events without constant chart monitoring.