RSI Kernel Optimized MT4 with Scanner
- Indicators
-
Duc Hoan Nguyen
 I develop practical trading tools for MetaTrader 4/5, with a focus on indicator integration, Multi-Timeframe analysis, market scanning, and automated trading solutions.
My work mainly includes:
• Indicator-to-EA Solutions - Version: 3.0
- Updated: 1 October 2026
- Activations: 10
Get this indicator and more for free here: Convert indicator into a trading robot (no coding required)
Special offer: ALL TOOLS, just $35 each for a limited time!
New tools will be $30 for the first week or the first 3 purchases!
Trading Tools Channel on MQL5: Join my MQL5 channel to receive the latest updates
See the MT5 version at: RSI Kernel Optimized MT5 Multi-TF Scanner
See the MT4 version at: RSI Kernel Optimized MT4 Multi-TF Scanner
See more products at: All Products or Trading Indicators, Special Offers & New Releases
RSI Kernel Optimized places the current RSI in the context of previous price pivots. It compares today's RSI with readings recorded when price formed confirmed local highs and lows, then presents the result through bullish and bearish dots, Buy and Sell arrows, optional RSI/KDE labels, and a multi-timeframe Scanner.
Use it to observe where RSI stands relative to earlier turning points on the same market, follow an active condition on the chart, and review those conditions across selected symbols and timeframes.
Key features
- Separate RSI reference distributions built from confirmed price pivot highs and lows.
- Kernel density estimation (KDE) to examine where pivot-related RSI readings are concentrated.
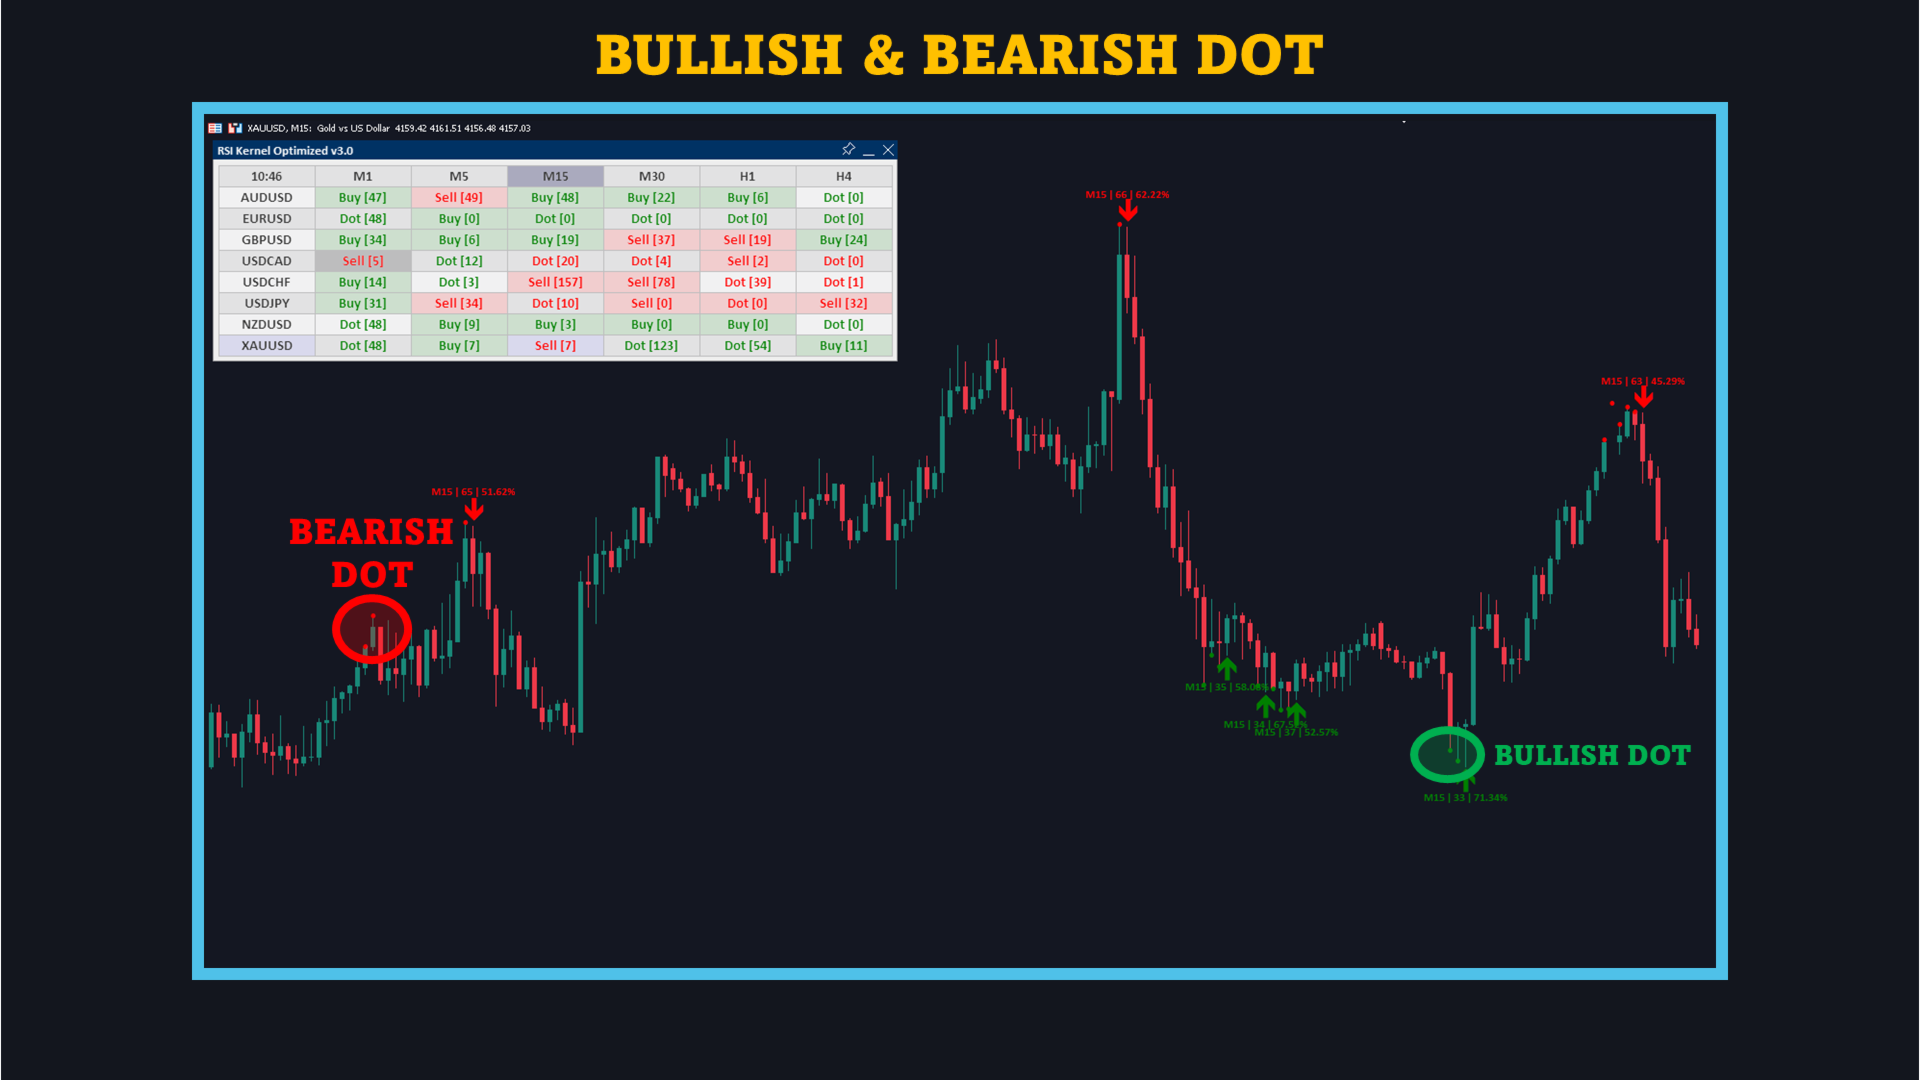
- Bullish and bearish dots showing when the corresponding KDE condition is active.
- Buy and Sell arrows marking a defined transition from an active condition back to neutral.
- Sum and Nearest modes for two ways of evaluating the KDE distributions.
- Independent minimum KDE score filters for Buy and Sell arrows.
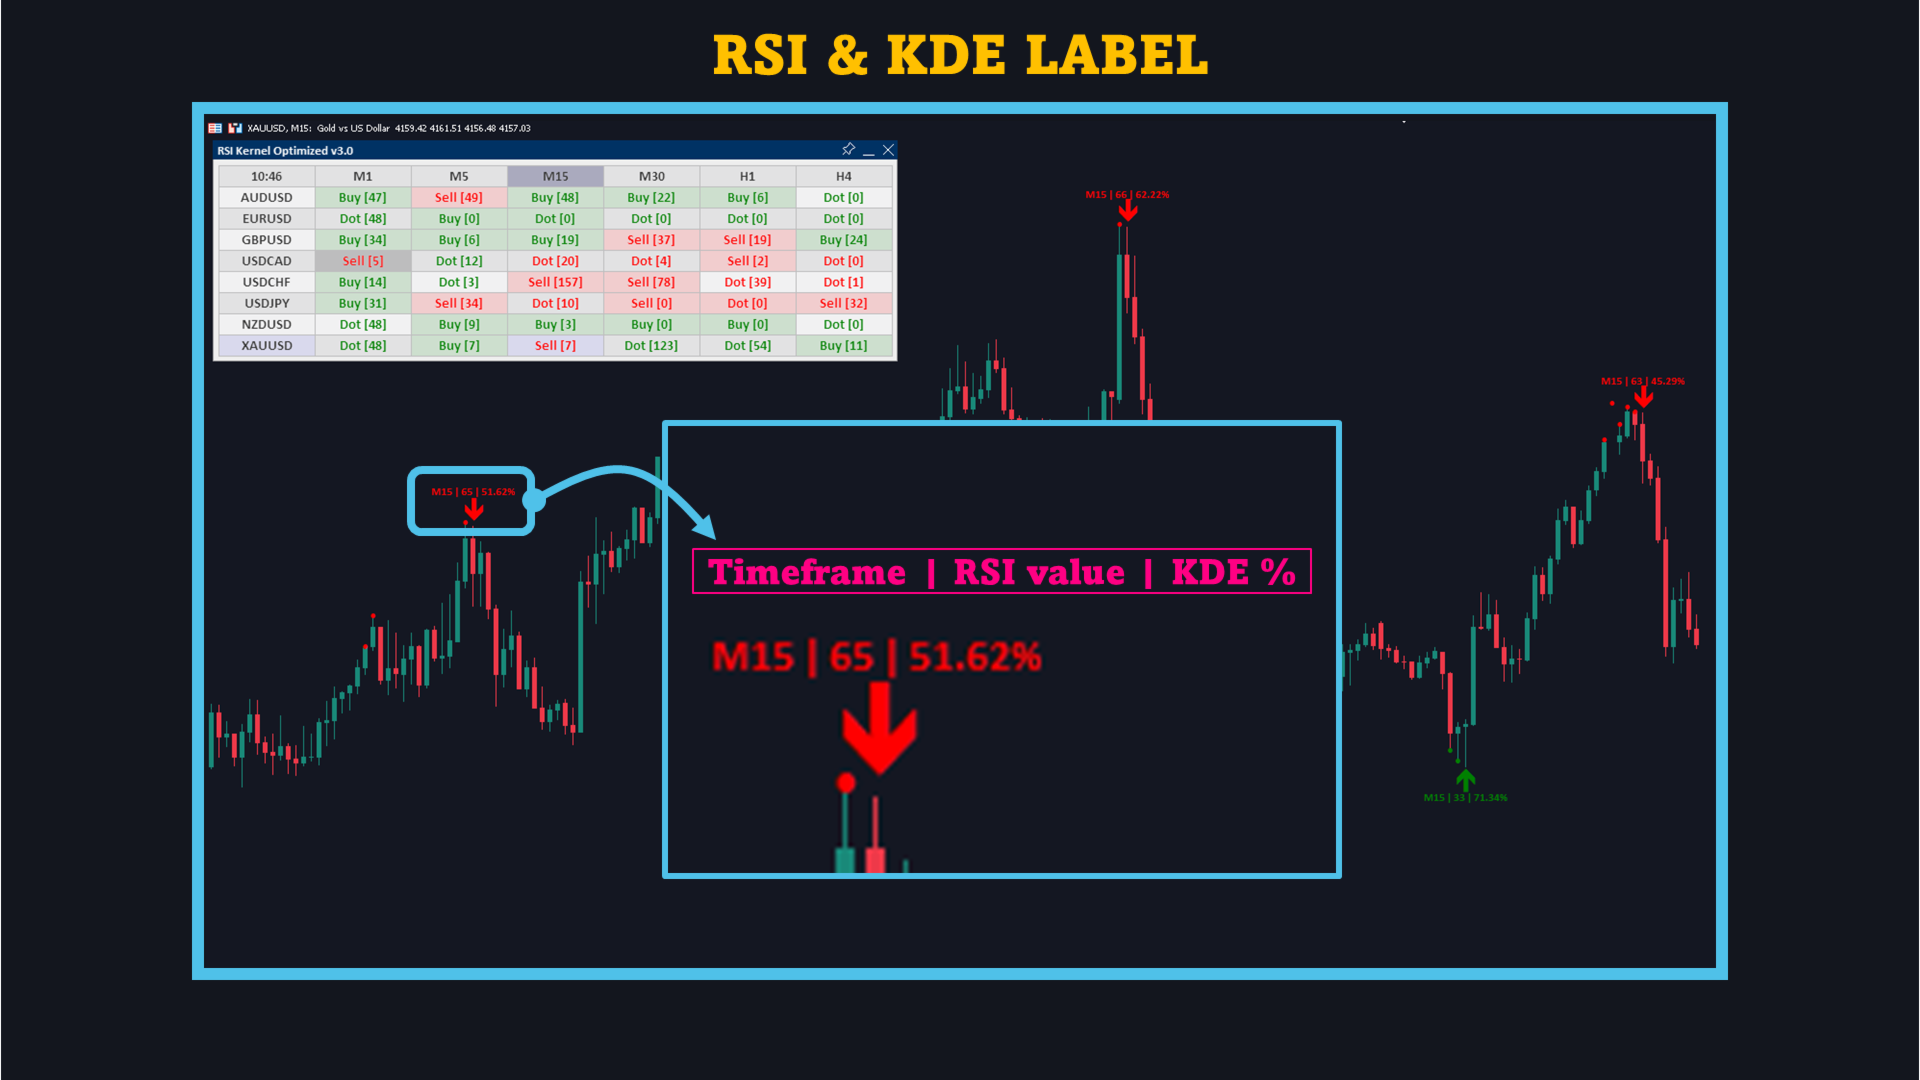
- Optional signal labels showing RSI and KDE score, plus an optional current-value chart label.
- Multi-timeframe display, separate settings by timeframe, a multi-symbol Scanner, and configurable alerts.
How the indicator works
1. RSI samples from confirmed price pivots
When price forms a pivot high or pivot low and the required confirmation bars have appeared, the indicator records the RSI value at the pivot candle. It keeps readings from pivot highs separate from readings from pivot lows. The left and right pivot settings determine which local highs and lows qualify and when they become available to the calculation.
2. Two KDE distributions
Kernel density estimation turns each group of RSI readings into a smooth distribution. This shows how the recorded values are concentrated across the RSI range, rather than treating every pivot observation as an isolated point. As new pivots are confirmed, the corresponding sample group and distribution are updated.
3. Evaluating the current RSI
The current RSI is compared with both distributions on every bar. The low-pivot distribution is used for the bullish condition; the high-pivot distribution is used for the bearish condition.
- Sum: evaluates accumulated KDE values on the relevant side of the current RSI. It uses the upper side of the low-pivot distribution for the bullish condition and the lower side of the high-pivot distribution for the bearish condition.
- Nearest: evaluates the KDE value near the current RSI relative to the peak of the corresponding distribution.
The Activation Threshold determines when the selected comparison counts as an active condition. The High setting accepts a broader activation region than Low; Custom allows a user-defined threshold.
4. Dots and arrows describe different stages
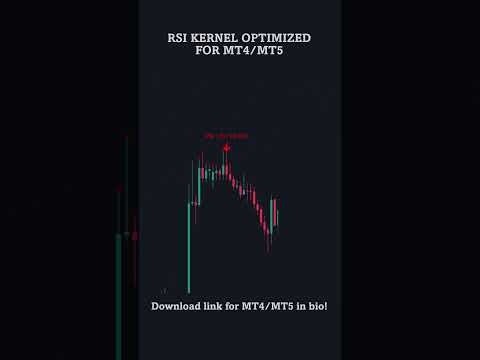
A green dot is plotted while the bullish KDE condition is active. A red dot is plotted while the bearish condition is active. Consecutive dots can therefore represent one condition continuing across multiple bars.
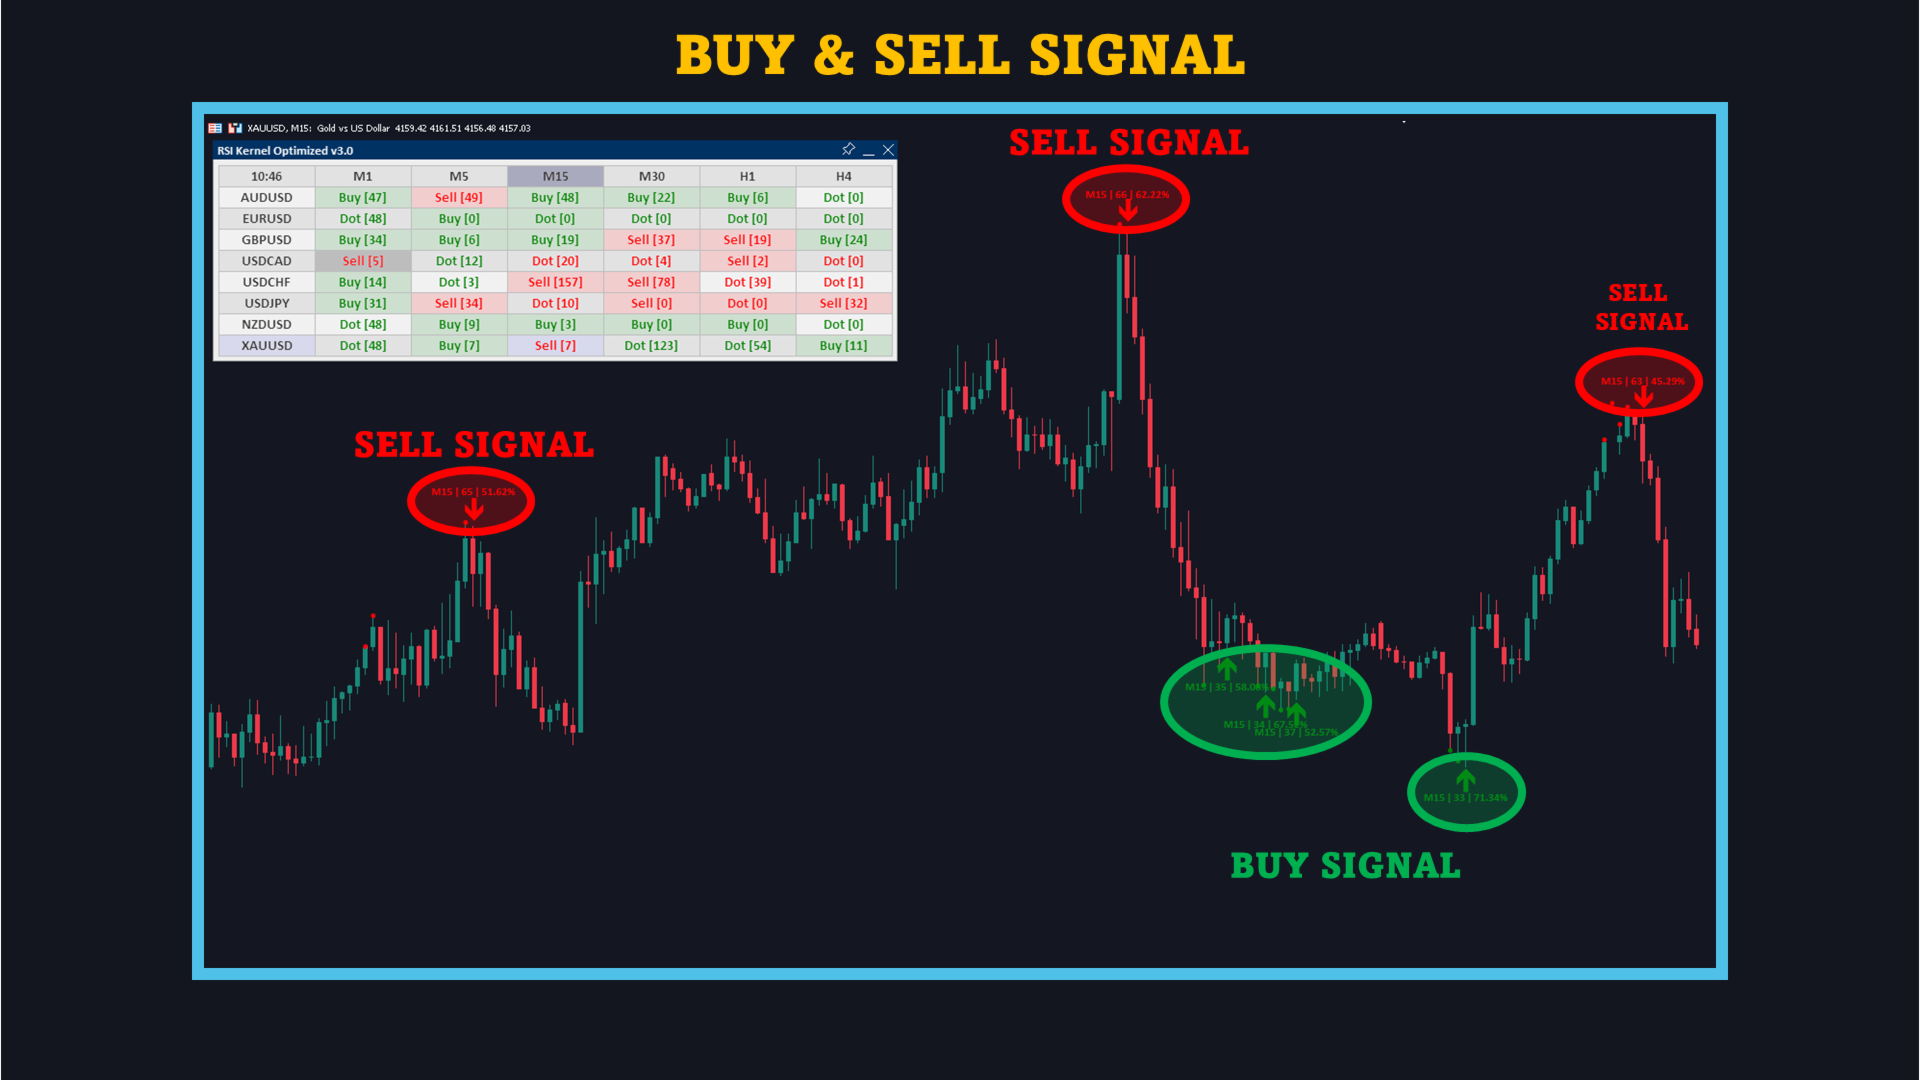
Arrows identify the transition out of an active condition. A Buy arrow can appear when the previous bar had an active bullish condition and the current bar has returned to neutral. A Sell arrow can appear after the corresponding bearish-to-neutral transition. The current bar must also meet the minimum KDE score selected for that arrow.
Reading the chart: dots show an active condition; arrows show its return to neutral. A direct change from one active condition to the other does not meet the neutral-state rule for an arrow. The minimum Buy/Sell score filters affect arrows without removing the underlying dots.
Using the signals
Begin by watching where green or red dots appear. When a sequence of dots ends, check whether a Buy or Sell arrow is shown. With signal labels enabled, you can read the RSI value and KDE score on the signal bar, then compare the event with price structure and your own entry and risk rules.
The KDE score is displayed on a 0-100 scale. In Sum mode, it is calculated relative to the sampled KDE total; in Nearest mode, relative to the KDE peak. This is a measure of the indicator's current KDE calculation, not the probability that a trade will succeed. Because the two modes calculate scores differently, review the minimum score filters when changing modes.
For an initial review, leave the minimum Buy and Sell scores at 0 so you can see how dots and arrows relate. Increasing these settings can remove arrows while leaving dots visible. A restrictive value may leave few or no arrows because the score filter is checked on the bar where the active condition has ended.
Main settings
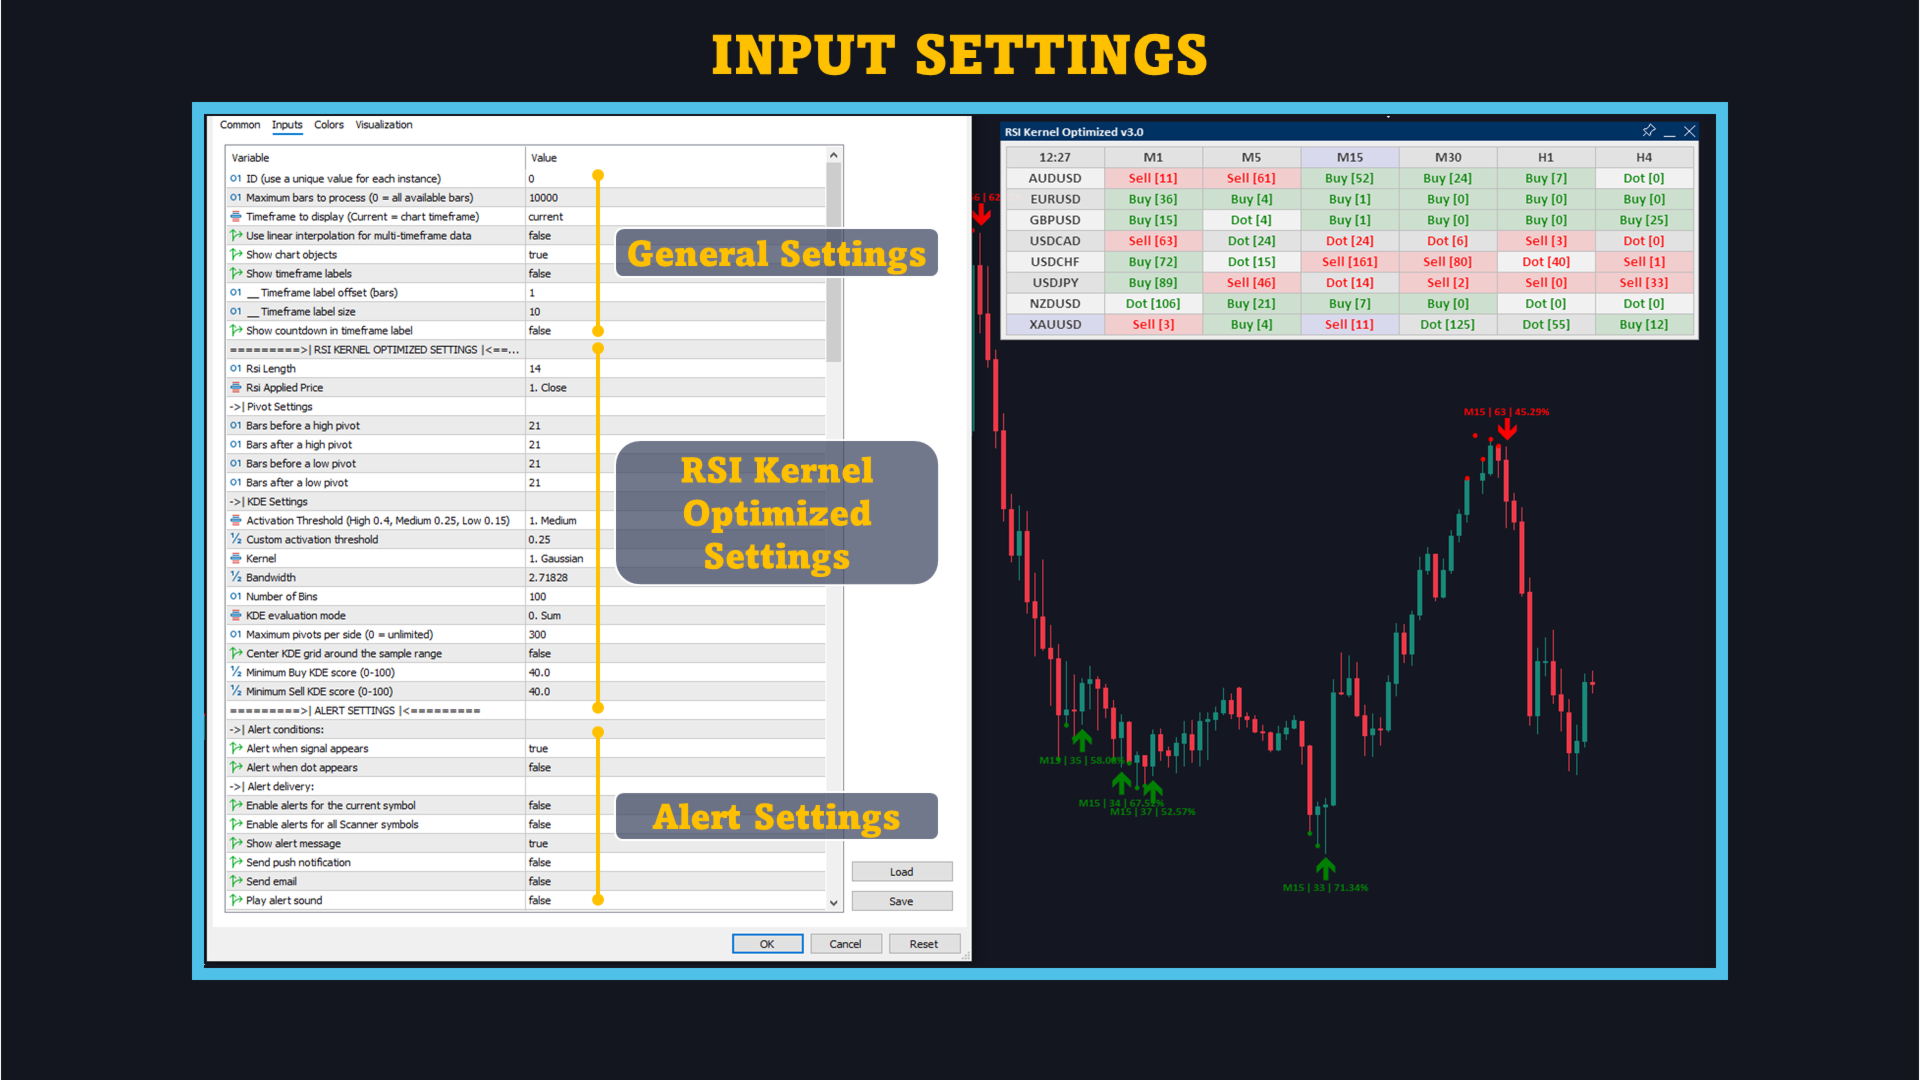
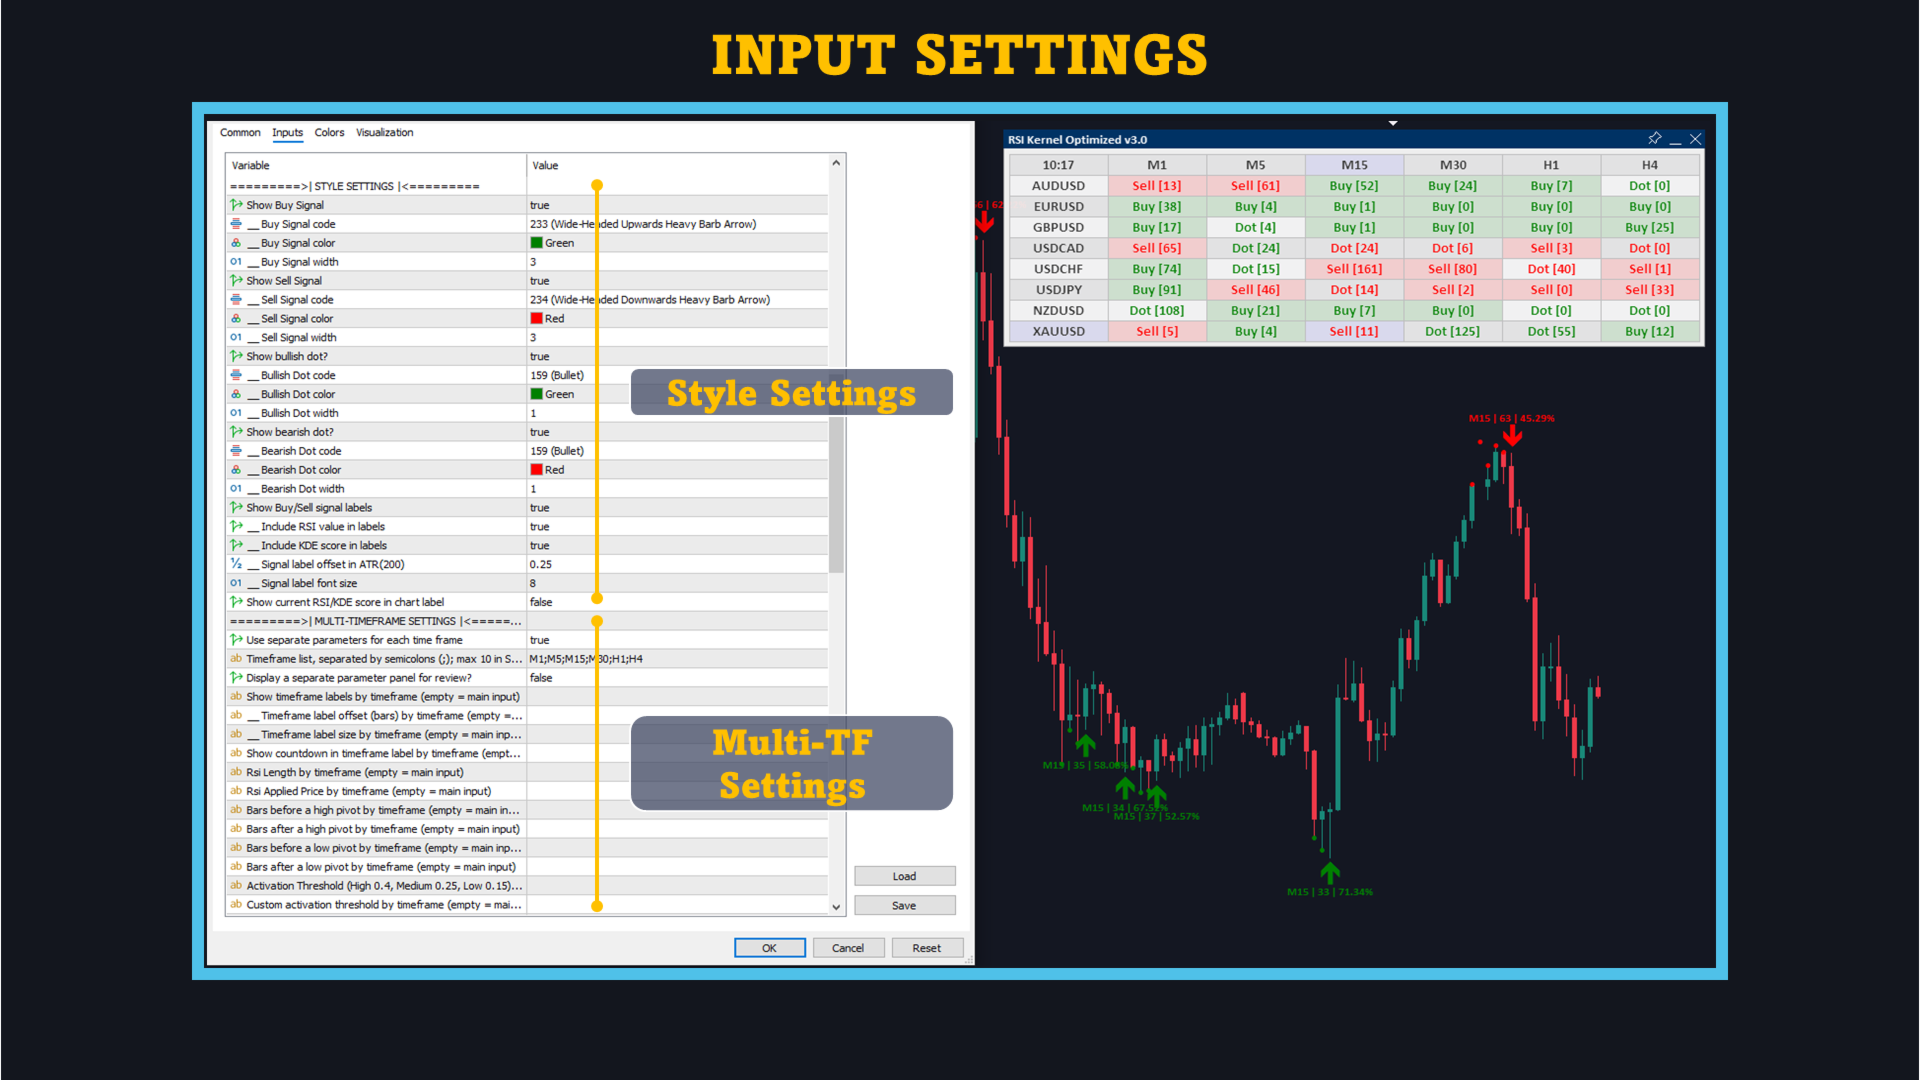
- RSI: set the calculation period and applied price.
- Pivot Settings: set the bars before and after a price pivot used to identify and confirm local highs and lows.
- KDE Settings: choose the kernel, bandwidth, number of bins, evaluation mode, and activation threshold.
- Signal filters: set independent minimum KDE scores for Buy and Sell arrows.
- Pivot history: limit the number of samples kept for each side. Setting the limit to 0 retains all available pivots and may increase processing time on long histories.
- Display and alerts: adjust arrows, dots, labels, and the available message, push, email, and sound alerts.
A pivot enters the calculation only after its configured confirmation bars have formed. Values and signals on a bar that is still forming can change; signal alerts are checked on the last completed bar.
Multi-timeframe and Scanner
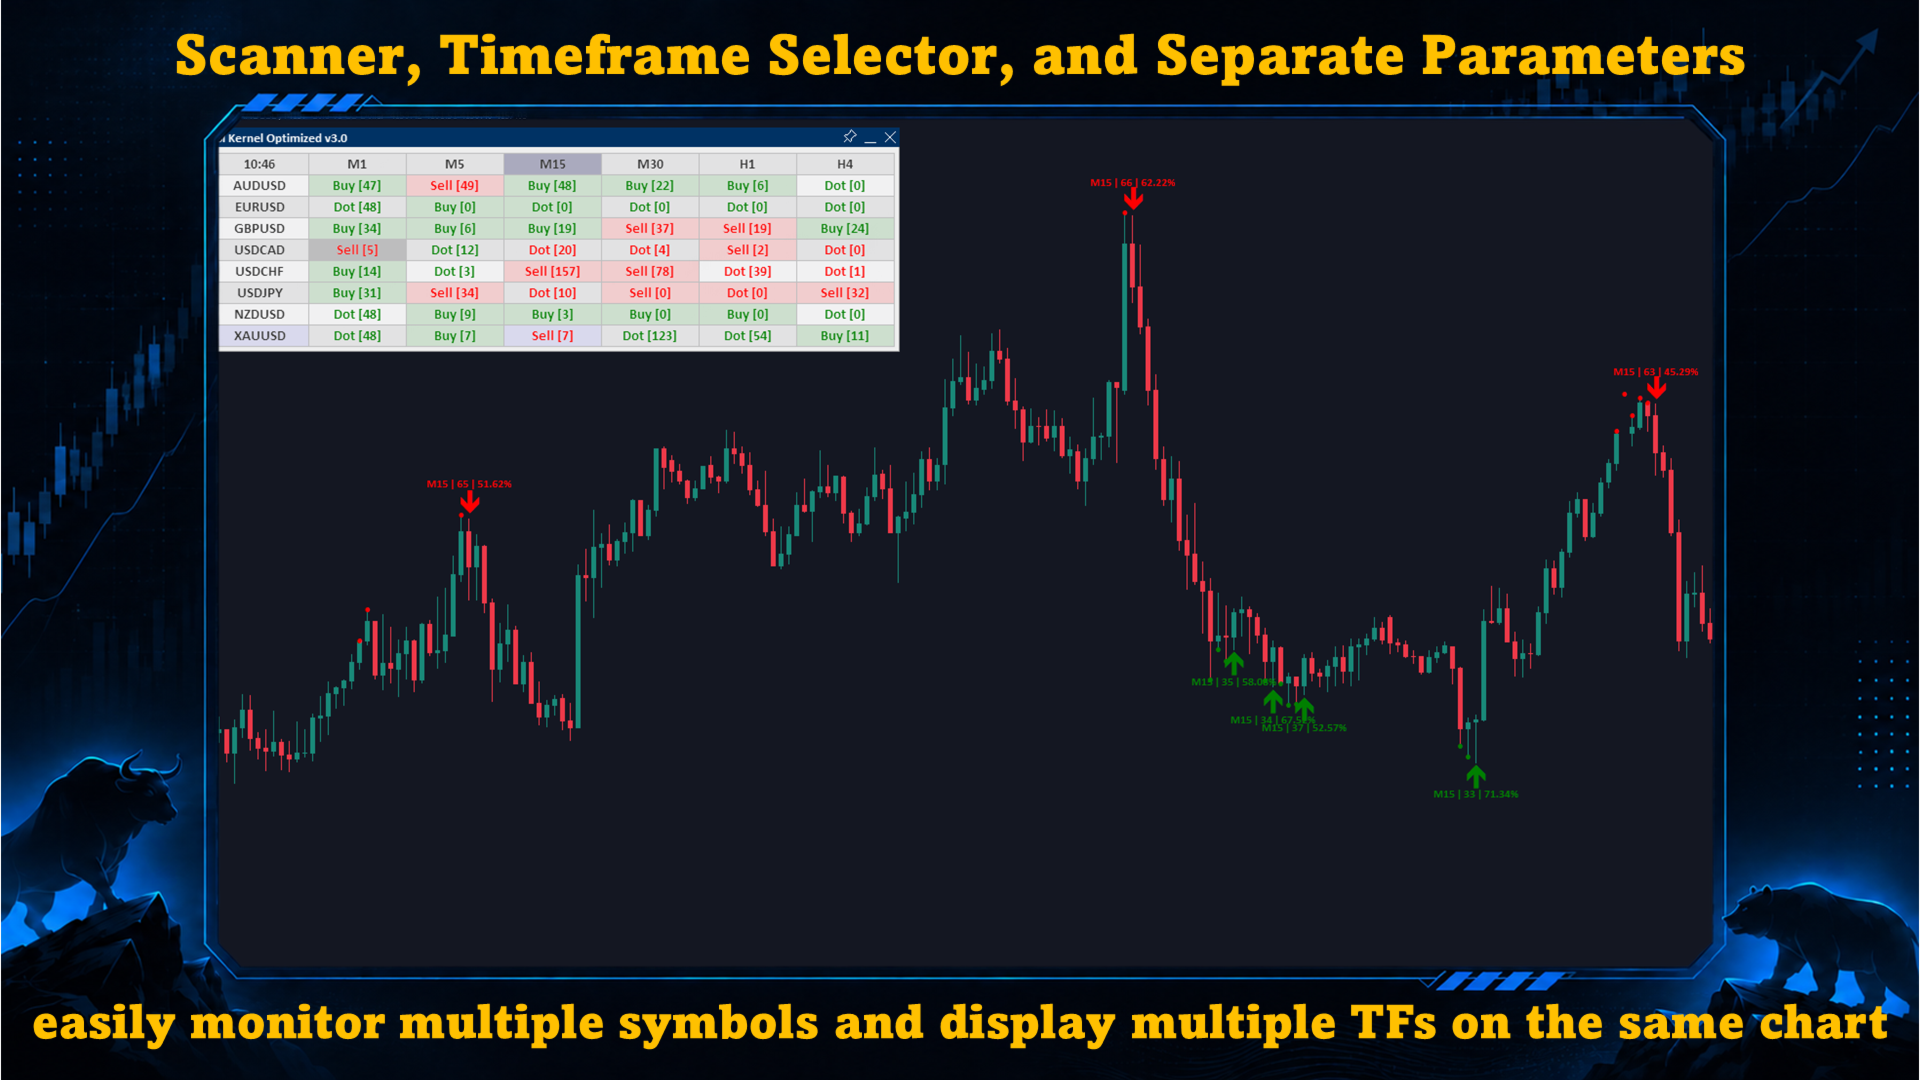
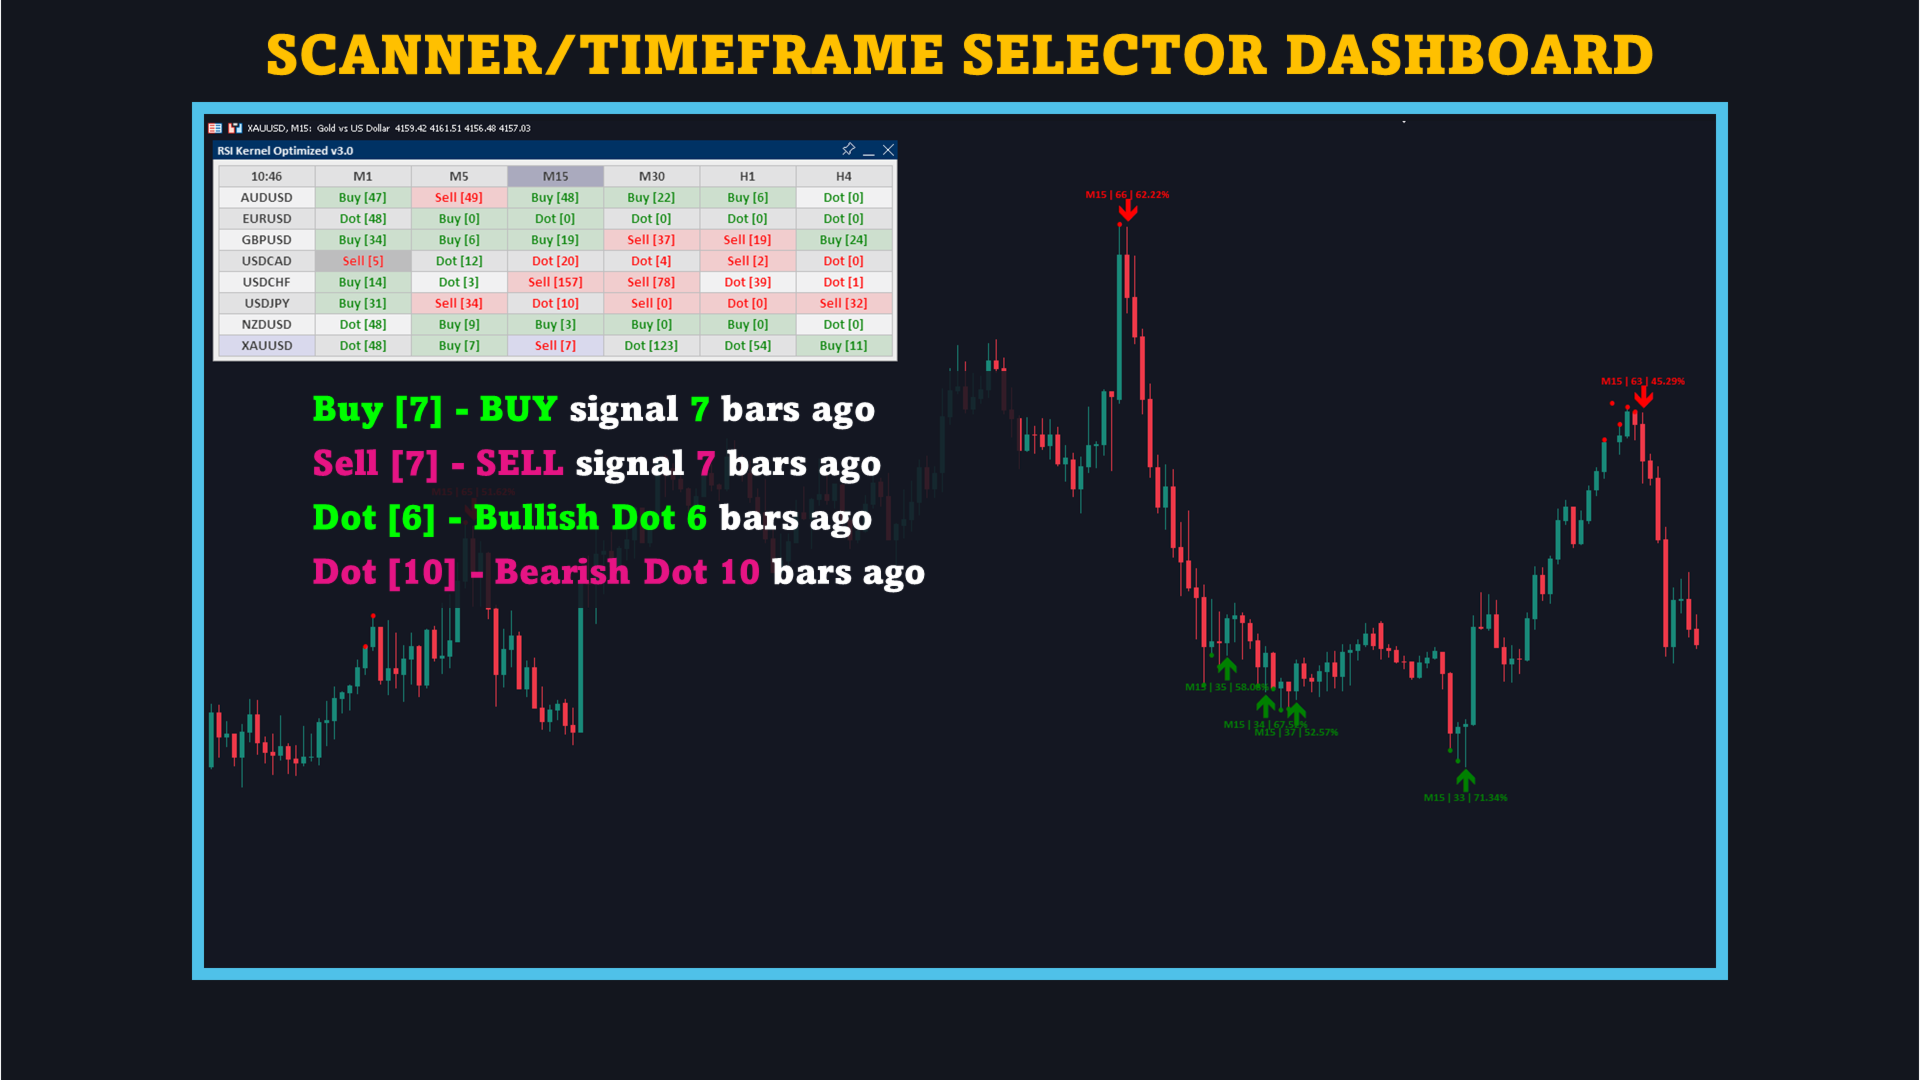
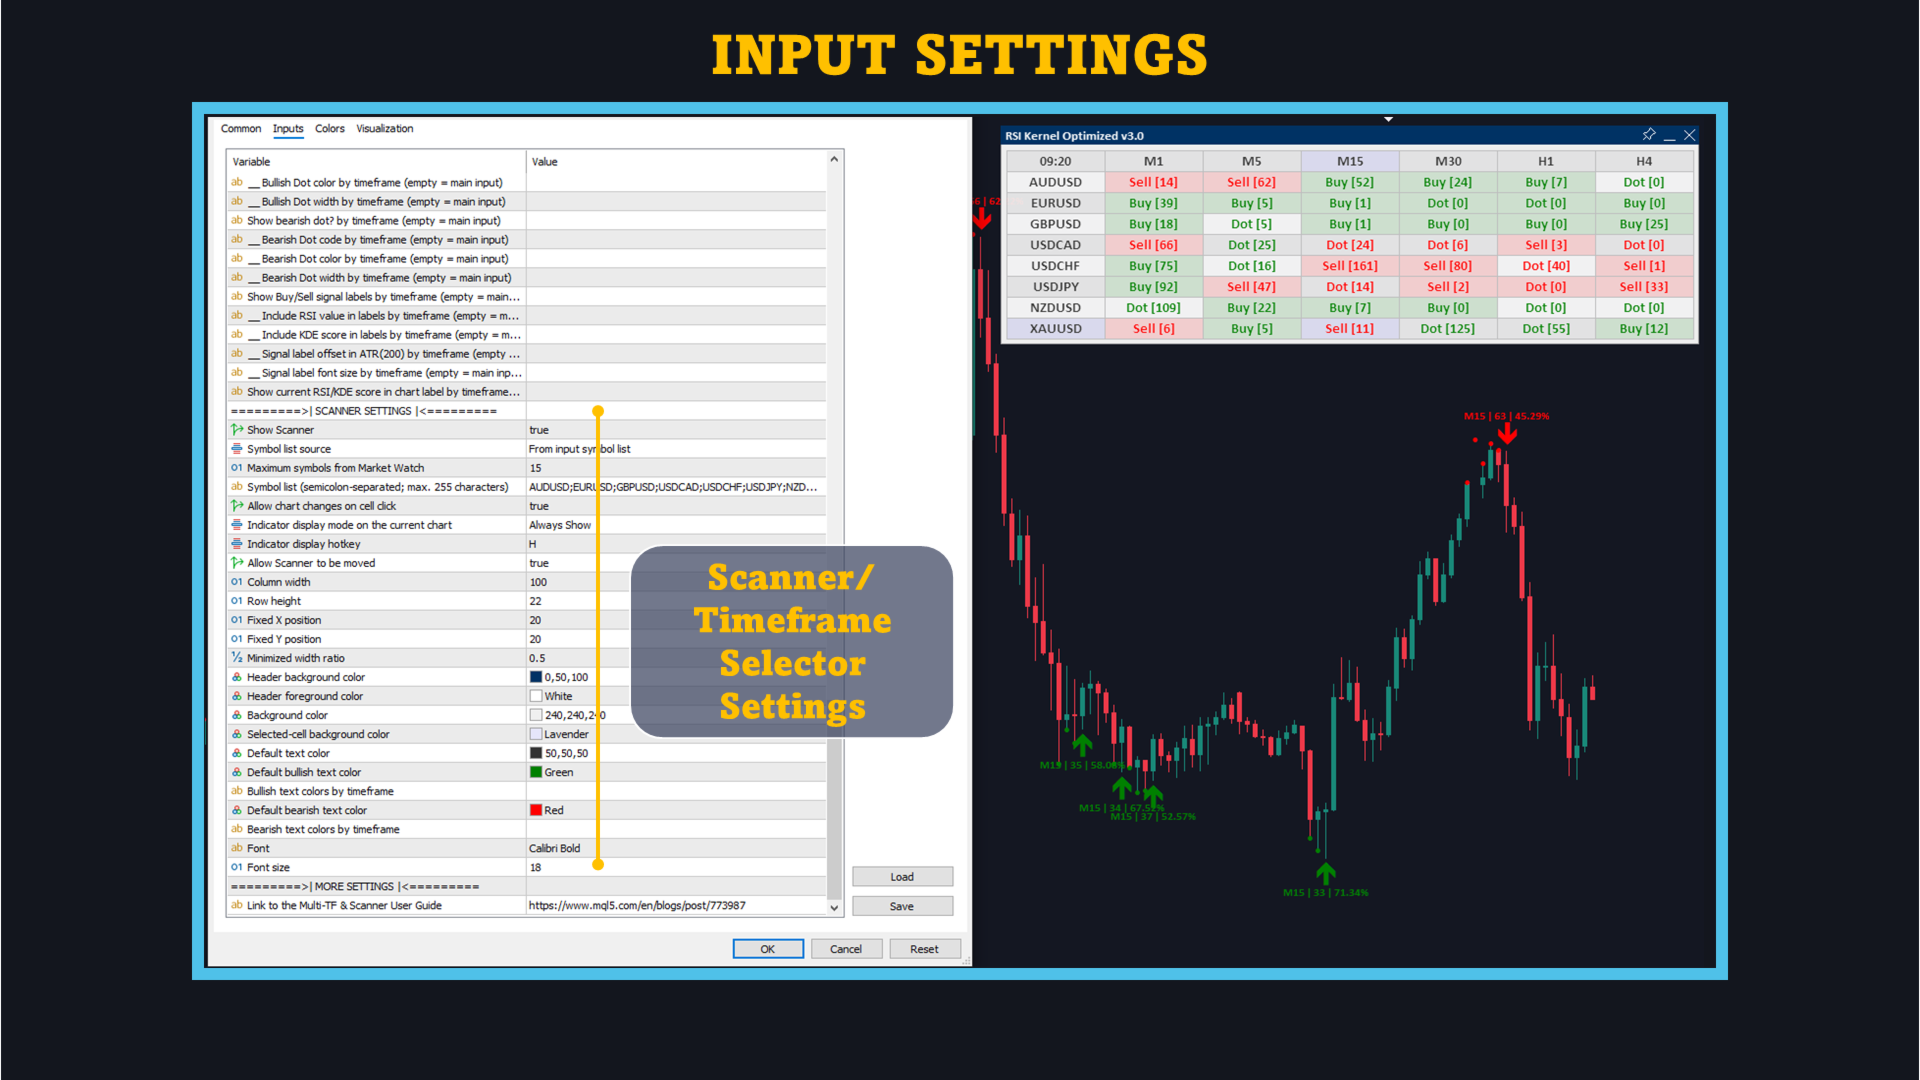
Select another timeframe to view its indicator information on the current chart. Separate Parameters allow different timeframes to use their own calculation, display, and alert settings. The Scanner brings configured symbols and timeframes into one panel so you can review where conditions and signals appear before opening a chart for closer analysis.
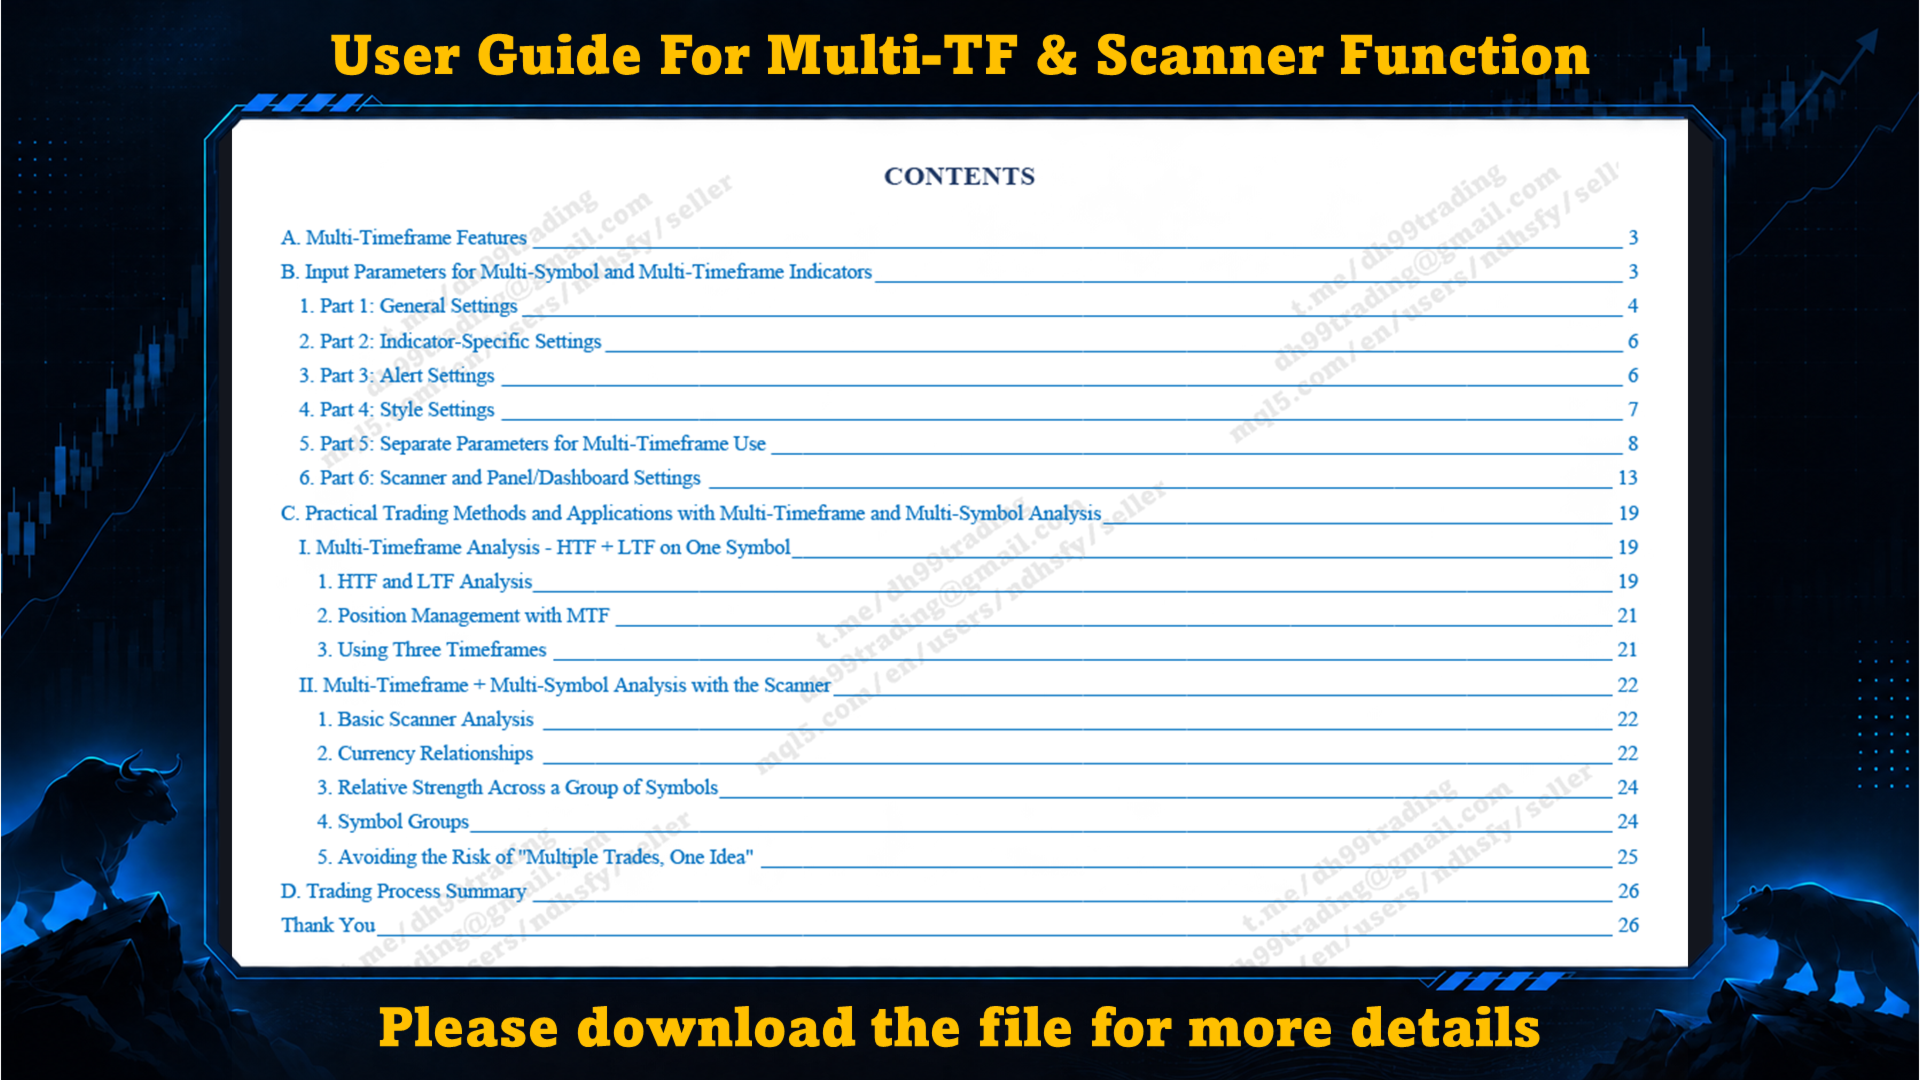
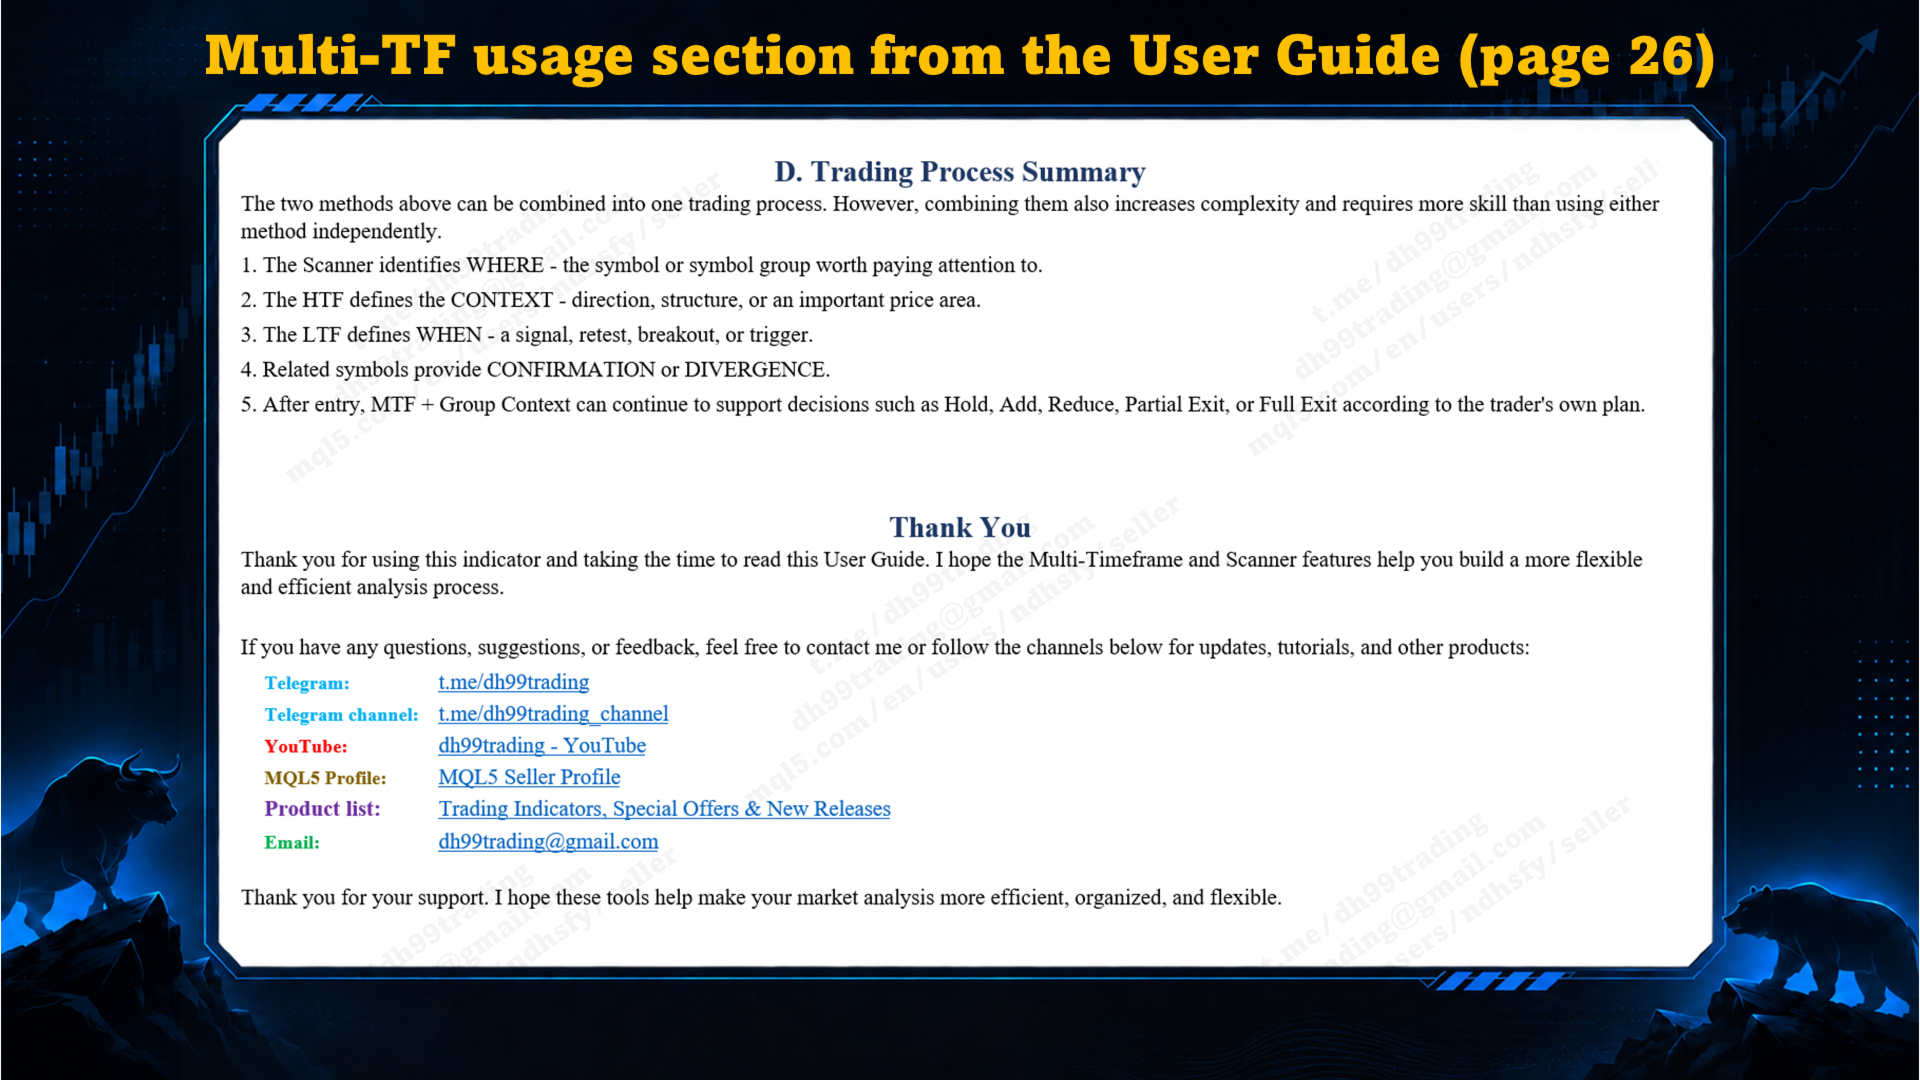
For instructions on timeframe selection, Separate Parameters, symbol lists, and Scanner controls, read the Multi-Timeframe & Scanner User Guide.
RSI Kernel Optimized provides chart conditions and signals for analysis. Entry, exit, and risk-management decisions remain part of your own trading method.

























































Simple easy to use indicator. Great product.