 MetaTrader 5
 Experts
 Indicators
 Libraries
 Utilities
 Widgets
 Rules
Rules
Watch the Market tutorial videos on YouTube
How to buy а trading robot or an indicator
Run your EA on
virtual hosting
virtual hosting
Test аn indicator/trading robot before buying
Want to earn in the Market?
How to present a product for a sell-through
New Expert Advisors and Indicators for MetaTrader 5 - 520
 Use trading robots and indicators to make Forex trading more profitable. Trading robots allow you to automate opening and closing deals, while indicators help you predict market behavior more accurately.
The page features the catalog of MetaTrader 5 applications.
Use trading robots and indicators to make Forex trading more profitable. Trading robots allow you to automate opening and closing deals, while indicators help you predict market behavior more accurately.
The page features the catalog of MetaTrader 5 applications. 
The VR Orders History script is designed to upload a trade report to a csv file. This format is intended for additional analysis of trading history in programs such as EXCEL, Openoffice, and Libreoffice. Thanks to the script, it is now much easier for a trader to analyze their trading history. The program facilitates the analysis of the trading history for the MetaTrader 5 terminal. The trader sees structured trading. The entire report is based on the following principle: Position > Order on the
FREE

Breakthrough Solution For Trend Trading And Filtering With All Important Features Built Inside One Tool! Trend PRO's smart algorithm detects the trend, filters out market noise and gives entry signals with exit levels. The new features with enhanced rules for statistical calculation improved the overall performance of this indicator.
Important Information Revealed Maximize the potential of Trend Pro, please visit www.mql5.com/en/blogs/post/713938
The Powerful Expert Advisor Version
Automatin
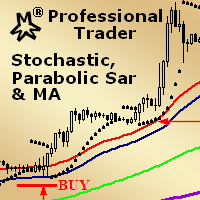
MMM Stochastic, PSAR & MA: This EA's strategy is a combination of two indicators types (Oscillator and Trend) and a Moving Average which helps to enhance the price trends signals and decide to open a new order at the right time. There is an Stochastic (Oscillator) indicator, a Parabolic SAR (Trend) indicator and a Moving Average that you may tune by using the strategy tester optimization to help you to find the best input values that will give you the best results ; It is highly recommended for
In today’s market, an objective counter trend technique might be a trader’s most valuable asset. Most of the traders in the financial market must be familiar with the name "TD Sequential" and "Range Exhaustion". The Sequential R is a Counter-Trend Trading with Simple Range Exhaustion System. Sequential R is useful to identify trend exhaustion points and keep you one step ahead of the trend-following crowd. The "Sequential R" is designed to recognize profitable counter trend patterns from your ch

This tool allows you to better analyze your chart. With "Crosshair Percent", you can calculate distances in the chart in a percentage way (in a very simple way, when the pointer is attached in the form of a crosshair: CRTL + F). The utility allows to measure and/or calculate the movements of the price NOT only in points, use a measure in professional terms as it is the percentage. The result is shown in two parts of the screen, one of them, next to the position of the pointer and the other in a

All traders face to a serious question: How to estimate trading strategy performance and control risk in real-time? Eventhough use backtest and optimizing in strategy tester, but unfortunately, trader need to deal with the curse of curve-fitting, because optimized result is just for the specific set of historical data that was tested. This indicator retrieves deal information from historical data then draws balance and equity curve of account and calculate drawdown in REAL-TIME. It helps trader
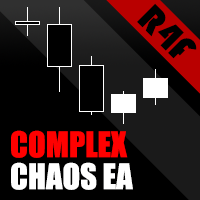
The Complex Chaos EA is an automated system that uses a pair of exponential moving averages to detect the market direction and opens trades on candle open. If the market moves against a trade it will at a set distance open another trade in the same direction to move the take profit of the group of open positions closer to the current price and make the group of trades winners overall once the price reverses. If a change in direction is detected then all trades are closed and it starts trading in
FREE

The Bollinger R (Bollinger Reversals) is designed to recognize short term high profitable counter trend patterns from the chart. This system combines both Bollinger Bands and mean reversion to define positions where the market could potentially reverse direction. This is the MT5 version of Bollinger R Description Bollinger Bands are well known in the trading community. I have added the concepts mean reversion and "distance between Price and a Moving Average" to help confirm and trade the “bounce
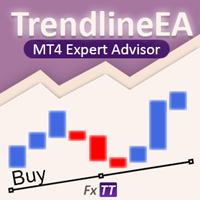
Trendline EA MT5 Trendline EA MT5 is a semi-automated Expert Advisor for MetaTrader 5 designed to execute trading actions or alerts based on trendlines drawn by the user. MetaTrader 5 does not provide native functionality to place or manage trades directly from trendlines. This Expert Advisor extends standard platform behavior by monitoring user-defined trendlines and executing predefined actions when price interacts with them. The Expert Advisor does not define or apply any trading strategy. Al

Hull Moving Average (HMA) is well-deservedly popular among traders because of the effective averaging of market noise and a relatively small delay. The current MetaTrader 5 version changes its color when the movement direction changes. Sound and text signals are available. It also supports sending email and push messages. It is possible to trigger a signal on the current incomplete bar, although such a signal may be canceled before completion if conditions are no longer appropriate. One of the p
FREE

This long-term trading system works on 9 pairs and timeframe. The Expert Advisor uses various trading systems, such as trend trading, counter-trend trading and others. The EA has the built-in smart adaptive profit taking filter. The robot has been optimized for each currency and timeframe simultaneously. EA uses economic news. No martingale, grid and other risky strategies. EA uses timeframes:
MetaTrader 4 MetaTrader 5 M5, M15, M30, H1 M2, M3, M4, M5, M6, M10, M12 , M15, M20, M3

The BuySellArrows is an indicator without any input parameters. This makes it an easy-to-use trend trading indicator for beginners, advanced and professional traders. The main purpose of this indicator is to detect and mark (with arrows) a local trend, which is one of the most important problem for a trader regardless of their trading style. The main coding algorithm inside the indicator is calculating the speed and direction of the price change. This indicator will show Buy (color Aqua) or Sell

Monitoring : https://www.mql5.com/en/signals/author/yarkan
Features no use of any indicators Uses averaging with an increased lot Open prices only (an EA that explicitly controls bar opening) Trades Buy and Sell independently. In the EA parameters, you can set Buy, Sell or BuySell (for Hedge accounts) Displays the trade information in the top left corner of the chart
Recommendations Timeframe: M1 Leverage 1:500 Rebate to refund part of spread or commission
Parameters Pairs - setting the pairs
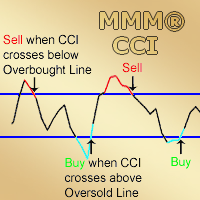
MMM Commodity Channel Index Strategy: The robot uses its two built-in improved and tested CCI indicators to determine the prices trends and calculates the signal for buying or selling. It sends an order, closes or moves the Trailing Stop loss position as the indicator works. Perfect for scalping. It will not send an order unless the calculations determine a good trend of profit. Like all MMM products, it is also programmed to minimize your losses and protect your money from the hostile market. W
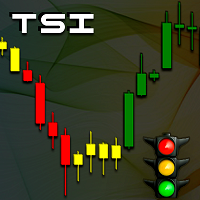
TSI - Trend Semaphore Indicator
Work tool developed to display the force of movement. This tool was developed for Trend Following strategies. Recommended for all types of traders. Can be used in any instrument and market. Can be used in any period of time. Trend indication using multicolored candles.
New trend A new trend is signaled by the changing colors on the chart's candles. The indicator indicates the upward trend with the green color, the downward trend by the red color and weak movement
Displays multiple indicators, across multiple timeframes and symbols to give a comprehensive overview of the market. Uniquely, the indicators are configurable and can include custom indicators, even those where you just have the ex4 file or those purchased from Market. Standard indicators can also be selected, the default being ADX, CCI, market price above/below Moving Average (MA), Moving Average Cross (MAX), MACD, Momentum (MOM), OsMA, RSI, Parabolic SAR, William's Percentage Range (WPR). Use
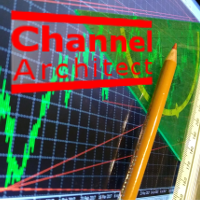
This indicator calculates and draws lines over the chart. There are two types of channels: Channel A: the mainline is drawn using local lows for uptrends and local highs for downtrends Channel B: the mainline is drawn using local highs for uptrends and local lows for downtrends The parallel lines of both types are built using the max. fractal between the base points of the mainline. There are a few conditions, which have to be fullfilled and can be changed by the parameters (see also picture 4):
When using CCI (Commodity Channel Index) oscillator, the waiting time till the next signal can be long enough depending on a timeframe. CCI Alerts indicator prevents you from missing the indicator signals. It is a good alternative for the standard CCI indicator. Once there appears a CCI signal on the required level, the indicator will notify you with a sound or push, so you will never miss an entry. This is especially significant if you follow the indicator in different timeframes and currency p

Operation principles For the Expert Advisor operation, it is necessary to configure three parameters in accordance with recommendations. The EA works on any timeframe and symbol. The EA analyzes the movement of price beyond a set formed price range, the movement speed and the trend. A position is opened when necessary conditions occur.
Parameters Сurrency pair . Recommended values for symbols: five-digit EURUSD in the format 1.00001 – 1, four-digit EURUSD in the format 1.0001 – 2; five-digit GB

Crypto Charts is a Service that connects to cryptocurrency exchanges and delivers three types of market data in a single package: historical and live OHLCV candles, real-time tick data, and Depth of Market (order book). All data is pushed into MT5 as custom symbols that behave like native instruments, accessible on charts, in indicators, Expert Advisors, and the Strategy Tester. Traders who prefer MT5's analysis environment can use Crypto Charts to work with cryptocurrency markets using the same

Renko Expert Advisor based on Renko bar simulation. The EA has two options for building Renko bars. Classic and ATR. In the classic version, renko bars are marked with areas on the main chart; in the ATR version, renko bars are modeled and drawn in the indicator window. Modeling renko bars inside the EA allows you to optimize the robot better than drawing renko bars offline. Renko EDGE EA Set file Golden Delta | Algo Trading Research
Updates, research and new developments:
https://www.mql5
FREE

Salva EA is an advanced and fully automated system. The basis of this strategy is the price chart itself, the trade is conducted from the price movement range.
Benefits This is not martingale, not arbitration Ready for operation without PreSetting Always use a stop loss and take profit to save your investments Easy to use (does not have complex settings) The results of the tester converge with the results on a real account High speed testing (can be optimized for 1 minute OHLC) Salva EA works b
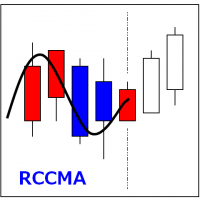
RCCMA is a general moving average indicator that works with ReviewCandleChart. Original is "Custom Moving Average" provided by MetaQuotes Software Corp. Based on that source code, I corresponded to ReviewCandleChart .
Advantages When ReviewCandleChart is ON, no line will be displayed on the right side from the vertical reference line. When ReviewCandleChart is ON and you press a key such as "Z" or "X" Following that, the MA is drawn. When ReviewCandleChart is OFF, the same drawing as the origin
FREE

This Expert Advisor is designed for use on all currency pairs on any timeframes. Candlestick analysis from different timeframes is used for opening positions. Positions are closed using the automated trailing system or by an opposite signal. The EA does not have input parameters affecting the trading algorithm. Timeframe: any (candlesticks from M15 to H4 are used) Currency pair: any (it is recommended to simultaneously use at least 4 major currency pairs).
Parameters LotSize - lot value paramet

The EA waits for a spike according to a specific logic and opens a position in spike direction setting stop loss and take profit. When positions are in profit they are managed with smart trailing mechanism based also on elapsed time from opened position. It works with 5-digit and 4-digit broker. Must be used M1 chart. It does not use : Martingale. Grid. Hedge.
Parameters spikeFilter - value to decide opening positions takeProfit - take profit in points stopLoss - stop loss in points firstTrailS

The Expert Advisor has been created for trading on accounts with the deposit of more than $1,000. Uses M1 timeframe. Simultaneously on the recommended pairs: EURUSD, USDJPY, GBPUSD, USDCHF, AUDUSD, USDCAD, NZDUSD, EURAUD, CHFJPY, EURGBP, EURJPY, GBPJPY. Check if your broker supports hedging, since the EA uses hedging based on MACD and RSI. The Expert Advisor enters a position based on MACD and RSI signals. If the price goes in the opposite direction, the EA will open a hedging order and will clo
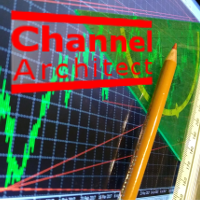
This utility calculates and draws lines over the chart. There are two types of channels: Channel A: the mainline is drawn using local lows for uptrends and local highs for downtrends Channel B: the mainline is drawn using local highs for uptrends and local lows for downtrends The parallel lines of both types are built using the max. fractal between the base points of the mainline. There are a few conditions, which have to be fullfilled and can be changed by the parameters (see also picture 3):
t
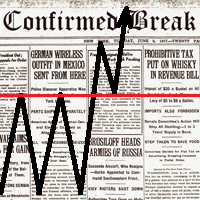
The indicator displays the key support and resistance levels on the chart. The significance of these levels lies in that the price may reverse or strengthen the movement when passing such levels, since they are formed as a consequence of the natural reaction of market participants to the price movement, depending on which positions they occupied or did not have time to occupy. The psychology of the level occurrence: there always those who bought, sold, hesitated to enter or exited early. If the
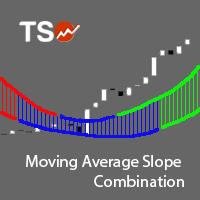
The Moving Average Slope (MAS) is calculated by detecting the moving average level n-periods ago and comparing it with the current moving average level. This way, the trend of the moving average can be drawn on the moving average line. This indicator allows to compare the slopes of two moving averages (fast and slow) to cancel out noise and provide better quality entry and exit signals SCANNER is included . Now with Scanner you can find trading opportunities and setups easily and faster.
Featur

The indicator measures the frequency of incoming ticks to analyze the market activity. Bullish and bearish ticks are analyzed separately, informing about the currently predominant market sentiment. According to observations, an increase in the frequency of ticks (panic) indicates the beginning of strong price changes, and an increase in the frequency of ticks in a particular direction not only accompanies a price change in this direction, but also often anticipates it. The indicator is indispens

The indicator shows the trend of 3 timeframes: higher timeframe; medium timeframe; smaller (current) timeframe, where the indicator is running. The indicator should be launched on a chart with a timeframe smaller than the higher and medium ones. The idea is to use the trend strength when opening positions. Combination of 3 timeframes (smaller, medium, higher) allows the trend to be followed at all levels of the instrument. The higher timeframes are used for calculations. Therefore, sudden change

The utility is designed to change the symbol of the current, all or selected charts, change the timeframe , as well as to synchronously move through the history of all charts (automatically or by clicking the button). The list of symbols is read from the "Market Watch" or is set manually. The color, size and position of the buttons are customizable. Synchronization of charts occurs according to the time of the first visible bar when you press the "SYNC" button or when moving the mouse/

This indicator is a multitimeframe trading strategy. It has the levels for stop loss, take profit and entry point. The order level can also be set manually. The indicator uses the regularity of the market, which manifests itself on all instruments, and does not require adjustment of the parameters. The strategy uses a proprietary approach to determining: trend, volatility, hierarchy of timeframe significance, the size of the history period (the number of candles), which is important for making a
A comprehensive tool for determining the levels of support, resistance, reversals in relation to trading sessions. The indicator's thesis can be expressed as follows: "Support and resistance levels are undoubtedly formed by the psychological barriers of market participants, and influence the further behavior of the price. But these barriers are different for different groups of traders ( One man's meat is another man's poison ) and can be grouped by territory or by the trading time ". Follo
FREE

Indicator of Stowell's Three-Bar Net Line. In this indicator, the number of bars used for determining the lines can be defined in the settings. With the default settings, the indicator draws arrows in the areas of the line breakout. The lines are not displayed on the chart by default. but can be enabled.
Parameters Alerts - enable alerts when arrows appear. Arrows appear on a forming bar and can disappear during bar formation. Therefore, it is recommended to wait for the bar with the arrow to c
FREE
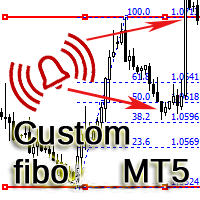
The indicator is designed for building horizontal channels and signal zones, detecting breakouts of extremes, bounces and targets based on custom Fibonacci levels (with or without sound alerts). It automatically applies your chosen Fibonacci levels to those extremes. When price breaks the Fibonacci levels enabled in the settings, the indicator can play a sound, show a message, send a push notification to your mobile terminal or an email (if enabled). Features:
automatic channel building by time

Reversal Expert is a fully automatic Forex Expert Advisor. For several years, the robot enters on reversal signals to make quick profits. When the target is not reached, the position is slowly increased until it becomes profitable (see screenshots below). Best results are observed on GBPUSD, USDCAD, EURGBP and AUDUSD on the M15 timeframe.
Advantages Tunable risk. Can work on several Forex pairs in the same account. Large user base since 2013. Lot size automatically adapted to your balance. Reac

The utility allows you to manually test your strategies in the strategy tester. One-click trading on the visualization chart.
Convenient and complete functionality for testing trading skills is now available in the strategy tester as well. Forex Tester Pad is a trading simulator for strategy tester. Trading using indicators. The main functions of our utility MT4 version
Full Description +DEMO +PDF How To Buy
How To Install
How to get Log Files How To Test and Optimize
FREE

The indicator measures the frequency of incoming ticks to analyze the market activity. Bullish and bearish ticks are analyzed separately, informing about the currently predominant market sentiment. According to observations, an increase in the frequency of ticks (panic) indicates the beginning of strong price changes, and an increase in the frequency of ticks in a particular direction not only accompanies a price change in this direction, but also often anticipates it. The indicator is indispens
FREE
This script will show you information about the execution speed of market orders. Instruction 1. Press " File/Open Data Folder " 2. Copy the log-files from ../Logs to ../MQL5/Files 3. Run the CheckExec script on EURUSD chart, for example 4. Select parameters: AllOrders - check execution time of all market orders for EURUSD, OpenOrders - check execution time of market orders which where used to open positions on EURUSD, CloseOrders - check execution time of market orders which where used to
MMM Heiken Ashi strategy: The robot uses its built-in Heiken Ashi improved and tested indicator all the time and does a calculation to determine the prices trends. It sends an order, closes or moves the Trailing Stop loss position as the indicator works. Perfect for Scalping; It will not send an order unless the calculations determine a good trend of profit; Like all MMM products, it is also programmed to minimize your losses and protect your money from the hostile market. We have protections li

A comprehensive tool for determining the levels of support, resistance, reversals in relation to trading sessions. The indicator's thesis can be expressed as follows: "Support and resistance levels are undoubtedly formed by the psychological barriers of market participants, and influence the further behavior of the price. But these barriers are different for different groups of traders ( One man's meat is another man's poison ) and can be grouped by territory or by the trading time ". Follo

This is an ordinary MACD indicator displayed in the main window according to the selected chart style, i.e. Bars, Candlesticks or Line. When you switch the chart type, the indicator display also changes. Unfortunately I could not improve the chart type switching speed. After switching, there are delays before the arrival of a new tick.
The indicator parameters Fast EMA period Slow EMA period Signal SMA period Applied price
FREE
Purpose DG DayInfo is a free indicator that shows information about: Day's maximum prices; Day's minimum prices; Day's percentual variations; Daily candle direction (Up, Down or Flat); Candle timer; This way, DG DayInfo helps you to see day's maximum and minimum, check day's percentual variation and time left to close candle.
Key features Designed to be simple to use, with a few parameters Works in ALL pairs Works within ALL time frames*
Main Indicator Parameters Days - Set to how many days yo
FREE
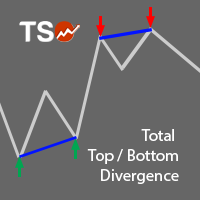
A must-have tool for any strategy based on divergence detection. 10 different oscillators can be used to detect divergences and can be combined with Double Top/Bottom patterns to confirm reversal signals. SCANNER is included . Now with Scanner you can find trading opportunities and setups easily and faster.
Features Easily detect strong reversal signals. 10 different oscillators are available for divergence detection. Divergence & Top/Bottom detection can operate independently or combined. Get

The advisor is designed for autonomous automatic round-the-clock trading on the EUR/USD pair, timeframe M15. There is a protection of the deposit from significant drawdown and a mode for saving a profitable transaction. Trades one deal. With the set parameters, it turns out to be one per day on average. How it works Uses the author's algorithm for analyzing three indicators and the direction of market movement to make a decision to open a deal. RSI Stochastic Bands market direction Opens an orde
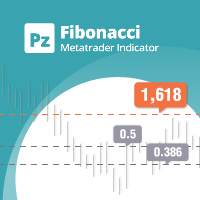
Are you tired of plotting Fibonacci retracements or extensions manually? This indicator displays Fibo retracements or extensions automatically, calculated from two different price points, without human intervention or manual object anchoring. [ Installation Guide | Update Guide | Troubleshooting | FAQ | All Products | Get Help ] Easy to use Manual anchoring is not needed Perfect for price confluence studies The indicator evaluates if retracements or extensions are needed Once drawn, you can m
FREE

For any trader, the result of market analysis is the correct identification of the market entry and exit points. The more correctly they are selected, the more profitable the trading. The SmartArrows indicator does not display any excessive information that may distract or confuse the trader, but only the mot important things. The indicator is very simple to use. When a down arrow appears, open a SELL trade, with an up arrow open BUY. Despite its seeming simplicity, the SmartArrows indicator con

Ilanis is an Expert Advisor for stock trading, it can be used for trading on Forex and other markets, including commodities, metals and index markets. To determine the market entry, the EA uses the modern and ultra-light adaptive indicator FourAverage. Principle of position maintaining is similar to that of the popular Forex robot Ilan, using averaging. But unlike Ilan, Ilanis uses an accurate entry into the market. The robot pays a lot of attention to position control, if the price goes in the

FFF Forts is a fully automated trading robot designed to trade on futures on the Russian derivatives market FORTS (RTS, Sberbank, Gazprom, the Ruble, etc.). The robot trades only with the trend. Trade entry occurs on roll-backs. The size of the roll-back is determined manually (in points) or automatically based on the volatility of the instrument.
Settings Type of trade - trade direction Topping up on a trend - enable/disable adding a trend Use Times Filters - enable/disable time limit for trad
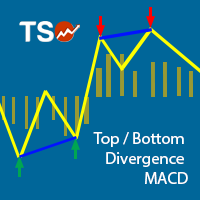
This indicator combines double bottom and double top reversal chart patterns together with detection of divergences between the price chart and the MACD oscillator.
Features Easily detect strong reversal signals Allows to use double top/bottom and MACD divergence signals combined or independently Get email and/or push notification alerts when a signal is detected Custom colors can be used The indicator is not repainting Can easily be used in an EA (see below)
Inputs ENABLE Double Top - Bottom:
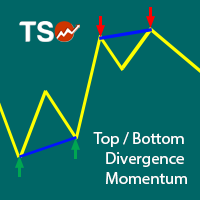
This indicator combines double bottom and double top reversal chart patterns together with detection of divergences between the price chart and the Momentum oscillator.
Features Easily detect strong reversal signals Allows to use double top/bottom and Momentum divergence signals combined or independently Get email and/or push notification alerts when a signal is detected Custom colors can be used The indicator is not repainting Can easily be used in an EA (see below)
Inputs ENABLE Double Top -

MetaTrader 4 version available here: https://www.mql5.com/en/market/product/25793 FFx Pivot SR Suite PRO is a complete suite for support and resistance levels. Support and Resistance are the most used levels in all kinds of trading. Can be used to find reversal trend, to set targets and stop, etc.
The indicator is fully flexible directly from the chart 4 periods to choose for the calculation: 4Hours, Daily, Weekly and Monthly 4 formulas to choose for the calculation: Classic, Camarilla, Fibonac
Call/Put Ratio is one of the most well-known indicators of the market sentiment. The indicator has been developed by Martin Zweig. It is based on real volumes of the CBOE option market. As we know, a Call option gives its owner the right to buy the underlying asset at a predetermined price. A Put option gives the right to sell it. Thus, increasing volumes for Call options indicate the increasing demand. The growth of Put option volumes shows that supply starts exceeding demand. If we divide the
The AllClosedMT5 utility in the form of an expert. The utility is designed for closing all open positions simultaneously based on the total profit (in the deposit currency) of all open positions. The utility can be attached to any chart with any trading instrument.
Parameters Profit - the total positive profit in the deposit currency, at which all open positions are closed (profit). Stop - the total negative profit in the deposit currency, at which all open positions are closed (loss). The valu
FREE
Jack of all Trades MT5 is an Expert Advisor for trading high market moves. This is a fully automated EA optimized for multicurrency EURUSD, EURGBP, GBPUSD, USDCAD, USDJPY. The EA can be used on any timeframe because the indicators are locked to M10. The EA uses MACD(7,21,4), MOMENTUM(11) and candlestick history for last 10 candles on M10 for creating a signal. Because the EA is locked on M10, the trades will open on the same spot, it does not matter, on which timeframe it is tested. The EA also

Currency Index Watcher is a simple and user-friendly tool for whoever wish to trade Forex using currencies indexes. Currency Index Watcher is configurable and usable directly from the panel. Indexes of 8 custom currencies
EUR, USD, GBP, JPY, CHF, AUD, CAD, NZD (default) Any 3-chars symbol from your market watch could be used (BTC = bitcoin, RUB = ruble, CNH = yuan etc ...) : double click the symbol label Ability to select which currencies and made-of pairs will be analyzed : check/uncheck wante
Note: Demo version only works on NZDJPY and USDRUB
What does it do? It assists you in your trading and has some important jobs to perform: It sets virtual pending orders, stop loss and take profit. It can set real stop loss and take profit if desired. It makes trading independent of bid-ask line concept, thus useful for very short term traders and price action traders. Orders can be opened, managed and closed with 1 click providing fastest management. It can automatically set your position sizi
FREE
What does it do? It assists you in your trading and has some important jobs to perform: It sets virtual pending orders, stop loss and take profit. It can set real stop loss and take profit if desired. It makes trading independent of bid-ask line concept, thus useful for very short term traders and price action traders. Orders can be opened, managed and closed with 1 click providing fastest management. It can automatically set your position sizing based on your risk inputs. Graphical panel enable

MonsterDash Harmonics Indicator is a harmonic pattern dashboard. It recognizes all major patterns. MonsterDash is a dashboard that displays all detected patterns for all symbols and (almost) all timeframes in sortable and scrollable format. Users can add their own user defined patterns . MonsterDash can open and update charts with the pattern found.
Settings MonsterDash's default settings are good enough most of the time. Feel free to fine tune them to your needs. The color settings are for tho
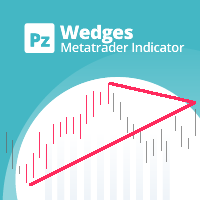
Boost your trading precision with the versatile wedges tool
The PZ Wedges Indicator is a technical analysis tool that helps traders identify potential continuation patterns in the market. These patterns, known as wedges, are formed when the price of an asset consolidates within a narrowing range, bounded by upward or downward converging trendlines. Wedges are considered to be continuation patterns because they often precede a breakout in the direction of the preceding trend. When a wedge pattern
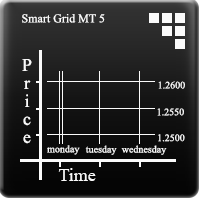
Smart Grid MT5 automatically recognizes any symbol, period and scale of the chart and marks it up accordingly. It is possible to mark up the chart by trading sessions. The grid consists of the two main line types.
Vertical lines There are two visualization methods: Standard - the lines are divided into three types, separating: Small time period. Medium time period. Large time period. Trading Session - the lines are divided into groups (a total of ten). Each group has two lines: the first is res
FREE

This Impro Martin is an enhanced Expert Advisor (EA) based on Martingale’s strategy. Instead of using a clear admittance signal, it uses random admittance , and deals with the subsequent orders according to the status of the first order. It had in-depth optimization of risk management and lots dispose to reduce transaction risk. At the same time, this product also has the functions of Trailing Stop Loss (the gained profit is protected from any lost, so as to maintain the growth of profit) and Fi
The TSO Total Negative Management EA contains an adaptive negative management system that can prevent losing trades and even account collapse in almost any market condition. Adapts to adverse market conditions and switches to the correct negative management strategy for any situation. TSO Signal Builder , TSO Order Recovery and TSO Loss Management are included and can be used in combination or individually. Apply negative management to any strategy (manual or automated). No pending orders placed

The indicator identifies the most suitable moment for entering the market in terms of market volatility, when the market has the strength to move (the signal is indicated by an arrow under the candle). For each of the signals, the presence of trends on the current and higher timeframes is determined, so that the signal is in the direction of the majority of positions opened on the market (denoted near the signal by abbreviations of timeframes with a trend present). The signal appears after the c

Alpha Trend MT5 is a trend indicator for the MetaTrader 5 platform; it has been developed by a group of professional traders. The Alpha Trend MT5 indicator finds the most probable tendency reversal points, which allows making trades at the very beginning of a trend. This indicator features notifications, which are generated whenever a new signal appears (alert, email, push-notification). This allows you to open a position in a timely manner. Alpha Trend does not redraw, which makes it possible t
TSO Signal Builder MT5 is a MetaTrader 5 Expert Advisor that provides a solid platform to quickly build test and develop automated trading strategies based on indicator signals. Contains 29 indicators, including trend and volume indicators, oscillators as well as many indicators described by Bill Williams. Basic as well as advanced order management features. All indicators are configurable and can be combined to create strategies with different entry and exit signals as well as reverse orders.
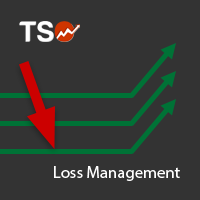
TSO Loss Management is an Expert Advisor that incorporates advanced mechanics to eliminate losses from losing trades. Adapts to diverse market conditions and micromanages each position to cover losses as fast as possible and with minimum risk It uses all the tools of the TSO Signal Builder EA - almost infinite entry/exit strategies Add negative management to any strategy (manual or automated) to eliminate losing trades No pending orders placed Any account size - $1,000+ is recommended Allows for
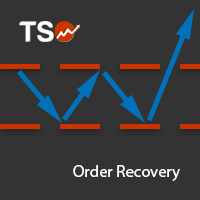
TSO Order Recovery is an expert advisor that provides a known and tested method of covering losses from open positions through hedging. It uses all the tools of the TSO Signal Builder EA - almost infinite entry/exit strategies Add negative management to any strategy (manual or automated) to eliminate losing trades No pending orders are placed Any account size - a minimum of $1,000 is recommended Works on any currency pair Allows for a lot of customization (a default strategy is included for demo
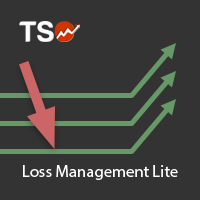
TSO Loss Management Lite contains all the features of TSO Loss Management except from the Swings mechanism and the other mechanisms based on Swings. Adapts to diverse market conditions and micromanages each trade opened so that the loses are covered as fast as possible but also with minimum risk. It uses all the tools of the TSO Signal Builder EA - almost infinite entry/exit strategies. Add negative management to any strategy (manual or automated) to eliminate losing trades. No pending orders ar
Do you know why the MetaTrader Market is the best place to sell trading strategies and technical indicators? No need for advertising or software protection, no payment troubles. Everything is provided in the MetaTrader Market.

You are missing trading opportunities:
- Free trading apps
- Over 8,000 signals for copying
- Economic news for exploring financial markets
Registration
Log in
You agree to website policy and terms of use
If you do not have an account, please register