 MetaTrader 5
 Experts
 Indicateurs
 Bibliothèque
 Utilitaires
 Widgets
 Règles
Regardez les tutoriels vidéo de Market sur YouTube
Comment acheter un robot de trading ou un indicateur
Exécutez votre EA sur
hébergement virtuel
hébergement virtuel
Test un indicateur/robot de trading avant d'acheter
Vous voulez gagner de l'argent sur Market ?
Comment présenter un produit pour qu'il se vende bien
Nouveaux Expert Advisors et indicateurs pour MetaTrader 5 - 520
 Utilisez des robots de trading et des indicateurs pour rendre le trading de forex plus rentable. Les robots de trading vous permettent d'automatiser l'ouverture et la clôture des transactions, tandis que les indicateurs vous aident à prédire le comportement du marché avec plus de précision. La page présente le catalogue des applications MetaTrader 5.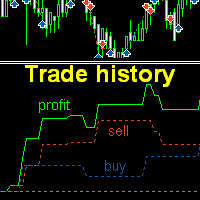
The indicator plots charts of profit taken at the Close of candles for closed (or partially closed) long and short positions individually. The indicator allows to filter deals by the current symbol, specified expert ID (magic number) and the presence (absence) of a substring in a deal comment, to set the start time and the periodicity of profit reset (daily, weekly or monthly) to calculate the profit chart. The indicator also displays the floating (not fixed) profit of the opened positions at th
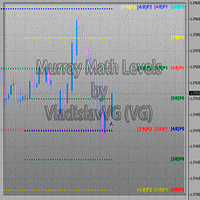
This indicator calculates and displays Murrey Math Lines on the chart. This MT5 version is similar to the МТ4 version: It allows you to plot up to 4 octaves, inclusive, using data from different time frames, which enables you to assess the correlation between trends and investment horizons of different lengths. In contrast to the МТ4 version, this one automatically selects an algorithm to search for the base for range calculation. You can get the values of the levels by using the iCustom() funct

The Close script is a simple tool that allows traders to close their trades by three methods. Just run the script and choose the close method.
Closing methods Symbol - Allows closing all open trades for a specific symbol. All_Trades - Allows closing all open trades. Magic_Number - Allows closing all open trades according to their magic number. Recommendation AutoTrading functions must be activated. If the AutoTrading function is disabled, the script will not work. EA should be stopped.
FREE
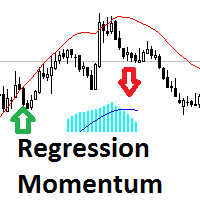
The Regression Momentum is an indicator of directional movement, built as the relative difference between the linear regression at the current moment and n bars ago. The indicator displays the calculated Momentum in a separate window as a histogram. The signal line is a simple average of the histogram. The histogram value above 0 indicates an uptrend. The higher the value, the stronger the trend. A value below 0 indicates a downtrend. The lower the value, the stronger the downtrend. Intersection

The Equity Curve indicator is a simple and helpful tool that shows the development of the equity curve in real time. For precision measurement, it should be used in a separate window with a period of M1.
Main features The indicator shows the development of the equity curve in real time. High precision on the minute chart. High-speed calculation. Available for MT4 and MT5. Please visit the Equity Curve indicator product page for the input and output parameters settings.
FREE

The indicator displays in a separate window a price chart as Heiken Ashi candlesticks with a periodicity below a minute. Available periods (seconds): 30, 20, 15, 12, 10, 6, 5, 4, 3, 2, 1. It is possible to select the base price for calculations.
Parameters Time frames - the period of candlesticks in seconds. Price levels count - the number of price levels on a chart. Applied price - the price used in calculations. Buffer number: 0 - Heiken Ashi Open, 1 - Heiken Ashi High, 2 - Heiken Ashi Low, 3

An analogue of the Stochastic oscillator based on algorithms of singular spectrum analysis (SSA) SSA is an effective method to handle non-stationary time series with unknown internal structure. It is used for determining the main components (trend, seasonal and wave fluctuations), smoothing and noise reduction. The method allows finding previously unknown series periods and make forecasts on the basis of the detected periodic patterns. Indicator signals are identical to signals of the original i
FREE

RSI Sniper EA is fully automated EA and handles two strategies at same time with its unique style. This Ea use RSI indicator and martingale strategies in MetaTrader 5 Terminal. The default settings are just place holders and not necessarily the best. Use the settings that best suites you or your strategy. OpenBUY - Set to true to allow buy trades. This setting is true by default. OpenSELL - Set to true to allow sell trades. This setting is true by default. StartTakeProfit - take profit value for

Who will be interested in this product: those who are used to diversify the portfolio with a large number of pairs. those who work with a large number of orders those who trade news using pending orders (see the "Grid request" tab). The panel is designed to make managing a large number of orders as easy as managing one.
"Trading" window "Request" tab The currency pairs and order types for opening are formed here. The prices and stop levels are set.
User can define the price values in points and

Cross MA TrendX Cross MA TrendX est un Expert Advisor MetaTrader 5 basé sur une structure de Moving Averages, avec filtres d'entrée, gestion de panier et contrôles pratiques du risque. La version 6.0 rend le panneau plus clair : direction, lot, horaires, filtres de marché et comportement recovery/grid. Fonctions principales Structure d'entrée par Moving Averages Lot fixe ou smart lot Filtre de spread et horaires Filtres ATR/ADX Limite des ordres recovery Paramètres principaux fixedLot - lot fixe

The indicator determines the inside bar and marks its High/Low. It is plotted based on the closed candles (does not redraw). The identified inside bar can be displayed on the smaller periods. You may set a higher period (to search for the inside bar) and analyze on a smaller one. Also you can see the levels for Mother bar.
Indicator Parameters Period to find Inside Bar — the period to search for the inside bar. If a specific period is set, the search will be performed in that period Type of ind

L'indicateur AIS Correct Averages vous permet de définir le début d'un mouvement de tendance sur le marché. Une autre qualité importante de l'indicateur est un signal clair de la fin de la tendance. L'indicateur n'est pas redessiné ou recalculé.
Valeurs affichées h_AE - limite supérieure du canal AE
l_AE - limite inférieure du canal AE
h_EC - Valeur prédite haute pour la barre actuelle
l_EC - Valeur prédite basse pour la barre actuelle
Signaux lors du travail avec l'indicateur Le signal pr
如果产品有任何问题或者您需要在此产品上添加功能,请联系我 Contact/message me if you encounter any issue using the product or need extra feature to add on the base version.
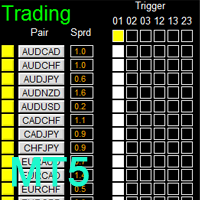
There is Demo version of this panel Dashboard Super Three MA MT5 Demo in my product list, please try it out to get familiar with all functionalities for free Free version: LINK MT4 version: LINK This system basically utilizes PA and three adjustable Moving Average as the main indicator set to generate trading signal. With the feature that all MA_timefram
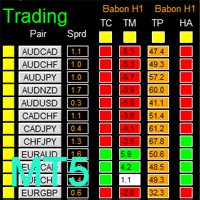
如果产品有任何问题或者您需要在此产品上添加功能,请联系我 Contact/message me if you encounter any issue using the product or need extra feature to add on the base version.
There is Demo version of this panel Dashboard Babon Scalping System MT5 Demo in my product list, please try it out to get familiar with all functionalities for free. Free version: LINK MT4 version: LINK This system basically utilizes TDI, Heiken Ashi Trend, Price Trend on H1 time-frame and TMA on H1&H4 time-frame to generate the trend (big picture). Then
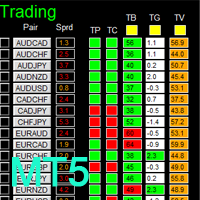
如果产品有任何问题或者您需要在此产品上添加功能,请联系我 Contact/message me if you encounter any issue using the product or need extra feature to add on the base version.
There is Demo version of this panel Dashboard Timeframe 15 MT5 Demo in my product list, please try it out to get familiar with all functionalities free. Free version: LINK MT4 version: LINK This system basically utilizes TDI as the core indicator to generate trading signal mainly on time-frame M15. The signal will be further filtered and trimmed by 1) 20
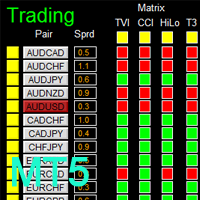
如果产品有任何问题或者您需要在此产品上添加功能,请联系我 Contact/message me if you encounter any issue using the product or need extra feature to add on the base version.
There is Demo version of this panel Dashboard Genesis Matrix Trading MT5 Demo in my product list, please try it out to get familiar with all functionalities for free. Free version: LINK MT4 version: LINK This system basically utilizes Genesis Indi Set (TVI, CCI, GannHilo, and T3) as the core indicators to generate trading signal mainly on time-frame M15.
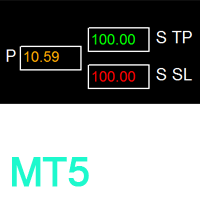
如果产品有任何问题或者您需要在此产品上添加功能,请联系我 Contact/message me if you encounter any issue using the product or need extra feature to add on the base version.
Session TakeProfit StopLoss is basically helping to set the take profit and stop loss in dollar for the total open orders (session). Once the total profit is greater than session_tp or less than session_sl, the EA will help to close all open orders acting similarly to a take profit/stop loss for a single order.
Inputs session_tp: session take profit ses
FREE

Was: $249 Now: $99 Market Profile defines a number of day types that can help the trader to determine market behaviour. A key feature is the Value Area, representing the range of price action where 70% of trading took place. Understanding the Value Area can give traders valuable insight into market direction and establish the higher odds trade. It is an excellent addition to any system you may be using. Inspired by Jim Dalton’s book “Mind Over Markets”, this indicator is designed to suit the

Was: $299 Now: $99 Supply Demand uses previous price action to identify potential imbalances between buyers and sellers. The key is to identify the better odds zones, not just the untouched ones. Blahtech Supply Demand indicator delivers functionality previously unavailable on any trading platform. This 4-in-1 indicator not only highlights the higher probability zones using a multi-criteria strength engine, but also combines it with multi-timeframe trend analysis, previously confirmed swings a
RSI Alerts est un indicateur MetaTrader 5 qui ajoute des alertes pratiques au classique Relative Strength Index (RSI). Vous voyez toujours la ligne RSI et les niveaux 30, 50, 70, mais au franchissement des niveaux choisis l'indicateur peut afficher des alertes popup, envoyer des notifications push et des e-mails - vous ne manquez pas un possible retournement ou breakout.
Sur quoi est-il base ? L'indicateur repose sur le RSI standard (Relative Strength Index) - le meme oscillateur utilise par d

Was: $99 Now: $49 Blahtech Daily Range indicator displays the average daily range alongside the individual session ranges. Using the daily open price as a reference the indicator shows fixed range and dynamic range targets as lines on the charts. These lines clearly show when the average range has been exhausted. Daily and session ranges can be useful for confirming entries or setting targets and is an excellent odds enhancer for many trading systems. Links [ Documentation | Install | U
Order Flow Balance is a powerful indicator for Tape Reading (Time & Sales). It helps you analysis Order Flow Market, find where the players are moving in, market imbalance, possible reversal points and much more! The indicator works on MOEX, BM&FBOVESPA, CME, etc. It has 5 different indicator types Cumulative Delta: Also know as Cumulative Volume Delta, it is an advanced volume analysis method where traders can see the daily difference between aggressive buyers and aggressive sellers. Comparison
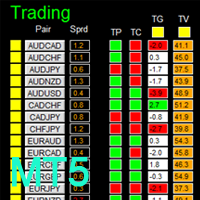
如果产品有任何问题或者您需要在此产品上添加功能,请联系我 Contact/message me if you encounter any issue using the product or need extra feature to add on the base version.
There is a demo version of this panel Dashboard Trading Made Simple Demo in my product list, please try it out to get familiar with all functionalities free, LINK . This system basically utilizes TDI as the main indicator to generate trading signal mainly on H1 and H4 time-frame. The signal will be further filtered and trimmed.
Stochastic; Heiken Ashi ca
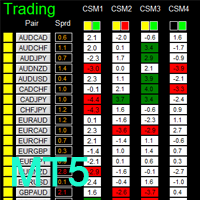
如果产品有任何问题或者您需要在此产品上添加功能,请联系我 Contact/message me if you encounter any issue using the product or need extra feature to add on the base version.
There is a Demo version of this panel Dashboard Currency Strength Advanced MT5 Demo in my product list, please try it out to get familiar with all functionalities for free, Free version: LINK . MT4 version: LINK
The Dashboard Currency Strength Meter Advanced gives you a quick visual guide to which currencies are strong, and which ones are weak over the
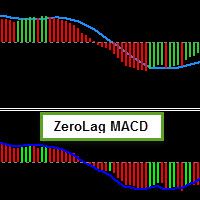
It is the MQL5 version of zero lag MACD that was available for MT4 here: https://www.mql5.com/en/code/9993 Also there was a colored version of it here but it had some problems: https://www.mql5.com/en/code/8703 I fixed the MT4 version which has 95 lines of code. It took me 5 days to write the MT5 version.(reading the logs and testing multiple times and finding out the difference of MT5 and MT4!) My first MQL5 version of this indicator had 400 lines of code but I optimized my own code again and n
FREE
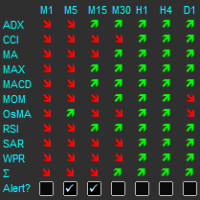
The indicator displays a matrix of indicators across multiple timeframes with a sum total and optional alert. Custom indicators can also be added to the matrix, in a highly configurable way. The alert threshold can be set to say what percentage of indicators need to be in agreement for an alert to happen. The alerts can turned on/off via on chart tick boxes and can be set to notify to mobile or sent to email, in addition to pop-up. The product offers a great way to create an alert when multiple
如果产品有任何问题或者您需要在此产品上添加功能,请联系我 Contact/message me if you encounter any issue using the product or need extra feature to add on the base version.
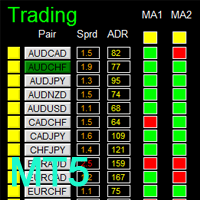
There is Demo version of this panel Dashboard Super MA RSI CCI Demo in my product list, please try it out to get familiar with all functionalities for free, LINK . Dashboard Super MA RSI CCI is an intuitive and handy graphic tool to help you to: Have 28 pairs under control with one dashboard Monitor price movement, identify possible trend based on MA, RS
如果产品有任何问题或者您需要在此产品上添加功能,请联系我 Contact/message me if you encounter any issue using the product or need extra feature to add on the base version.
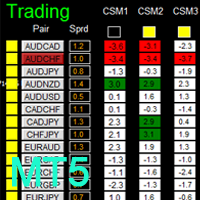
There is Demo version of this panel Dashboard Timeframe 15 Demo in my product list, please try it out to get familiar with all functionalities free, LINK . This system basically utilizes TDI as the core indicator to generate trading signal mainly on time-frame M15. The signal will be further filtered and trimmed by 1) 200 EMA and Price; 2) 10 EMA and
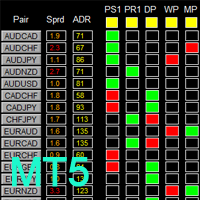
如果产品有任何问题或者您需要在此产品上添加功能,请联系我 Contact/message me if you encounter any issue using the product or need extra feature to add on the base version.
To access the free demo version, please re-direct to this LINK . To access the single pair version, please re-direct to this LINK . There are two critical components in a profitable trading system, one is entry (place an order), and another one is exit (close an order). You can exit by time: closing order after London Close for example. You can also exit
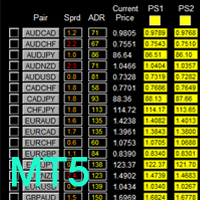
如果产品有任何问题或者您需要在此产品上添加功能,请联系我 Contact/message me if you encounter any issue using the product or need extra feature to add on the base version.
To access the free demo version, please re-direct to this LINK . To access the single pair version, please re-direct to this LINK . Price is likely to pullback or breakout at important support and/or resistance. This dashboard is designed to help you monitor these critical support and resistance area. Once price moves close to these important support and
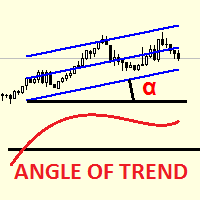
Linear Regression Angle is a directional movement indicator which defines a trend at the moment of its birth, and additionally defines trend weakening. The indicator calculates the angle of the linear regression channel and displays it in a separate window in the form of histogram. The signal line is a simple average of the angle. The angle is the difference between the right and left edges of regression (in points), divided by its period. The angle value above 0 indicates an uptrend. The higher

xCalper Economic Calendar brings economic calendar information to your Terminal chart and Experts from online sources. Just add it to your chart to see detailed news without losing attention or automate reading of calendar information to improve trading decisions.
Main Features Support data sources: Forex Factory. Filtering by day, impact or currency of news. Visual alert of upcoming news. Platform notification of upcoming news.
Parameters Filters Impact expected - Show/Hide by impact: Low, Me
FREE
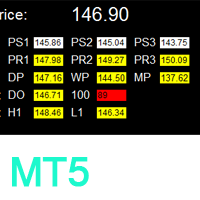
如果产品有任何问题或者您需要在此产品上添加功能,请联系我 Contact/message me if you encounter any issue using the product or need extra feature to add on the base version.
To access the free demo version, please re-direct to this LINK . To access the dashboard version, please re-direct to this LINK . Critical Support and Resistance is an intuitive, and handy graphic tool to help you to monitor and manage critical support and resistance price point easily with one glance to know status of all important S&R. Price is likely
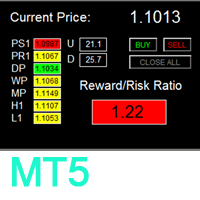
如果产品有任何问题或者您需要在此产品上添加功能,请联系我 Contact/message me if you encounter any issue using the product or need extra feature to add on the base version.
To access the free demo version, please re-direct to this LINK . To access the dashboard version, please re-direct to this LINK . There are two critical components in a profitable trading system. One is entry (placing an order) and another one is exit (closing an order). You can exit by time: closing order after London Close, for example. You can also ex
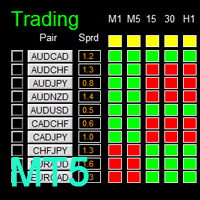
如果产品有任何问题或者您需要在此产品上添加功能,请联系我 Contact/message me if you encounter any issue using the product or need extra feature to add on the base version.
There is Demo version of this panel Dashboard Super Candle DEMO in my product list, please try it out to get familiar with all functionalities for free, LINK . Dashboard Super Candle gives you a quick visual guide to which pair’s short-term, medium-term, and long-term direction/trend are aligned. With the combination of these trend, you are able to monit
如果产品有任何问题或者您需要在此产品上添加功能,请联系我 Contact/message me if you encounter any issue using the product or need extra feature to add on the base version.
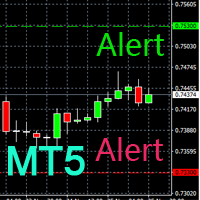
PA Touching Alert is a tool to free you from watching price to touch certain critical price levels all day alone. With this tool, you can set two price levels: upper price and lower price, which should be greater than/less than the current price respectively. Then once price touches the upper price or lower price, alert and/or notification would be sent
FREE
如果产品有任何问题或者您需要在此产品上添加功能,请联系我 Contact/message me if you encounter any issue using the product or need extra feature to add on the base version.
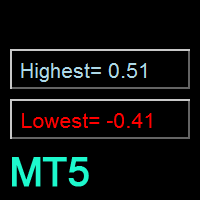
Floating Highest Lowest MT5 provides you an intuitive and user-friendly method to monitor the floating highest (profit) and lowest (loss) that all your trades together ever arrive. For example, I opened 3 orders, which arrived at $4.71 floating profit when trade following trend. Later when the trend is against me, these 3 orders arrive $30 in loss, and a
FREE

Stochastic Oscillator displays information simultaneously from different periods in one subwindow of the chart.
Parameters %K Period — K-period (number of bars for calculations). %D Period — D-period (period of first smoothing). Slowing — final smoothing. Method — type of smoothing. Price field — stochastic calculation method . Timeframes for Stochastic — list of periods, separated by a space or comma or semicolon. Number of bars for each period — the number of bars displayed for each period. S

Multi-timeframe indicator Relative Strength Index displays information simultaneously from different periods in one subwindow of the chart.
Parameters Period of averaging — averaging period for the RSI calculation. Type of price — price used. Timeframes for RSI — list of periods, separated by a space or comma or semicolon. Number of bars for each period — the number of bars displayed for each period. Sort periods — sort periods if they are listed in no particular order. Current period first — d

Multi-timeframe indicator Commodity Channel Index displays information simultaneously from different periods in one subwindow of the chart.
Parameters Period of averaging — averaging period for the CCI calculation. Type of price — price used. Timeframes for CCI — list of periods, separated by a space or comma or semicolon. Number of bars for each period — the number of bars displayed for each period. Sort periods — sort periods if they are listed in no particular order. Current period first — d

The Moving Averages Convergence/Divergence indicator displays information simultaneously from different periods in one subwindow of the chart.
Parameters Fast EMA — period for Fast average calculation. Slow EMA — period for Slow average calculation. MACD SMA — period for their difference averaging. Type of price — price used. Timeframes for MACD — list of periods, separated by a space or comma or semicolon. Number of bars for each period — the number of bars displayed for each period. Sort peri
如果产品有任何问题或者您需要在此产品上添加功能,请联系我 Contact/message me if you encounter any issue using the product or need extra feature to add on the base version.
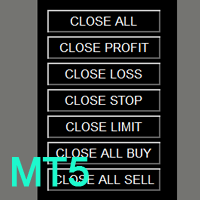
You can get the free Close Button MT4 version at LINK . Close Button provides you an intuitive, effective, and handy way to close your orders and/or positions based on their type and their profit status. The tool provides seven close options: Close All: close all pending orders and positions. Close Profit: close all positions which are in profit. Close L
FREE
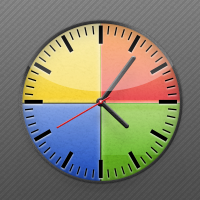
The new product Time IV (2013) is an updated version of Time III introduced earlier in the Market. The indicator displays the work time of world marketplaces in a separate window in a convenient way. The indicator is based on the TIME II (VBO) indicator rewritten in MQL5 from a scratch. The new version Time IV is a higher quality level product. Comparing to Time III it consumes less resources and has optimized code. The indicator works on Н1 and lower timeframes.
Adjustable parameters of the in
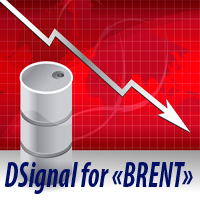
DSignal for "Brent" is a new indicator for buying and selling in MetaTrader 5. This is a simple indicator that shows market entry points. Perfect for both beginners and professionals. Recommended time frame is H1. Recommended financial instrument for trading is Brent oil. Work with 4-digit and 5-digit quotes. Never repaints signal.
Features A market entry is possible at the close of H1 candlestick if the indicator draws an arrow (sell when crimson, buy when blue). Never repaints signal. Indicat
The utility (Expert Advisor) is designed for monitoring and controlling the total drawdown, as well as closing all positions after reaching the specified levels or upon the occurrence of a specified time with the ability to disable the operation of the automatic EAs running in the same terminal. It is capable of tracking the status of the entire account, as well as individual pairs. It works with the positions opened manually or by other automatic EAs. It tracks the open trades in real time mode
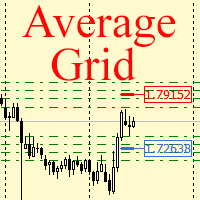
For any number of placed market and pending orders, the utility calculates the "breakeven level" - weighted average price. The calculation is performed individually for buy and sell orders. The weighted average price is marked with a label and colored horizontal line separately as well - one line for the buy price, and the other for sell price.
Input Parameters: Include pending. Include the pending orders in calculation. The default value of this parameter is false, and the calculation of the b
FREE
This indicator shows the value of returns in the selected time frame
They are calculated as logarithm of returns , rather than price or raw returns. For small returns, arithmetic and logarithmic returns will be similar. The benefit of using returns, versus prices, is normalization. It is possible measures all variables in a comparable metric despite originating from price series of unequal values
Inputs You can display data both as a Histogram or a Line It's also possible to display the a
FREE

Multicurrency scalper, works at night time, performing short trades during low volatility. For trading to be profitable, a broker with low night spreads is required. Working timeframe: M15 Working on a real account:
Type2 https://www.mql5.com/en/signals/245053 Mix https://www.mql5.com/en/signals/363093 Settings - in the description of the signal Installation instruction: https://www.mql5.com/ru/blogs/post/721443
Input parameters MagicNumber – magic number, identification number for a symbol.

The indicator calculates the inclination angle between the Highs, Lows and Closes of adjacent bars. The angle can be measured in degrees or radians. A linear graph or a histogram is drawn in a subwindow. You can set the scale for the calculation — floating or fixed. For use in Expert Advisors or indicators, you need to specify a fixed scale.
Parameters Angular measure — degrees or radians. Scale mode for calculation — scaling mode. Free scale — free transformation, the indicator will calculate
FREE

The indicator displays in a separate window a price chart as bars or Japanese candlesticks with a periodicity below a minute. Available periods (seconds): 30, 20, 15, 12, 10, 6, 5, 4, 3, 2, 1. The display mode (bars or candlesticks) is switched by clicking on the chart.
Parameters Period in seconds - the period of bars in seconds Price levels count - the number of price levels on a chart Buffer number: 0 - Open, 1 - High, 2 - Low, 3 - Close, 4 - Color.

Cet utilitaire permet de basculer entre les symboles. Vous devez insérer dans l'entrée vos tickers favoris. Il est possible de personnaliser jusqu'à 5 symboles
Touche de raccourci : Basculer entre les symboles : A -Avant D -Arrière
Inputs Vous pouvez configurer vos touches préféré pour basculer entre les symboles. Vous pouvez personnaliser la coleur de l'arrière-plan et le bord des boutons . Vous pouvez personnaliser les libellés : dimension et police
FREE

L'indicateur affiche le profit (la perte) sur le symbole actuel. Vous pouvez librement faire glisser et déposer la ligne pour afficher le profit ou la perte actuel.
Vous pouvez retrouver mes produits ici
Paramètres Calculation in money or in points — calculez le profit/la perte en points ou en argent. Add pending orders to calculate — prenez en compte les commandes en attente dans les calculs. Magic Number (0 - all orders on symbol) — nombre magique, s'il est nécessaire d'évaluer des comma
FREE

Friends, join us!
Ask questions and connect with like-minded traders: MetaCOT Public Group
MetaCOT Information Channel: news, CFTC reports, and signals: MetaCOT Channel
Here’s to successful trading and new profitable signals for us all! Attention! Recently, certain countries have been blocking access to the cftc.gov website. As a result, users in these countries are giving the product low ratings. MetaCOT has always adhered to the highest quality standards and is in no way associated with th
FREE

This is a classical trading strategy, which falls into the category of breakout systems. They form support and resistance levels, which temporarily limit further price movement. When the price breaks down the support level or breaks up the resistance level, there emerges a strong momentum in the breakout direction, which allows to make profit on strong price movements with moderate risk. To create the strategy, we used historical data with the quality of history of 99.9%.
It uses filtration of
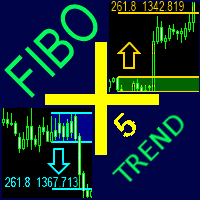
The indicator automatically plots and tracks buy and sell Fibo levels at any symbol and timeframe. FiboPlus Trend displays: the trend on all timeframes and indicators values.
Fibo levels of the probable upward or downward price movements. entry points are shown using "up arrow", "down arrow" icons. The data is doubled on SELL and BUY buttons. rectangle area limited by levels 0-100. Trading is performed from one level to another (no trend). Features calculation of the trend of indicators (RSI, S

Friends, join us!
Ask questions and connect with like-minded traders: MetaCOT Public Group
MetaCOT Information Channel: news, CFTC reports, and signals: MetaCOT Channel
Here’s to successful trading and new profitable signals for us all! Attention! Recently, certain countries have been blocking access to the cftc.gov website. As a result, users in these countries are giving the product low ratings. MetaCOT has always adhered to the highest quality standards and is in no way associated with th

This utility provides the ability to use hot keys in manual trading instantly responding to the current market situation. You can assign hot keys to open/close positions by their type, open/close all positions on the current chart and remove all orders on the current chart. You can also assign hot keys for five predefined trade volumes and switch between them if necessary with no need to change the volume manually from time to time. It is also possible to set the auto calculation of a trade volu
This Indicator creates a heatmap based on depth of market of the current symbol or another symbol. Other symbol is useful when you trade futures market and a contract has 'mini' and 'full' split. For example, in Brazil (B3 - BMF&Bovespa), WDO and DOL are future Forex contract of BRL/USD (where 1 DOL = 5 WDO) and big banks work mostly with DOL (where liquidity is important). Please use with M1 timeframe , objects are too small to be displayed at higher timeframes (MT5 limit). The number of level

RFX Market Speed is an indicator designed to measure a new dimension of the market which has been hidden from the most traders. The indicator measures the speed of the market in terms of points per seconds and shows the measurement graphically on the chart, and saves the maximum bullish and bearish speeds per each bar. This indicator is specially designed to help the scalpers of any market with their decisions about the short bias of the market. The indicator uses real-ticks and cannot be fully
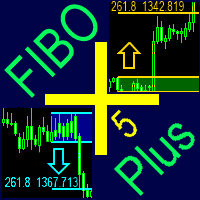
The indicator automatically plots and tracks buy and sell Fibo levels at any symbol and timeframe. FiboPlus displays: Fibo levels of the probable upward or downward price movements. entry points are shown using "up arrow", "down arrow" icons. The data is doubled on SELL and BUY buttons. rectangle area limited by levels 0-100. Trading is performed from one level to another (no trend).
Features price movement forecast, market entry points, stop loss and take profit for orders. ready-made trading

KillerTrend Ichimoku is an Expert Advisor using a trend following strategy based on Ichimoku Kinko Hyo indicator. This trading robot finds a critical event about Kijun-sen and Senkou Span.
Parameters Tenkan-sen: average price value for 9 days defined as the sum of maximum and minimum within this time, divided by two Kijun-sen: average price value for 26 days Senkou Span A: middle of the distance between two previous lines shifted forward by 26 days Senkou Span B: average price value for 52 day

The indicator builds a moving line based on interpolation by a polynomial of 1-4 powers and/or a function consisting of a sum of 1-5 sine curves. Various combinations are possible, for example, a sum of three sine curves about a second order parabola. The resulting line can be extrapolated by any of the specified functions and for various distances both as a single point at each indicator step (unchangeable line), and as a specified (re-painted) function segment for visualization. More details:
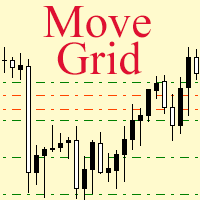
If a complex grid with specified stop loss and take profit levels has been created in the wrong place by mistake, it is not necessary to remove it and start over again. The grid can be moved to a new place using the mouse. Drag the script to the chart and drop it where the grid should be moved. The grid will be moved, keeping the distance between orders, distances to stop loss and take profit. The script works exclusively with pending orders , market orders will be left unchanged.
Input Paramet

Master Levels mt5 ( version for MT4 ) analyzes market situation over the last few days and determines current levels. It tracks a breakout (or rebound) of these levels. Trades open in the breakout (rebound) direction. The EA is fully automated. Master Levels is equipped with a flexible position management system. There is opportunity to close a position with two parts. And there is a feature of a trailing stop, which allows to protect gain profit. Depending on the settings, the EA can work both
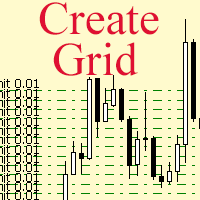
The script allows to use the mouse for placing a grid of orders with fixed or variable step quickly and with as few mistakes as possible. Drag the script to the chart using the left mouse button and release. The grid will be plotted starting from that point. If the current price is lower than the grid start point, the grid will be placed "to the north" towards the buys, and if higher - towards the sells, "to the south". Setting take profit and stop loss is left to trader's discretion.
Input Par
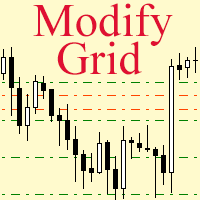
Modify the take profit and stop loss of orders grid using the mouse. Drag the script to the chart using the left mouse button and release. The script sets a single stop loss and take profit to all positions and pending orders separately, using the price value at the final point of dragging.
Input Parameters Buy or sell - the type to be modified. There are two options: All BUY - all buy orders and positions (this parameter is set to All BUY by default.)
All SELL - all sell orders and positions W

SSACD - Singular Spectrum Average Convergence/Divergence This is an analogue of the MACD indicator based on the Caterpillar-SSA ( Singular Spectrum Analysis ) method. Limited version of the SSACD Forecast indicator. Limitations include the set of parameters and their range.
Specificity of the method The Caterpillar-SSA is an effective method to handle non-stationary time series with unknown internal structure. The method allows to find the previously unknown periodicities of the series and make
FREE

This indicator is a conventional analytical tool for tick volumes changes. It calculates tick volumes for buys and sells separately, and their delta on every bar, and displays volumes by price clusters (cells) within a specified bar (usually the latest one). The algorithm used internally is the same as in the indicator VolumeDeltaMT5 , but results are shown as cumulative volume delta bars (candlesticks). Analogous indicator for MetaTrader 4 exists - CumulativeDeltaBars . This is a limited substi
This indicator provides the analysis of tick volume deltas. It monitors up and down ticks and sums them up as separate volumes for buys and sells, as well as their delta volumes. In addition, it displays volumes by price clusters (cells) within a specified period of bars. This indicator is similar to VolumeDeltaMT5 , which uses almost the same algorithms but does not process ticks and therefore cannot work on M1. This is the reason for VolumeDeltaM1 to exist. On the other hand, VolumeDeltaMT5 ca

This indicator provides a true volume surrogate based on tick volumes. It uses a specific formula for calculation of a near to real estimation of trade volumes distribution , which may be very handy for instruments where only tick volumes are available. Please note that absolute values of the indicator do not correspond to any real volumes data, but the distribution itself, including overall shape and behavior, is similar to real volumes' shape and behavior of related instruments (for example, c
Découvrez comment acheter un robot de trading sur le MetaTrader Market, le magasin d'applications de la plateforme MetaTrader.
e système de paiement de MQL5.community prend en charge les transactions via PayPal, les cartes bancaires et les systèmes de paiement populaires. Nous vous recommandons vivement de tester le robot de trading avant de l'acheter, pour une meilleure expérience client.

Vous manquez des opportunités de trading :
- Applications de trading gratuites
- Plus de 8 000 signaux à copier
- Actualités économiques pour explorer les marchés financiers
Inscription
Se connecter
Vous acceptez la politique du site Web et les conditions d'utilisation
Si vous n'avez pas de compte, veuillez vous inscrire