 MetaTrader 5
 Experts
 Indicators
 Libraries
 Utilities
 Widgets
 Rules
Watch the Market tutorial videos on YouTube
How to buy а trading robot or an indicator
Run your EA on
virtual hosting
virtual hosting
Test аn indicator/trading robot before buying
Want to earn in the Market?
How to present a product for a sell-through
New Expert Advisors and Indicators for MetaTrader 5 - 515
 Use trading robots and indicators to make Forex trading more profitable. Trading robots allow you to automate opening and closing deals, while indicators help you predict market behavior more accurately.
The page features the catalog of MetaTrader 5 applications.

The added video will showcase all functionality, effectiveness, and uses of the trade manager. Drag and Drop Trade Manager. Draw your entry and have the tool calculate the rest. Advanced targeting and close portions of a trade directly available in tool (manage trades while you sleep). Market order or limit order on either side with factored spread. Just draw the entry, the tool does the rest. Hotkey setup to make it simple. Draw where you want to enter, and the stop loss, the tool calculates al

Night scalping trading in the horizontal Bollinger channel. No risky strategies. All trades are protected by a stop loss. Accounting for the features of real accounts. It is possible to work with a minimum initial deposit of $10. Strategy. At night, near the rollover, market movements usually slow down, since at this time there are no strong disturbing factors. Price movements become small, but quite predictable. As a rule, they have the form of harmonic fluctuations. These movements can be used
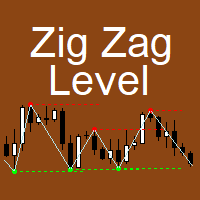
The indicator implements the author's approach to the construction of the popular "Zig-Zag" indicator.
The advantages of the "ZIgZag Level" indicator is that it filters out market noise and shows levels.
"ZIg Zag Level" is based on peaks and troughs, displays levels.
These levels can be disabled and configured.
The indicator displays the price of the level, the price tag can be disabled.
The "zigzag" line between the points can also be disabled.
The indicator has a built-in notification s

Tomamos 5 medios móviles las unimos en una la cual suavizamos y volvemos a suavizar, resultando un mega suavizador de medios móviles suavizadas. Indicador de mql5 funciona en cualquier broker y para todos los tiempos, siendo el mas optimo el de 5, 15 a mas. Funciona mejor en grupo consigo misma osea poner uno de 14 y otro de 50 y 400,, así se observa mejor su desempeño.

Eakao is a trending following EA. This EA uses some custom indicators to detect entry signal. There are 2 trades opened per signal, one trade has fixed take profit, EA will use breakeven and trailing stop for another trade. The fixed stop loss and take profit are always set for each trade. Beside stop loss, this EA uses an exit indicator to exit the trade before stop loss or take profit are triggered. This EA has smart money management. Users only need to determine the accepted loss for each tr
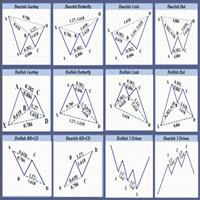
Only 5 copies of the EA at $30! Next price --> $45 Find charts and signals based on harmonic patterns, which work great in 1-hour timeframes and up.
Buy and sell signs based on different harmonic patterns as follows:
0: ABC_D
1: ABCD_E
2: 3Drive
3: 5_0
4: Gartley
5: Bat
6: Crab
7: Butterfly
8: Cypher
9: NenStar
10: Shark
11: AntiBat
12: AntiGartley
13: AntiCrab
14: AntiButterfly
15: AntiCypher
16: AntiNenStar
17: AntiShark
How to use:
When there is an opportunity to buy or sell, you have 5:

LL Hedge EA is a structured hedge recovery system for MT5 designed for controlled drawdown and stable execution. Trader's guide available here . Built for disciplined traders who prioritize risk control over aggressive exposure.
Engine optimized with centralized position cache to reduce CPU load and improve execution efficiency.
Suitable for:
• Traders familiar with hedge strategies
• VPS users seeking stable execution
• Users who understand lot and risk control
Core Features Dynamic hedg

Vero Grid is an advanced grid system that has been working on real accounts for many months. The system is designed to detect market inefficiencies and find the best entry points to close trades in the positive.
The system supports many pairs but it is recommended to use it on pre-posted pairs:
Supported currency pairs: AUDNZD;NZDCAD;EURCHF WITH TIMEFRAME M15
Supported currency pairs: AUDUSD;AUDCAD;EURAUD WITH TIMEFRAME H1
Features: Only one chart for setup: You can use EA only on one pair

ATR Scanner Pro is a multi symbol multi timeframe volatility scanner that monitors and analyzes Average True Range indicator value in up to 28 symbols and 9 timeframes in 3 modes : ATR value: As a volatility dashboard it shows the ATR indicator value in all pairs and timeframes and signals when the ATR value reaches a maximum or minimum in a given duration. Short term ATR/Long term ATR ratio: It shows ratio of 2 ATRs with different periods. It's useful in detecting short term volatility and

SL Gold Scalper EA is optimized to trade GOLD (XAUUSD) asset. Based on the analysis of the market behavior a strategy that minimizes loss trades to successfully implement the martingale method. Multi-time frame analysis included for higher percentage of safe entries avoiding stop loss (SL) hunting from the market makers.
Expert Advisor Recommended Guide lines ================================================ Input Settings: MagicNumber => (Unique number per chart e.g 34505)
XAUUSD => 4 Hour Ch
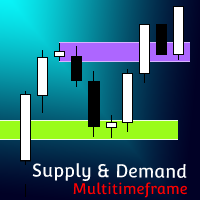
[ MT4 Version ] Supply and Demand Multitimeframe Supply and Demand Multitimeframe is the first indicator in the market that combines multiple aspects like trading volume, price structure and momentum to identify Supply and Demand zones for every asset. The Supply and Demand indicator analyzes simultaneously up to 4 different TFs and represents their information in the current graph. Its interactive UI highlights everytime the price enters a Supply or Demand zone even if the zones are not visible

Indicator and Expert Adviser EA Available in the comments section of this product. Download with Indicator must have indicator installed for EA to work.
Mt5 indicator alerts for bollinger band and envelope extremes occurring at the same time. Buy signal alerts occur when A bullish candle has formed below both the lower bollinger band and the lower envelope Bar must open and close below both these indicators. Sell signal occur when A bear bar is formed above the upper bollinger band and upper
FREE
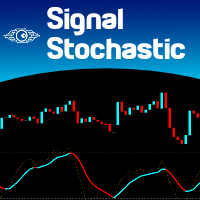
It is the very same classic Stochastic indicator, but with a little twist: we changed the Signal Line with a 2-color line, so we can use it with EAs as a filtering system. And that's it! I know it could seem stupid but I needed that, so I created it. The original formula is right from Metaquote's chest, no additions, no subtractions, it is Stochastics in its core.
So I will not publish here the Stochastics parameters as they are all the same as always... Enjoy!
If you like this indicator, all I
FREE

• Please test the product in the Strategy Tester before purchasing to understand how it works.
• If you face any issues, contact me via private message—I’m always available to help.
• After purchase, send me a screenshot of your order to receive a FREE EA as a gift.
Time frame: M1
Leverage : Higher the better
Spread: Lower the better
Account type : All types
(EA may enter hedge positions, if you want to
Application with Close Button.
Program include parameters to change settings:
Robot work with Symbols: - All Symbols - Current Chart Symbol
Transaction close (Profit/Loss): - All - Close Profit Only - Close Losing Only
Retries - max retries to close all transaction Sleep - time in ms between next Retries
Robot is free.
Robot designed for learn publish robots in Market.
FREE

Script for Metatrader 5. One click to Delete the background grid and object, all objects on the chart such as Trend lines you have drawn or created by another program arrows text Fibonacci lines removes the background grid making a clearer clean chart horizontal and vertical lines
Easy for clearing a chart or when opening new charts. Please leave a review on how its working.
FREE
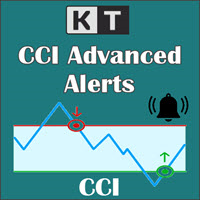
KT CCI Alerts is a personal implementation of the Commodity Channel Index (CCI) oscillator that provide signals and alerts on four custom events: When CCI enter in an overbought zone. When CCI exit from an overbought zone. When CCI enter in an oversold zone. When CCI exit from an oversold zone.
Features A perfect choice for traders who speculate the CCI movements within an overbought/oversold zone. Lightly coded without using extensive memory and resources. It implements all Metatrader alerts.
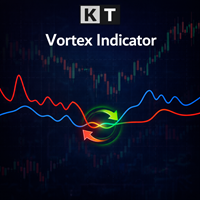
The Vortex Indicator was first presented by Douglas Siepman and Etienne Botes in January 2010 edition of Technical Analysis of Stocks & Commodities. Despite its based on a complex implosion phenomenon, the vortex is quite simple to interpret. A bullish signal is generated when +VI line cross above the -VI line and vice versa. The indicator is mostly used as a confirmation for trend trading strategies. The Vortex was inspired by the work of Viktor Schauberger, who studied the flow of water in tur

• Please test the product in the Strategy Tester before purchasing to understand how it works.
• If you face any issues, contact me via private message—I’m always available to help.
• After purchase, send me a screenshot of your order to receive a FREE EA as a gift.
Time frame: M1
Leverage : Higher the better
Spread: Lower the better
Account type : All types
(EA may enter hedge positions, if you want to
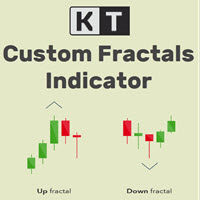
KT Custom Fractals is a personal implementation of the Fractal indicator first introduced by Bill Williams. With KT Custom Fractals you can choose a custom number of bars to allow to the left and right side of the fractal. For example, you can display the fractals that have "three" successive bars with the highest high in the middle and one lower high on both sides , or you can display the fractals that have "Eleven" consecutive bars with the lowest low in the middle and five higher lows on bot

KT Fractal Channel Breakout draws a continuous channel by connecting the successive Up and Down fractals. It provides alerts and also plots the Up and Down arrows representing the bullish and bearish breakout of the fractal channel.
Features
If you use Bill Williams fractals in your technical analysis, you must also include it in your trading arsenal. It can be very effective and useful for stop-loss trailing. A new market trend often emerges after a fractal channel breakout in a new direction.
Mago B3 Trader é um robô especialista baseado na estratégia do trader Dantas . A estratégia é baseada em cruzamento de médias móveis , com estabelecimento de stops fixos (alvo e stoploss). Além disso, é possível configurar o stoploss para ser dinâmico conforme análise de velas anteriores (máximas e mínimas). As funcionalidades de daytrade, habilitar apenas ordens de compra ou venda, bem como definição de horários para trades também podem ser configuradas. Funciona tanto para Miniíndice WIN , qua
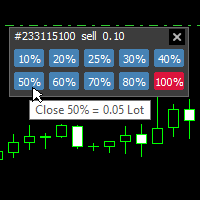
With this tool, you can easily and quickly close part of the trade. Click near the trade to display the closing panel. There are ten preset values for partial closing, but you can set your own values. You can also resize the panel according to Windows settings (125%, 150% ...) See the animation below for how it works. **********************************************************
Note: This tool does not work in the tester.

• Please test the product in the Strategy Tester before purchasing to understand how it works.
• If you face any issues, contact me via private message—I’m always available to help.
• After purchase, send me a screenshot of your order to receive a FREE EA as a gift.
Time frame: M1
Leverage : Higher the better
Spread: Lower the better
Account type : All types
(EA may enter hedge positions, if you want to
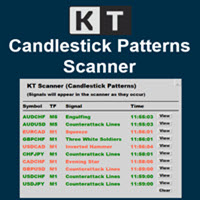
KT Candlestick Patterns Scanner is a Multi-Symbol and Multi-Timeframe scanner that fetches and shows various candlestick patterns on 28 currency pairs and 9 time-frames concurrently . The scanner finds the candlestick patterns by loading the KT Candlestick Patterns indicator as a resource in the background.
Features
The scanner can find the candlestick patterns on 252* combinations of symbols and time-frames from a single chart. Open the signal's chart loaded with a predefined template with a s

• Please test the product in the Strategy Tester before purchasing to understand how it works.
• If you face any issues, contact me via private message—I’m always available to help.
• After purchase, send me a screenshot of your order to receive a FREE EA as a gift.
Time frame: M1
Leverage : Higher the better
Spread: Lower the better
Account type : All types
(EA may enter hedge positions, if you want to
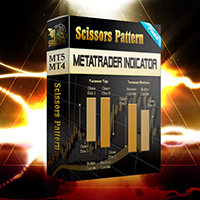
Configure scaffolding charts and signals based on the scissor pattern, which works great at low times.
Buy and sell signs based on 2 previous candle patterns
It works on the active time form, and when detecting the pattern in 4 time frames, 5 minutes, 15 minutes, 30 minutes and one hour, the alert can be set to notify us of the formation of this pattern.
MetaTrader version 4 click here
How to use:
When there is an opportunity to buy or sell, the marker places a scissors mark on the candle

• Please test the product in the Strategy Tester before purchasing to understand how it works.
• If you face any issues, contact me via private message—I’m always available to help.
• After purchase, send me a screenshot of your order to receive a FREE EA as a gift.
Time frame: M1
Leverage : Higher the better
Spread: Lower the better
Account type : All types
(EA may enter hedge positions, if you want to

• Please test the product in the Strategy Tester before purchasing to understand how it works.
• If you face any issues, contact me via private message—I’m always available to help.
• After purchase, send me a screenshot of your order to receive a FREE EA as a gift.
Time frame: M1
Leverage : Higher the better
Spread: Lower the better
Account type : All types
(EA may enter hedge positions, if you want to

With this indicator you have displayed on the chart the optimal lot size for the forex pair. No need for manual calculations or losing time on websites where you have to input the values to get the optimal lot size. The indicator values are preset for maximum percentage risk is 2% and for maximum pips loss is 50. For a customizable version you can buy using the this LINK . ATTENTION: This only works with forex pairs and it doesn't work on account deposits in YENS!!!!!!
FREE

With this indicator you have displayed on the chart the optimal lot size for the forex pair. No need for manual calculations or losing time on websites where you have to input the values to get the optimal lot size. When adding the indicator to your chart change the values for maximum risk percentage (lossPrc) and for maximum loss in pips (lossInPips). If you like to try first the indicator you can download by clicking on this LINK . ATTENTION: This only works with forex pairs and it doesn't wor
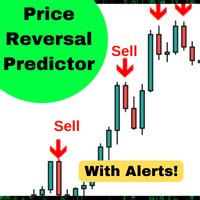
This algorithm predicts short term changes in price with a 90%* accuracy. Predicts if price will be higher or lower than the signal candle. Perfect for mean reversion trading, binary options or futures contracts on larger time frames. The indicator was backtested on 5 years of data and has a 90% accuracy for predicting price reversals over time. Features: Simple setup Drag and drop onto any chart Enable alerts (optional) And you're done! Visual and audio alerts Alerts sent directly to your phon
FREE

DYJ CashRegisterEA works on DYJ technical indicators. When the market is strong ,
this EA find's the opportunity and trade in safe market. Consistent earning with safe time of trading.
EA uses one order mode to minimize transaction volume and maximize profit closing algorithm strategy.
No grid trading.
No arbitrage.
No Hedge. No Martingale. Please download the setting file and the PDF file of the back test report in the product comment area
Recommendations
Synthetic and Forex . Developed
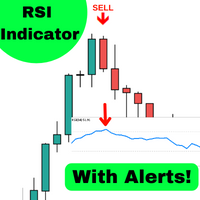
This free algorithm predicts short term changes in price with a 86%* accuracy. When there is a large move as determined by the ATR, during an overbought or oversold condition, the indicator will alert you. Predicts if price will be higher or lower than the signal candle. Perfect for mean reversion trading, binary options or futures contracts on larger time frames. The indicator was backtested on 5 years of data and has a 90% accuracy for predicting price reversals over time. Features: Simple set
FREE

KT Auto SL TP EA adds a stop loss and a take profit to every manual trade, then moves the stop to break even and trails it. Open a trade on your computer or on your phone. Moments later the stop loss and take profit are on it, and the label on your chart shows the exact settings in use. The EA never opens or closes a trade on its own. What it does Adds your stop loss and take profit to market trades and pending orders, on the chart symbol or on every symbol from one chart. Manages your manual tr
Clear MACD Momentum Signals KT MACD Alerts helps traders recognize changes in market direction and momentum through a clean, color-coded MACD display. Bullish and bearish crossovers are easy to identify, while vertical chart lines and flexible alerts help bring each new signal to your attention. Signals are confirmed after the candle closes, giving you a clear and consistent view of MACD momentum changes across the chart. Color-coded bullish and bearish MACD display. Clear vertical lines for qui
Overview: Straddle scalper is an EA opening straddles at particular hours and /or days.
The Take Profit is dynamically generated using ATR ratio. Requirements: A hedging account is needed in order to open straddles.
A strict optimization (in open prices) is mandatory. What is a straddle ? A straddle is the action to open a Buy and a Sell at the same time. How does this EA works ? After being successfully optimized, the EA will open a straddle at each new bar (H1 Timeframe) designated by optimiza

KT Coppock Curve turns a smoothed momentum reading into a clear view of market direction. It runs in a separate window below the price chart, where the zero line becomes the main reference. Instead of reacting to every small change in the curve, you can quickly see whether momentum is holding on the bullish or bearish side. The curve combines longer and shorter rate-of-change readings and smooths the result. This makes it useful for following broader momentum shifts while reducing some of the no

THIS EA HAD A WINRATE OF 80% !!!
How to use: The EA must be attached to ONLY one chart Symbol must be EURUSD . Timeframe should be M5. Minimum deposit 100 USD. Recommended leverage 1:50 - 1:500. The EA should run on a VPS continuously. Recommended Inputs:
Use Risk Percent: true Risk Percent: 1 Lot Size: 0.01 Target Points: 100 Magic Number: 123456789
Recommended broker: XM or any broker that has a lower spread. If you choose XM as your broker please select MT5 for trading platform type an

ROC looks at how quickly price has changed compared with an earlier period. That makes it especially useful when price reaches a new swing high or low but the momentum behind the move does not confirm it. KT ROC Divergence finds these disagreements automatically and draws matching lines on the price chart and in the ROC window. Unlike oscillators that stay inside a fixed range, ROC expands and contracts with the speed of the market. You do not need to compare the raw value from one symbol to ano
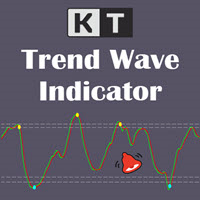
Follow Trend Wave Crossovers in Their Market Context KT Trend Wave turns price movement into a focused oscillator with a main wave and a smoothed signal line. It appears in a separate pane below the price chart, keeping the trend wave, reference areas and crossover markers clear without covering the candles. Read the Lines, Zones and Markers Together Lime main line: Shows the faster trend wave response. Red signal line: Smooths the wave so changes in direction are easier to compare. Aqua upward

Introducing Spread Screener and Candle Time Indicator - your all-in-one solution for seamless forex trading analysis! Designed with traders like you in mind, this cutting-edge tool revolutionizes the way you monitor spreads and track server time across multiple currency pairs. Best of all, it's completely free to download! Spread Screener empowers you to effortlessly monitor the spread of multiple currency pairs simultaneously. No more tedious switching between charts or guessing which pairs off
FREE
Advanced Relative Vigor Index (RVI) Indicator with dual-line signals, zero-level system, multi-timeframe support, customizable visual signals, and highly configurable alert system.
Freelance programming services, updates, and other TrueTL products are available on my MQL5 profile .
Feedback and reviews are highly appreciated!
What is the Relative Vigor Index (RVI)? The Relative Vigor Index (RVI) is a momentum oscillator developed by John Ehlers that measures the conviction of a recent price m
FREE

See which forex session you are trading in, and how many pips each session moved, right on your MetaTrader 5 chart. KT Forex Sessions MT5 is a session indicator that draws the Tokyo, London and New York sessions as colored boxes and writes the size of each session in pips on its box. The indicator reads your broker's GMT offset by itself, and every session follows its own city's local time and summer time. The boxes stay in the right place all year, with nothing to set. What you see on your char
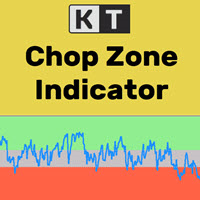
It's a well-known fact that most of the financial markets trend only 30% of the time while moving in a closed range rest 70% of the time. However, most beginner traders find it difficult to see whether the markets are trending or stuck in a range. KT Chop Zone solves this problem by explicitly highlighting the market phase into three zones as Bearish Zone, Bullish Zone, and Chop Zone.
Features
Instantly improve your trading by avoiding trade during the sideways market (Chop Zone). You can also
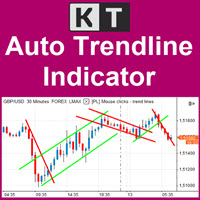
Keep Important Trendlines Updated on Your Chart KT Auto Trendline automatically builds an upper and lower trendline from recent ZigZag swing points, then projects both lines forward on the active chart. This gives you a clear structure for watching developing breakouts, rejections and changes in price direction without redrawing the same lines by hand. Follow Shorter and Broader Swing Structure Together The first trendline set is enabled by default and uses a responsive ZigZag configuration. Whe

KT Heiken Ashi Alert plots the buy and sell arrows and generate alerts based on the standard Heiken Ashi candles. Its a must use tool for the traders who want to incorporate Heiken Ashi in their trading strategy. A buy arrow plotted when Heiken Ashi change to a bullish state from bearish state. A sell arrow plotted when Heiken Ashi change to a bearish state from bullish state. Mobile notifications, Email, Sound and Pop-up alerts included.
What exactly is Heiken Ashi? In Japanese, the term Heike

KT Pip Counter is a simple and informative indicator that shows some essential data and numbers on a real-time basis. Such critical information and data can benefit a trader during an intense trading session.
Features
Shows the current profit/loss in currency, pips, and percentage. Shows the current spreads. Shows the remaining time in the closing of the current bar. The different color schemes for profit/loss scenario. The text position and layout can be fully customized. It uses minimum CPU

KT Pivot Points automatically plots the daily, weekly, and monthly pivot levels on a chart with the precise calculation based on the latest data. Pivot points is a widely used indicator in technical analysis, particularly in the Forex market.
Features
Send alerts when the price touches the pivot level. It offers complete customization for each kind of pivot level. Shows daily, weekly, and monthly pivot levels without any fuss. It uses minimum CPU resources for faster calculation. Compatible
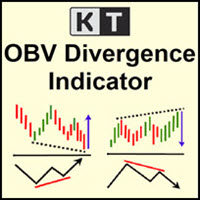
KT OBV Divergence shows the regular and hidden divergences build between the price and OBV - On Balance Volume oscillator.
Features
Unsymmetrical divergences are discarded for better accuracy and lesser clutter. Support trading strategies for trend reversal and trend continuation. Fully compatible and ready to embed in an Expert Advisor. Can be used for entries as well as for exits. All Metatrader alerts are available.
What is a Divergence exactly?
In the context of technical analysis, if the

The KT Currency Strength Meter measures the individual currencies' strength and weakness by applying an aggregated mathematical formula over the major FX pairs. The strength is calculated using the bullish and bearish candles over a fixed period. After filling up the strength data, an algorithm sorts out the strongest and weakest currencies in a stack and updates their orders using the real-time incoming data.
Advantages
Improve your trading strategy instantly by filtering out the signals that
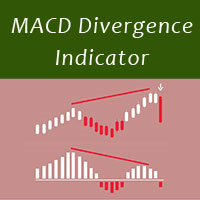
MACD divergence indicator finds divergences between price chart and MACD indicator and informs you with alerts (popup, mobile notification or email) . Its main use is to find trend reversals in the chart. Always use the divergence indicators with other technical assets like support resistance zones, candlestick patterns and price action to have a higher possibility to find trend reversals. Three confirmation type for MACD divergences: MACD line cross zero level Price returns to previous H/L Crea
FREE

Stargogs Spike Catcher EA V3 !!!PLEASE MESSAGE ME AFTER PURCHASING THE EA I WILL HELP AND SET IT UP FOR YOU OR I'LL SEND YOU THE RIGHT SETFILES!!! !!! IMPORTANT THIS ROBOT WON'T WORK OR MAKE PROFIT WITH DEFAULT SETTINGS!!! With The Right Settings so that you can make your daily or monthly Income. This Is the best version so far. With the right Parameters you won't fail. I will also show you the results. In Version 3.0 you can Switch on/off to Choose on which indices to catch spikes on Boom and
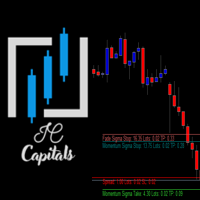
Key Features: Multi-Target Volatility: Configure multiple Take Profit and Stop Loss levels based on real-time market volatility. Fully Customizable: Set specific volatility multipliers (e.g., 4x for Stop, 10x for Take) using any look-back period (e.g., previous 20 bars on a 2-minute chart). Clear Visuals: Assign unique names to each level to be displayed directly on your symbol's chart for easy monitoring. Consistency: Every level calculated is synchronized with the volatility of your chosen per
FREE

Volume profile indicator that tells you which levels price is likely to reach today. Daily profiles with POC, VAH and VAL, naked POCs and a drag box for any range, and every level labelled with how often price reached a level at that distance on your own chart. What you see on the chart A profile for every day on M1 to H1 charts, with the value area in a stronger colour. Yesterday's POC, VAH and VAL across today, each with its odds for today, or "reached" once price gets there. Naked POCs: earli

The market eagle - it is a Secure Automated Software for trade Forex market and indices.This EA takes perspective of the market looking like an eagle. From a distance, observe the entire market amphitheater detecting the entry points and the best points to implement the algorithm based on the set that we indicate in the input.This system allows us to use the key points of the market to adapt them to our algorithms, trend and countertrend. The system uses multiple lot depending on the algorithm
MACD Divergence Scanner is a multi-timeframe and multi-symbol dashboard and alert that checks all timeframes and symbols to find regular and hidden divergences between price chart and MACD indicator. This divergence scanner is integrated with support and resistance zones so you can check the MACD divergences in the most important areas of the chart to find trend reversals in the price chart. Download demo version (works on M4,M6,M12,M20,H3,H8 timeframes of 20 symbols of Market Watch window)
Tick Chart Monitor with countdown tick volume and easy to change tick size without going back to main chart. This work with Tick Chart Generator , which are available for download from the MQL5 Market: Tick chart generator: https://www.mql5.com/en/market/product/79763 NOTE: Custom symbols on MT5 are not directly tradable. This is by Metatrader5 design. If you want to place trades directly on the custom symbol generated by this product, you will either need a trade panel that offers this functi
FREE
EA create custom Tick bar charts and provide real-time updates for MT5. This is an MT4 "offline" chart equivalent which is very simple to use. Generated Tick bar Chart compatible to MT5 indicator or template and perform your technical analysis with Multi timeframe analysis. The generator uses tick data to plot the historical tick chart for a particular setting and live ticks for plotting live charts. This method of calculation gives very accurate charts as no approximation is used. This EA creat
Tick imbalance bars (TIB), described in the book Advances in Financial Machine Learning (2018) by Marcos López de Prado. Indicator that show candlestick bars with an different sampling method than time fixed. Real time data is sourced to the indicator and it may be used as substitute of the default graph. Each bar is formed when a predefined tick balance is exceeded, showing in the graph the OHLC of this cluster of ticks. The input variable is the amount of ticks of each bar. The indicator may
FREE
Assistant_for_Reopen - an Expert Advisor that helps to re-set pending orders. Many brokers force the order to expire at the end of the trading session or at the end of the trading day. Therefore, a trader has to restore all pending orders manually every time at the beginning of a new trading session. Assistant_for_Reopen frees the trader from this routine work. It controls expiration by the order expiration time and resets it if the trader ticked the checkbox. The maximum number of orders the EA
FREE
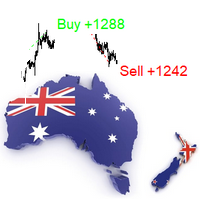
The indicator is a trading system for AUDUSD or NZDUSD currency pairs.
The indicator was developed for time periods: M15, M30.
At the same time, it is possible to use it on other tools and time periods after testing.
"Kangaroo Forex" helps to determine the direction of the transaction, shows entry points and has an alert system.
When the price moves in the direction of the transaction, the maximum length of the movement in points is displayed.
The indicator does not redraw, all actions occ

Market Momentum Alerter Market Momentum Alerter will inform you about danger to operate in the market.
Imagine you see a very nice setup (Forex, Stocks, Indices) and you decide to place your trade...
And you finally lose your trade and don't understand what happened.
This can happen due to big operations in the market carried out by banks and big institutions.
These operations are invisible for most people.
Now with the Market Momentum Alerter you will be able to detect those operations...

show live chart spot All symbol binance If you want to get this product with a 99% discount, send a message to my Telegram admin and rent this product for 1 $ per month or 10 $ per year. Even if you do not like the way the chart is displayed, you can tell the admin in Telegram how to display it so that your own expert is ready. https://t.me/Bella_ciao1997 https://t.me/Binance_to_mql5

Only 5 copies of the EA at $30! Next price --> $45 This robot works on the basis of bowling band and has stepped entrances at safe points.
benefits:
Works on all instruments and time series,
It has excellent inputs for position management that can avoid a lot of risk.
Input settings:
Volume: Selects a fixed volume for the trade that uses its own risk management if it is zero.
Risk for all positions: The amount of risk for all positions in one direction, for exam

BEHOLDD!!!!!!!
Investogenie is now in the Market. The Profound Algorithm designed in investogenie helps in scalping in the quiet time at night with a Stop Loss. The Markets conditions help the EA to decide taking the entries and exits at the proper time. Backtests and results are evident of the strength of the product.
Live results will be updated soon.
RECOMMENDATION
PAIRS: All Currency pairs
TIMEFRAME: This is Designed on M5 only
Use the set file in comment 3 or DM me
LIVE MONITORING
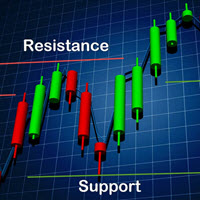
Be sure to consult with me before buying.
The robot trades based on support and resistance levels. You can use weekly and monthly times for less risk. More risk in daily and 4-hour times. Be sure to disable the robot at news times.Works on all currency pairs, indices, commodities and metals. Only observing the trade at the time of news will make this robot profitable. Automatic news management will be added in future versions.
benefits:
Works on all instruments and time series,
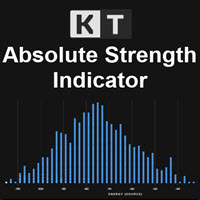
KT Absolute Strength measures and plots the absolute strength of the instrument's price action in a histogram form. It combines the moving average and histogram for a meaningful illustration. It supports two modes for the histogram calculation, i.e., it can be calculated using RSI and Stochastic both. However, for more dynamic analysis, RSI mode is always preferred.
Buy Entry
When the Absolute Strength histogram turns green and also it's higher than the previous red column.
Sell Entry
When th
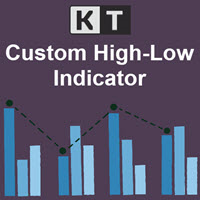
KT Custom High Low shows the most recent highs/lows by fetching the data points from multi-timeframes and then projecting them on a single chart. If two or more highs/lows are found at the same price, they are merged into a single level to declutter the charts.
Features
It is built with a sorting algorithm that declutters the charts by merging the duplicate values into a single value. Get Highs/Lows from multiple timeframes on a single chart without any fuss. Provide alerts when the current pri
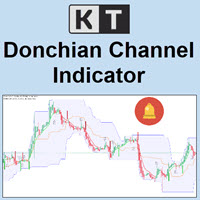
KT Donchian Channel is an advanced version of the famous Donchian channel first developed by Richard Donchian. It consists of three bands based on the moving average of last high and low prices. Upper Band: Highest price over last n period. Lower Band: Lowest price over last n period. Middle Band: The average of upper and lower band (Upper Band + Lower Band) / 2. Where n is 20 or a custom period value is chosen by the trader.
Features
A straightforward implementation of the Donchian channel ble
The MetaTrader Market is a unique store of trading robots and technical indicators.
Read the MQL5.community User Memo to learn more about the unique services that we offer to traders: copying trading signals, custom applications developed by freelancers, automatic payments via the Payment System and the MQL5 Cloud Network.

You are missing trading opportunities:
- Free trading apps
- Over 8,000 signals for copying
- Economic news for exploring financial markets
Registration
Log in
You agree to website policy and terms of use
If you do not have an account, please register