 MetaTrader 5
 Experts
 Indicatori
 librerie
 Utilità
 Widget
 Regole
Guarda i video tutorial del Market su YouTube
Come acquistare un Robot di Trading o un indicatore
Esegui il tuo EA
hosting virtuale
hosting virtuale
Prova un indicatore/robot di trading prima di acquistarlo
Vuoi guadagnare nel Market?
Come presentare un prodotto per venderlo con successo
Nuovi Expert Advisors e Indicatori per MetaTrader 5 - 520
 Usa i robot di trading e gli indicatori per rendere il trading sul Forex più redditizio. I robot di trading ti permettono di automatizzare l'apertura e la chiusura delle transazioni, e gli indicatori ti aiutano a prevedere con maggior precisione il comportamento del mercato. La pagina contiene il catalogo delle applicazioni MetaTrader 5.
Trend Hunter è un indicatore di tendenza per operare sui mercati Forex, metalli preziosi, criptovalute e CFD. L'indicatore è progettato per determinare la direzione corrente del mercato, individuare i cambiamenti di trend e trovare ulteriori punti di ingresso all'interno di un movimento già formato. L'indicatore non ridisegna i segnali e lavora sulle barre chiuse. Una volta formato, un segnale non viene modificato da piccole oscillazioni del prezzo all'interno della barra successiva. Funzioni pr

Two Dragon is an advanced indicator for identifying trends, which uses complex mathematical algorithms. It works in any timeframe and symbol. Indicator is designed with the possibility to customize all the parameters according to your requirements. Any feature can be enabled or disabled. When a Buy / Sell trend changes the indicator will notify using notification: Alert, Sound signal, Email, Push. Product reviews are welcome. We hope you will find it useful. МetaТrader 4 version: https://www.mq

The indicator displays points showing a symbol trend. Bullish (blue) points mean buy signals. Bearish (red) points mean sell signals. I recommend using the indicator in conjunction with others. Timeframe: M30 and higher. Simple strategy: Buy if there are two blue points on the chart. Sell if there are two red points on the chart.
Parameters Trend points period - The main period of the indicator; True range period - The auxiliary period of the indicator; Points calculation method - Calculation m

Trend indicator. Displays a two-colored line on the chart, which shows the market direction. The blue color shows the uptrend. The red, respectively, shows the downtrend. It is recommended to use on charts with the M30 timeframe or higher. Simple strategy: When the line changes its color to blue, buy. When it changes to red, sell.
Parameters Trend Uncover period - period of the indicator;

The Expert Advisor modifies the Stop Loss orders of positions opened for the instrument of the current chart based on the custom indicator values. It is possible to use both the default settings or your own. Integrates NRTR (Nick Rypock Trailing Reverse) , Moving Average indicators and linear regression channel. Attention! To use the adviser, you must have minimal knowledge! Namely, to be able to look into the indicator code. You need to know the indicator buffer number in which support values a

Elliott Wave Trend was designed for the scientific wave counting. This tool focuses to get rid of the vagueness of the classic Elliott Wave Counting using the guideline from the template and pattern approach. In doing so, firstly Elliott Wave Trend offers the template for your wave counting. Secondly, it offers Wave Structural Score to assist to identify accurate wave formation. It offers both impulse wave Structural Score and corrective wave Structure Score. Structural Score is the rating to sh

Trend indicator. Designed for long-term trading. It is recommended to use on a chart with the M30 timeframe or higher. When the red line crossed the green line below the zero mark, and the green line, respectively, crosses from above, then it is a buy signal. When the green line crossed the red line above the zero mark, and the red line, respectively, crosses from above, then it is a sell signal.
Parameters Indicator period - period of the indicator. (The greater the period, the more long-term
This innovative technical indicator was created to detect quiet market period before the beginning of the high volatile market. Like many good technical indicators, this Market Activity Index is very stable and it is widely applicable to many financial and non financial instruments without too much restriction. The Market Activity Index can be used best to visualize the alternating form of low and high volatile market. It is very useful tool to pick up the quiet market but ironically this is the

If you wish to draw Support and Resistance lines, view: daily market opening, classical pivot levels, Fibonacci pivot levels, trend lines, Fibonacci levels, the remaining time to candle closing, and current spread. If you seek to place your orders with the exact lot that meets your desired stop loss risk. If you wish to do all this and more with just one click, then this is the perfect tool to use. This tool will allow you to feel more relaxed when deciding to open orders, as well as predicting

Extremum Scalper is a fully automated Expert Advisor, that uses a dynamic MM, probabilistic analysis and also strategy of breakout/rebound from the levels of daily and local extremes, and the candlestick Highs. The price Highs and the tick volume serve as the analyzed parameters. Works in different markets with all trade execution modes. Does not use martingale or hidden methods of increasing the position volume. The EA has 9 different extremum calculation algorithms. Uses a drawdown protection,
FREE

Partial Close Expert è uno strumento che combina numerose funzioni in un unico sistema automatizzato. Questo EA può aiutare i trader a gestire le proprie posizioni in modo più efficace, offrendo molteplici opzioni per gestire il rischio e massimizzare i potenziali guadagni. Con Partial Close Expert, i trader possono impostare un chiusura parziale livello per bloccare i profitti, un stop mobile livello per proteggere i profitti e limitare le perdite, un pareggiare
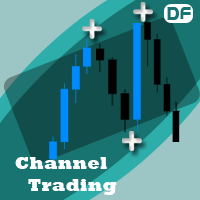
This Expert Advisor follows your channel lines that you draw. and when the price reaches these support and resistance trend lines, EA send open or close order automatically. You must draw two trend line with same color for EA to work, not equidistant channel line. and this color must be specified in ChannelColor parameter Strategies:
Inside Channel Strategy: If the price reaches bottom trend line, the EA will place a buy order. and when the price reaches the top trend point, EA send close order
FREE

The Supply and Demand Zones indicator is one of the best tools we have ever made. This great tool automatically draws supply and demand zones, the best places for opening and closing positions. It has many advanced features such as multi timeframe zones support, displaying the width of zones, alert notifications for retouched zones, and much more. Because of market fractality, this indicator can be used for any kind of trading. Whether you are a positional, swing, or intraday trader does no

Fibo Trader is an expert advisor that allows you to create automated presets for oscillation patterns in reference to Fibonacci retracements values using fully automated and dynamically created grid. The process is achieved by first optimizing the EA, then running it on automated mode. EA allows you to switch between automatic and manual mode. When in manual mode the user will use a graphical panel that allows to manage the current trading conditions, or to take control in any moment to trade ma
FREE

Fibo Trader is an expert advisor that allows you to create automated presets for oscillation patterns in reference to Fibonacci retracements values using fully automated and dynamically created grid. The process is achieved by first optimizing the EA, then running it on automated mode. EA allows you to switch between automatic and manual mode. When in manual mode the user will use a graphical panel that allows to manage the current trading conditions, or to take control in any moment to trade ma

Fibo Trader is an expert advisor that allows you to create automated presets for oscillation patterns in reference to Fibonacci retracements values using fully automated and dynamically created grid. The process is achieved by first optimizing the EA, then running it on automated mode. EA allows you to switch between automatic and manual mode. When in manual mode the user will use a graphical panel that allows to manage the current trading conditions, or to take control in any moment to trade ma

The Gravity EA is a multifunctional tool for automatic and semi-automatic implementation of Pairs Trading strategies. If you do not know what Pairs Trading is, look it up on the Internet to avoid misunderstandings.
The EA comprises: the ability to enable/disable the manual trading mode. You can open and close positions yourselves, based on the indicator values, or it can happen automatically. automatic money management automatic calculation of the optimum delta, the ability to manually specify

WARNING: Product is out of support! Don't buy it unless you know how it works! Please download free version and test it heavily - it is enough for most uses.
Grid Harvester is an advanced trading robot, that uses grid trading to harvest maximum out of trending and oscillating markets. This method of trading is often used to attain high percentage account growths by social traders on a highly unpredictable markets, where simple buy/sell robots are having hard time operating. It can be also use

The main objective of this indicator is to determine entry and exit points, that is why ExactArrow draws nothing but arrows showing entry and exit points. In spite of apparent simplicity of the indicator, it has complicated analytic algorithms which determine entry and exit points. The indicator generates exact and timely entry and exit signals which appear on the current candle. The indicator generates an average of 1-2 candles before its analogues do. The indicator is very easy to use. Open Bu

Elliott Wave Counter è un pannello per il markup manuale rapido e intuitivo delle onde di Elliott. Si può selezionare un colore e un livello di segni. Sono inoltre disponibili funzioni per la rimozione dell'ultimo markup e dell'intero markup effettuato dallo strumento. Il markup viene eseguito con un clic. Fai clic cinque volte: ottieni cinque onde! Elliott Wave Counter sarà un ottimo strumento sia per i principianti che per gli analisti professionisti delle onde di Elliott. Guida all'installazi

This is an arbitrage indicator. The indicator displays the chart of an arbitrary combination of trading instruments, described by the entered arithmetic formula. Using the indicator. Add an indicator to any chart. Enter the formula as a string in the indicator's parameters. All symbols used in the formula must exactly match the names in the table "Market Overview" of the terminal. Example of the formula: (SIBN + SNGS) / 'RTS-3.19' + 2.5 * GAZP / LKOH Start the indicator The formula must meet the
FREE

Lo strumento di analisi con un clic è un creazione di oggetti basata su scorciatoie da tastiera e strumento di copia per MetaTrader. Semplifica l'utilizzo degli strumenti di analisi in MetaTrader con un semplice clic. Con il nostro strumento, puoi disegnare rapidamente livelli di supporto e resistenza, livelli di Fibonacci, forme, canali, linee di tendenza e tutti gli altri oggetti sul tuo grafico. Basta fare clic sul pulsante, spostare il mouse e One Click Analysis Tool farà il rest

Draw Agent è progettato come un modo bello e innovativo per creare e gestire tutte le analisi dei grafici, gli scarabocchi, le note e altro ancora. Questo strumento fornisce un metodo di disegno a mano libera, per trattare lo spazio del grafico come una lavagna e disegnare a mano. Questo strumento di disegno a mano libera ti consente di disegnare sui grafici MT4/MT5, al fine di contrassegnare o evidenziare gli eventi sul grafico. È uno strumento utile se ti piace disegnare manualmente le onde
Introduction to Support Resistance Indicator Support and Resistance are the important price levels to watch out during intraday market. These price levels are often tested before development of new trend or often stop the existing trend causing trend reversal at this point. Highly precise support and resistance are indispensable for experienced traders. Many typical trading strategies like breakout or trend reversal can be played well around these support and resistance levels. The Precision Sup
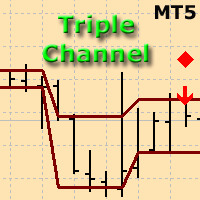
The indicator plots three consecutive channels by Close prices and checks if they match the scheme shown in the screenshots. The length of each channel is not fixed and is selected by the program within the range ChMin and ChMax . When the match is found, a signal is formed (an appropriately colored arrow). A possible stop loss level is displayed as a diamond. A signal may be accompanied by a pop-up window, a push notification and/or an email. The indicator works by Open prices.
Parameters ChMi

The indicator detects and displays М. Gartley's Butterfly pattern. The pattern is plotted by the extreme values of the ZigZag indicator (included in the resources, no need to install). After detecting the pattern, the indicator notifies of that by the pop-up window, a mobile notification and an email. The pattern and wave parameters are displayed on the screenshots. The default parameters are used for demonstration purposes only in order to increase the amount of detected patterns.
Parameters z

Friends, join us!
Ask questions and connect with like-minded traders: MetaCOT Public Group
MetaCOT Information Channel: news, CFTC reports, and signals: MetaCOT Channel
Here’s to successful trading and new profitable signals for us all! Attention! Recently, certain countries have been blocking access to the cftc.gov website. As a result, users in these countries are giving the product low ratings. MetaCOT has always adhered to the highest quality standards and is in no way associated with th

The indicator detects divergence signals - the divergences between the price peaks and the MACD oscillator values. The signals are displayed as arrows in the additional window and are maintained by the messages in a pop-up window, e-mails and push-notifications. The conditions which formed the signal are displayed by lines on the chart and in the indicator window.
The indicator parameters MacdFast - fast MACD line period MacdSlow - slow MACD line period MacdSignal - MACD signal line period Macd
L'indicatore consente di determinare la direzione del prezzo corrente e la volatilità del mercato. Questa versione del Traders Dynamic Index ha eliminato il ridisegno dei dati storici, ottimizzata la velocità di calcolo dell'algoritmo, più parametri esterni per un aggiustamento più preciso e le sue funzionalità estese: aggiunta la selezione dell'oscillatore iniziale e le modalità di smoothing delle medie . Parametri: Mode Osc - stima della selezione dell'oscillatore Period Osc - il periodo di ca

Friends, join us!
Ask questions and connect with like-minded traders: MetaCOT Public Group
MetaCOT Information Channel: news, CFTC reports, and signals: MetaCOT Channel
Here’s to successful trading and new profitable signals for us all! Attention! Recently, certain countries have been blocking access to the cftc.gov website. As a result, users in these countries are giving the product low ratings. MetaCOT has always adhered to the highest quality standards and is in no way associated with th
FREE

Friends, join us!
Ask questions and connect with like-minded traders: MetaCOT Public Group
MetaCOT Information Channel: news, CFTC reports, and signals: MetaCOT Channel
Here’s to successful trading and new profitable signals for us all! Attention! Recently, certain countries have been blocking access to the cftc.gov website. As a result, users in these countries are giving the product low ratings. MetaCOT has always adhered to the highest quality standards and is in no way associated with th

The indicator displays peak levels of activity formed by the maximum volume, tracks the correlation of the candles on all timeframes (from the highest to the lowest one). Each volume level is a kind of key trading activity. The most important cluster is inside a month, week, day, hour, etc.
Indicator operation features A volume level receives Demand status if the nearest volume level located to the left and above has been broken upwards. A volume level receives Supply status if the nearest volu

The multi-timeframe indicator of the levels of the Pivot Points. Every closed daily period has its own so-called reference point - Pivot Point, which sets the levels for smaller intraday timeframes for the following day. The Pivot Points indicators existing in the codes have no method of showing the dynamics of the pivot point changes on the historical data of the price chart. Pivot Point calculation formula. Pivot=(High + Low + Close) /3 High — the maximum of the previous day; Low — the minimum
FREE

IceFX VelocityMeter Mini is a very unique indicator on MetaTrader 4 platform which measures the speed of the Forex market . It is not a normal volume or other measurement indicator because IceFX VelocityMeter Mini is capable to understand market speed movements which are hidden in ticks and those valuable information cannot be read in an ordinary way from the candles. The software monitors the received ticks (frequency, magnitude of change) within a specified time range, analyzes these info and

The indicator displays market profiles of any duration in any place on the chart. Simply create a rectangle on the chart and this rectangle will be automatically filled by the profile. Change the size of the rectangle or move it - the profile will automatically follow the changes.
Operation features
The indicator is controlled directly from the chart window using the panel of buttons and fields for entering parameters. In the lower right corner of the chart window there is a pop-up "AP" button

HiLo Activator is one of the most used indicators to determine trend. Find it here with the ability to customize period and colors. This indicator also plots up and down arrows when there is a change on the trend, indicating very strong entry and exit points. HiLo fits well to different types of periods for day trading. You can easily understand when it is time to buy or sell. It works pretty good also for other periods like daily and monthly signalizing long-term trends. The use of the indicato

The indicator shows the direction and sustainability of the trend, as well as its reversals. Use the indicator to search for successful entries, the performance bottlenecks to minimize risk and time to exit deals. The indicator is never redrawn . It is an easy-to-setup visual tool for both novice and experienced traders It fits any trading style. The indicator is displayed immediately at a candlestick open as two lines: ROAD - smoothed movement. It is drawn as a solid orange line BRIGHT - trend
Never forget to set Stop Loss or Take Profit! This little EA automatically sets predefined Stop Loss and Take Profit levels on every new pending or market order. You can specify Stop Loss and Take Profit distances in pips in the EA settings dialogue. Please note that there is only one EA necessary for all charts of the same symbol. The EA works with all symbols within Metatrader 5.

Advanced ideas of the popular MACD indicator: It detects and displays classic and reverse divergences (two methods of detecting divergences). It uses different color to highlight an uptrend and a downtrend. Two methods of determining a trend: а) MACD crosses the 0 level (classic signal); б) MACD crosses its own average (early signal). This is a multi-timeframe indicator: it can display MACD data from other timeframes. Two methods of drawing: classic histogram and line. It generates sound and vis
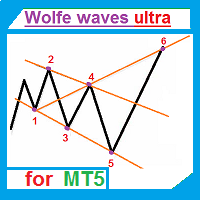
The indicator automatically draws Wolfe waves. The indicator uses Wolfe waves found in three timeframes. This indicator is especially accurate because it waits for a breakout in the wave direction before signaling the trade. Recommended timeframe: М1.
Indicator features Amazingly easy to trade. The indicator is able to recognize all the patterns of Wolfe waves in the specified period interval. It is a check of potential points 1,2,3,4,5 on every top, not only the tops of the zigzag. Finds the p

This indicator shows the time before the next bar or candle opens. Examples of the remaining time until a new bar opens: Example for the М1 timeframe: 05 = 05 seconds. Example for the Н1 timeframe: 56:05 = 56 minutes, 05 seconds. Example for the D1 timeframe: 12:56:05 = 12 hours, 56 minutes, 05 seconds. Example for the W1 timeframe: W1(06): 12:56:05 = 6 days, 12 hours, 56 minutes, 05 seconds. МetaТrader 5 version: https://www.mql5.com/en/market/product/13564 Settings color_time - Text

The Correct Entry indicator displays specific relatively correct points of potential market entries on the chart. It is based on the hypothesis of the non-linearity of price movements, according to which the price moves in waves. The indicator displays the specified points based on certain price movement models and technical data.
Indicator Input Parameters: Сorrectness – The parameter characterizes the degree of accuracy of the entry signals. Can vary from 0 to 100. The default is 100. Accurac

The indicator looks for flat zones, where the price remained within a certain range for quite a long time.
Settings History - history for calculation/display in bars FlatBars - flat area width in bars FlatRange - flat area height in pips IncludeSmallBar - calculate using internal flat bars CalcFlatType - calculate flat zones by (HIGH_LOW/OPEN_CLOSE) DistanceForCheck - distance (in pips) from the flat level, at which the check is enabled CountSignals - amount of signals per level AutoCalcRange -

Every indicator has its advantages and disadvantages. Trending ones show good signals during a trend, but lag during a flat. Flat ones thrive in the flat, but die off as soon as a trend comes. All this would not be a problem, if it was easy to predict when a flat changes to a trend and when a trend changes to a flat, but in practice it is an extremely serious task. What if you develop such an algorithm, which could eliminate an indicator's flaws and enhance its strengths? What if such an algori
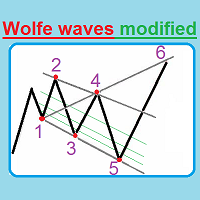
This unique indicator automatically builds Wolfe Waves and features a highly efficient trading strategy. Use If number 5 appears, wait till the first candle is closed behind Moving Average, then look at the three center lines showing what lot volume should be used if the fifth dot crossed the line 25%. The candle is closed behind Moving Average, and then we open a trade with the lot: = (Let's apply the lot of, say, (0.40), divide it into four parts and open a quarter of the lot (0.10)). If the

The draws trend lines with adjustable trend width, with trend breakout settings and notifications of trend breakout (Alert, Sound, Email) and of a new appeared arrow. Arrows point at the direction of the order to open (BUY, SELL).
Parameters MaxHistoryBars - the number of bars in the history. Depth (0 = automatic settings) - Search area. width trend ( 0 = automatic settings) - Trend width. (true = closed bars on direction trend),(false = just closed bars for line) - true = closure of candlestic
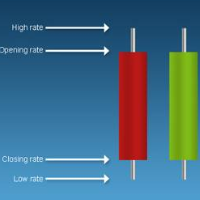
'Info body and shadow candles' indicator colors the candle bodies and shadows according to the settings. For example, if the 'Size body candles' parameter is 10, the indicator looks for the candles having a body size of 10 or more. Candle shadows are calculated the same way. Detected candles can be colored (body color, shadow color). The indicator can be adjusted for both four- and five-digit quotes. МetaТrader 4 version: https://www.mql5.com/en/market/product/12618 Parameters Use candle searc

The "Candle Pips MT5" indicator is a tool that helps us a quick way to see the size of the candles on our platform; this is not only of great help to any trader who wants to study the market thoroughly, it is helpful in various strategies that are based on size of the candles. The indicator shows the value in Pips of each candle to our current graph, rounded to an integer.
The indicator also shows the information as a histogram, at the bottom of the graph. It has simple inputs: Candle Type: t
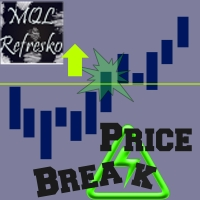
The "Price Break" indicator is a powerful tool for any trader. If the price breaks the levels the indicator shows, there is aproximatelly a 77% chance it will go in the same direction. If it exceeds the blue line, there are many possibilities for the price to rise. On the contrary, if it passes down the red line, it means that there are many possibilities for the price to drop. We should always consider the latest indicator signal, so we should rely only on the last blue arrow and the last red a

This oscillator was developed exclusively by xCalper in 2015 based on moving averages calculations to indicate and try predicting oversold and overbought levels. The fast line (white, by default) oscillates basically between values -0.5 (oversold) and +0.5 (overbought). Whenever this line crosses upward value -0.5, it means an oversold price level. When it crosses downward value +0.5, it means an overbought price level. When fast line crosses value 0.0 and returns, it is a strong pull-back indic

Bober Real MT5 is a fully automatic Forex trading Expert Advisor. This robot was made in 2014 year and did a lot of profitbale trades during this period. So far over 7000% growth on my personal account. There was many updates but 2019 update is the best one. The robot can run on any instrument, but the results are better with EURGBP, GBPUSD, on the M5 timeframe. Robot doesn't show good results in tester or live account if you run incorrect sets. Set files for Live accounts availible only for cu
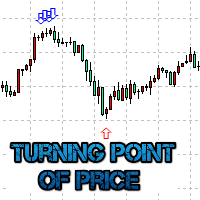
The Turning point of price indicator displays assumed turning points of the price on the chart. It is based on data of the Prise Reversal oscillator and standard ADX. When the value of Prise Reversal is in overbought or oversold area (area size is set by a user), and the value of the ADX main line exceeds the preset value, the Turning point of price indicator draws an arrow pointed to the further assumed price movement. This idea is described in the article Indicator of Price Reversal .
Inputs
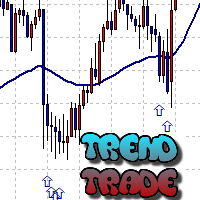
The Trend Trade indicator displays assumed turning points of the price on the chart in the direction of the trend after correction. It is based on the data of the Prise Reversal oscillator with the period 6 and indicators which characterize strength and availability of the trend. When the value of Prise Reversal is in overbought or oversold area (area size is set by a user), and the current trend is confirmed, the Trend Trade indicator draws an arrow pointed to the further assumed price movement

The indicator is similar to https://www.mql5.com/en/market/product/12330 . However, it considers the MQL5 platform features. Peaks and bottoms are calculated based solely on external bars. After a swing is formed, the indicator does not redraw providing opportunities for traders working on horizontal level breakthroughs. Traffic can be reduced by changing the amount of calculated bars in the MinBars variable (default value is 500). All you need is to select the output options, so that you can se

The indicator is based on the two-buffer scheme and does not require any additional settings. It can be used on any financial instrument without any restrictions. The indicator is a known ZigZag, but it does not redraw . The indicator allows to easily detect significant levels on the price chart, as well as demonstrates the ability to determine the probable direction of a price movement. The calculations are based on the candles' Close prices, thus improving the reliability of the levels.
Param
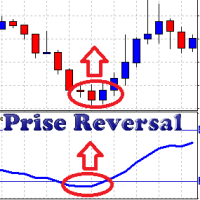
The oscillator uses data of standard indicators and some patterns of price movement. Using this data, it forms its own (more accurate) signals of a change in the direction of the price movement. Prise Reversal helps to identify reversal points during the flat, and the price extremums during the trend. At these points, you can enter counter trend with a short take profit. Besides, it indicates time intervals when it is too late to open a trend-following deal. After a few days of using the indicat

VR Ticks è un indicatore speciale per strategie basate sullo scalping. Grazie a questo indicatore il trader può vedere il grafico tick direttamente sul grafico principale dello strumento finanziario. Un grafico tick ti consente di inserire una posizione nel mercato o chiudere una posizione nel mercato nel modo più accurato possibile. VR Ticks traccia i dati dei tick sotto forma di linee che cambiano colore a seconda della direzione: ciò consente di comprendere e valutare visivamente la situazi
FREE
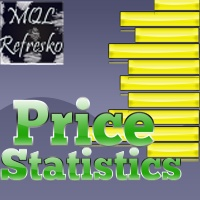
This indicator works only 5 digits Brokers. It is impossible to talk about the study of the Forex market or any market without considering of that market statistics. In this case, our indicator "price statistics" we have a new way to study our chart, giving information of the price in a range of pips you want to study for example, can we know how many times the price closes or opens into spaces 10, 20, 30, 50, 100 pips or more; and know them not only in numbers but also draws this relationship a
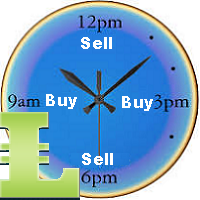
BuyLimit and SellLimit Buttons opens any combination of Buy Limit and Sell Limit pending orders and closes all existing pending orders.
Inputs Before placing all pending orders, the input window is opened allowing you to modify all input parameters: DeleteAllPendings ; if true , all pending orders (for the current currency) can be deleted. BuyLimit ; if true , Buy Stop orders can be opened. SellLimit ; if true , Sell Stop orders can be opened. InitLot ; initial lot size. LotCoeff ; next lot siz

The indicator displays volume profiles based on the nesting principle. Profiles periods are pre-set so that each subsequent profile has a length twice as long as the length of the previous profile. In addition to profiles, the indicator displays volume clusters sorted by color, depending on the volume they contain.
Indicator operation features The indicator works on typical timeframes from M5 to MN, but for calculations uses historical data from smaller timeframes: M1 - for timeframes from M5
FREE

Copiatore professionale di trade per MetaTrader 5 Un copiatore di trade veloce, professionale e affidabile per MetaTrader .
COPYLOT consente di copiare operazioni Forex tra terminali MT4 e MT5 con supporto per conti Hedge e Netting . La versione MT5 di COPYLOT supporta:
- MT5 Hedge → MT5 Hedge
- MT5 Hedge → MT5 Netting
- MT5 Netting → MT5 Hedge
- MT5 Netting → MT5 Netting
- MT4 → MT5 Hedge
- MT4 → MT5 Netting Versione MT4 Descrizione completa + DEMO + PDF Come acquistare Come installare Come ot

The market is unfair if only because 10% of participants manage 90% of funds. An ordinary trader has slim changes to stand against these "vultures". This problem can be solved. You just need to be among these 10%, learn to predict their intentions and move with them. Volume is the only preemptive factor that faultlessly works on any timeframe and symbol. First, the volume appears and is accumulated, and only then the price moves. The price moves from one volume to another. Areas of volume accumu

When looking at the information of On Balance Volume indicator, a question arises: is it a strong or weak movement? Should it be compared with previous days? These data should be normalized to always have a reference.
This indicator presents the followings parameters: Normalization period (Max-Mins absolute) Smoothing period (-1 off) Tick/Real Volume Maximum number of bars to calculate (-1 off) Upper value normalization Lower value normalization Calculation: normOBV = (value - absMin) * (relMax
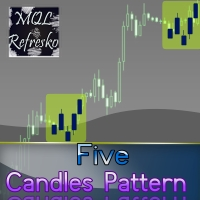
The "Five Candle Pattern" indicator is a novel way to see the market, because with it we can compare and/or seek training or the pattern of the past 4 or 5 Candles, and identify them in the same graph, to view your behavior at an earlier time. The indicator creates a pattern of those 4 or 5 candles and searches backward, identifies, and marks the same formation or pattern. With that information you adjust the strategy that is operating, or create a new one, because you can compare the past devel
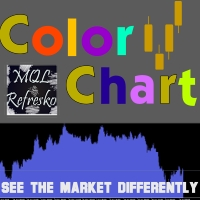
Visualize your charts differently in MetaTrader 5. The product is good for comparing the prices, since the indicator draws High, Close, HLC, etc. It is useful when applied with other indicators (like MACD). This simple indicator colors the entire space below the chart allowing you to see the market with greater clarity. You will see the actual price, trends, and the market behavior.
Indicator parameters Applied_Price : From this option you can select the type of price you want to draw with the

A ticker that shows the average bitcoin price of the selected currency and keeps updating it at regular intervals. PRO version updates more often and displays details about the price change! Make sure you have added the API address http://metakod.com/mk/api in the list of allowed URLs on tab Tools → Options → Expert Advisors. All of the supported currencies and the API address are listed in the screenshots below.
Inputs Logging level - Controls the amount of details written to the log (default:
FREE

The indicator colors bullish, bearish and doji candles. Also, the amount of candles (bullish, bearish and doji) for the last N days is calculated. You can select colors for both bodies and shadows of candles, as well as enable coloring of only candle bodies МetaТrader 4 version: https://www.mql5.com/en/market/product/11624 Parameters color bulls = color of bullish candle bodies color shadow bulls = color of bullish candle shadows color bears = color of bearish candle bodies color shadow bears =

Alligator Modified is a modification of the classic Alligator indicator designed to help traders visually identify market direction and coordinated line expansion. In addition to displaying the Jaw, Teeth, and Lips, the indicator marks situations when the lines cross and become correctly aligned. This helps distinguish directional Alligator expansion from periods when the lines are intertwined and do not indicate a consistent market direction. A Buy signal appears when the Lips and Teeth cross t

This is a well-known ZigZag indicator. But it differs by the fact that its plot is based on values of the middle line which is set by a user. It can display Andrews’ Pitchfork and standard or Bobokus Fibo levels. NO REPAINTING.
Parameters Period МА — middle line period. Default value is 34. Minimum value is 4. Maximum value is set at your discretion. Used to calculate price — type of price used for the midline calculations. The averaging method — type of smoothing for the middle line. Turning p

Exp5 - COPYLOT MASTER è una copiatrice commerciale per МetaТrader 5 e MetaTrader 4. Copia le operazioni Forex da qualsiasi conto. Installazione Questo Expert Advisor è un master copiatore. Installa l'Expert Advisor nel terminale da cui vuoi copiare le operazioni. Specificare qualsiasi nome di etichetta di testo come pathWrite, ad esempio "COPY". Installa COPYLOT MASTER per MT5 sul terminale da cui vuoi copiare le operazioni. Quindi installa COPYLOT Client MT4 sul terminale MT4 su cui vuoi
FREE
Scopri come acquistare un robot di trading dal MetaTrader Market, il negozio di applicazioni per la piattaforma MetaTrader.
Il sistema di pagamento di MQL5.community supporta le transazioni tramite PayPal, carte bancarie e gli altri sistemi di pagamento più diffusi. Per essere pienamente soddisfatto, ti consigliamo vivamente di testare il robot di trading prima di acquistarlo.

Ti stai perdendo delle opportunità di trading:
- App di trading gratuite
- Oltre 8.000 segnali per il copy trading
- Notizie economiche per esplorare i mercati finanziari
Registrazione
Accedi
Accetti la politica del sito e le condizioni d’uso
Se non hai un account, registrati