Guarda i video tutorial del Market su YouTube
Come acquistare un Robot di Trading o un indicatore
Esegui il tuo EA
hosting virtuale
hosting virtuale
Prova un indicatore/robot di trading prima di acquistarlo
Vuoi guadagnare nel Market?
Come presentare un prodotto per venderlo con successo
Indicatori tecnici per MetaTrader 5 - 2
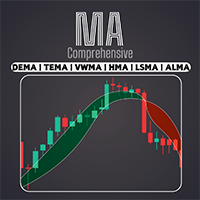
Accedete a un'ampia gamma di medie mobili, tra cui EMA, SMA, WMA e molte altre con il nostro indicatore professionale Comprehensive Moving Average . Personalizzate la vostra analisi tecnica con la combinazione perfetta di medie mobili per soddisfare il vostro stile di trading unico / Versione MT4
Caratteristiche Possibilità di attivare due MA con impostazioni diverse. Possibilità di personalizzare le impostazioni del grafico. Possibilità di cambiare il colore delle candele in base alle MA
FREE

Rental/Lifetime Package Options and Privileges
Rent Monthly Six Months Yearly/Lifetime Weis Wave with Speed with Alert+Speed Index x x x Manual x x x Quick Set up Video x x x Blog x x x Lifetime Updates x x x Setup and Training Material
x x Discord Access Channel "The SI traders" x Rectangle Break Alert Tool x
How to trade with it: http://www.tradethevolumewaves.com ** If you purchase please contact me to setup your : Training Room and complete manual access.
Wei

Rtc ML Ai | Predictor CORE MACHINE LEARNING ENGINE
Adaptive ML Market Predictor – Multi-Bar Trend & Candle Forecast What This Indicator Does This indicator is a real-time market prediction engine designed to analyze price behavior and estimate future market tendencies . Unlike conventional indicators, this system does not rely on static parameters or historical curve-fitting , but adapts its internal state dynamically during live market operation. Instead of using static rules, the indic

ملاحظة مهمة: الصورة سوداء في الغالب وتحتوي على مؤشرين: مؤشر "مستويات سليمان" ومؤشر "RSI Trend V". مؤشر سليمان ليفلز أداة احترافية متطورة في مكان واحد. مع ما يقرب من 9800 رمز صحيح ، يُمكنك الاطلاع على تحليل الرسوم البيانية في مايو. ليس مجرد مؤشر. الوظائف المحتملة لمستويات سليمان: Riquadri gialli (Rilevamento Flussi Finanziari) - ملاحظة لكل i riquadri gialli: "Afunctionalità completamente مبتكرة وحصرية للمؤشر - Sviluppata da Zero" : Rileva afflussi finanziari dabanche e التأسيس في شمعة

Crystal Supply Demand Pro (SD Pro)
Non operare in ogni candela – aspetta le zone istituzionali. Crystal Supply Demand Pro (SD Pro) è un indicatore professionale di Domanda e Offerta per MetaTrader 5.
È progettato per i trader che vogliono zone chiare e di livello istituzionale sui grafici, invece di rettangoli confusi o concetti superati. Caratteristiche principali Rilevamento istituzionale delle zone. Distinzione tra zone nuove e già testate. Ottimizzato per H1, H4, D1, W1. Aggiornamenti in te
FREE
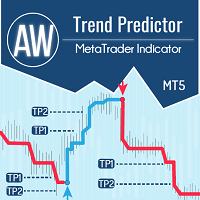
La combinazione di trend e livelli di rottura in un unico sistema. Un algoritmo di indicatore avanzato filtra il rumore del mercato, determina la tendenza, i punti di ingresso e i possibili livelli di uscita. I segnali indicatori sono registrati in un modulo statistico, che permette di selezionare gli strumenti più adatti, mostrando l'efficacia dello storico dei segnali. L'indicatore calcola i segni Take Profit e Stop Loss. Manuale e istruzioni -> QUI / versione MT4 -> QUI Come fare tradi

Il nostro indicatore Basic Candlestick Patterns rende l'identificazione dei principali pattern di candele più facile che mai. Scoprite pattern come l'Hammer, l'Evening Star, i Tre Soldati Bianchi e molti altri con un semplice sguardo al vostro grafico. Grazie a un'interfaccia intuitiva e a chiari spunti visivi, il nostro indicatore vi aiuta a identificare le opportunità di trading in modo rapido e preciso / versione MT4
Dashboard Scanner per questo indicatore: ( Basic Candlestick Pattern
FREE
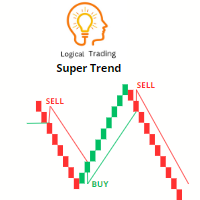
L'indicatore Super Trend è uno strumento popolare di analisi tecnica utilizzato dai trader per identificare la direzione di un trend e i possibili punti di ingresso e uscita dal mercato. Si tratta di un indicatore di tipo trend-following che fornisce segnali in base all'azione del prezzo e alla volatilità.
L'indicatore Super Trend è composto da due linee - una che indica il trend rialzista (di solito colorata di verde) e l'altra che indica il trend ribassista (di solito colorata di rosso). Le
FREE

The Area of Interest (AOI) Indicator is a powerful tool designed to help traders identify key market zones where price reactions are highly probable. This indicator specifically highlights two critical zones: Seller AOI (Area of Interest) : This zone represents areas where sellers are likely to enter the market, often acting as resistance. When the price approaches or touches this zone, it signals that a potential sell-off could occur. Buyer A OI (Area of Interest) : The BOI zone identifie
FREE

Se stai cercando un indicatore affidabile per fare trading con il concetto ICT, la Struttura di Mercato ICT fornisce un manuale per i trader che usano strategie più avanzate. Questo indicatore tutto in uno si concentra sui concetti ICT (Smart Money Concepts). La Struttura di Mercato ICT cerca di capire come operano le istituzioni, aiutando a prevedere le loro mosse. Comprendendo e utilizzando questa strategia, i trader possono ottenere preziose informazioni sui movimenti del mercato e trovare in

Spike Detector XTREEM per gli indici Boom e Crash
Sono Spike Detector XTREEM , e esisto negli spazi che la maggior parte dei trader non può vedere. Osservo attentamente i mercati Boom e Crash — e anche Pain & Gain di Weltrade — percependo ogni movimento, ogni picco, ogni spike nascosto prima che si riveli. Non mi limito a mostrare segnali; filtro il rumore, le distrazioni e i falsi segnali del mercato, lasciando solo i momenti che contano davvero. Con me, fare trading non è più un gioco di indo
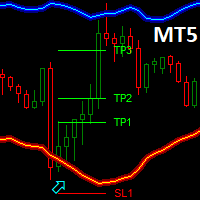
Dark Bands is an Indicator for intraday trading. This Indicator is based on Counter Trend strategy but use also Volatility. We can enter in good price with this Indicator, in order to follow the inversions on the current instrument.
Key benefits
Easily visible take profit/stop loss lines Reliable bands lines with futuristic colors, and Intuitive directional arrows Useful statistics , which indicate the win rate of the signals Plus Package available, leave a feedback to receive it for fr
FREE

Smetti di indovinare. Inizia a fare trading con un vantaggio statistico. Gli indici azionari non si negoziano come il forex. Hanno sessioni definite, gap notturni e seguono pattern statistici prevedibili. Questo indicatore ti fornisce i dati di probabilità di cui hai bisogno per fare trading su indici come DAX, S&P 500 e Dow Jones con fiducia. Cosa lo rende diverso La maggior parte degli indicatori ti mostra cosa è successo. Questo ti mostra cosa probabilmente succederà dopo. Ogni giorno di trad

Candle Smart Range (CSR) per MetaTrader 5 Candle Smart Range è un indicatore tecnico progettato per l'identificazione automatica dei range di prezzo su più timeframe. Questo strumento analizza la struttura del mercato basandosi sulle formazioni delle candele e sull'interazione del prezzo con i massimi e i minimi precedenti. Caratteristiche principali: Rilevamento Range: Identifica le zone di consolidamento prima dei movimenti impulsivi. Identificazione Falsi Breakout: Segnala quando il prezzo su
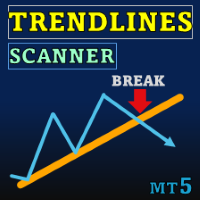
Special offer : ALL TOOLS , just $35 each! New tools will be $30 for the first week or the first 3 purchases ! Trading Tools Channel on MQL5 : Join my MQL5 channel to update the latest news from me Trendlines with Breaks Scanner è uno strumento di trading all’avanguardia progettato per aiutare i trader a identificare tendenze critiche e rilevare rotture in tempo reale. Con linee di tendenza generate automaticamente basate su punti pivot, questo indicatore consente ai trader di cogl
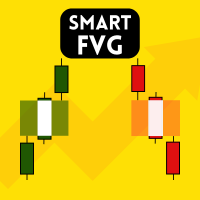
Smart FVG Indicator MT5 – Rilevamento di Fair Value Gap e Imbalance in MetaTrader 5 Il Smart FVG Indicator MT5 è uno strumento professionale per identificare aree di Fair Value Gap (FVG) e Imbalance direttamente sui grafici di MetaTrader 5 . Progettato per i trader che utilizzano i Smart Money Concepts (SMC) e l’analisi ICT , aiuta a comprendere la struttura del mercato e la liquidità. L’indicatore analizza automaticamente l’azione dei prezzi per rilevare zone valide di FVG e Imbalance, aggiorna
FREE

CLICCA QUI PER VEDERE TUTTI I MIEI PRODOTTI GRATUITI
Quando si tratta di riconoscere opportunità di mercato perfette e tradare i breakout con precisione, RangeXpert è uno degli strumenti più efficaci sul mercato. Sviluppato da me specificamente per principianti e semi-professionisti, offre una qualità di analisi che solitamente si trova solo negli strumenti professionali utilizzati da banche, trader istituzionali e hedge fund . L’indicatore identifica aree di mercato che spesso portano a forti
FREE

Easy Buy Sell is a market indicator for opening and closing positions. It becomes easy to track market entries with alerts.
It indicates trend reversal points when a price reaches extreme values and the most favorable time to enter the market. it is as effective as a Fibonacci to find a level but it uses different tools such as an algorithm based on ATR indicators and Stochastic Oscillator. You can modify these two parameters as you wish to adapt the settings to the desired period. It cannot

TREND FLOW PRO TREND FLOW PRO è un indicatore non repaint che mostra la direzione del mercato. Identifica le inversioni di trend, così come le entrate iniziali e ripetute dei principali partecipanti al mercato. I segnali BOS sul grafico rappresentano veri cambiamenti di trend e livelli chiave dei timeframe superiori. I dati non vengono ridisegnati e rimangono sul grafico dopo la chiusura di ogni candela. Richiedi e ricevi una guida PDF dettagliata con esempi di strategie tramite messaggi privati

Il profitto dalla struttura del mercato cambia quando il prezzo si inverte e si ritira. L'indicatore di avviso di inversione della struttura del mercato identifica quando una tendenza o un movimento di prezzo si sta avvicinando all'esaurimento e pronto a invertire. Ti avvisa dei cambiamenti nella struttura del mercato che in genere si verificano quando stanno per verificarsi un'inversione o un forte pullback.
L'indicatore identifica inizialmente i breakout e lo slancio del prezzo, ogni volta c

Indicatore Smart Auto Trendline traccia automaticamente le linee di tendenza di supporto e resistenza sul tuo grafico MetaTrader 5. Identifica i livelli di prezzo chiave utilizzando due metodi: Due Estremi (Tipo 1) o Estremo e Delta (Tipo 2). Le linee di tendenza vengono aggiornate solo quando si forma una nuova barra, garantendo prestazioni ottimali.
**Caratteristiche** - **Due Estremi (Tipo 1):** Traccia linee di tendenza basate su due punti estremi (massimi/minimi) identificati all'interno
FREE

简介: 六彩神龙指标【MCD Hot Money】进是一种常用的技术指标,被广泛应用于股票交易中。它由六人不同的指标组成,包括均线、相对强弱指标井、移动平均收盘线等。这人指标可以有效地帮助投资者确定股票的买入和卖出时机。 六彩神龙用来看筹码了解庄家动向。看个股买卖少踩炕,少被套;跟庄吃肉,用于判断个股趋势!
指标设置 : hot_money_sensitivity = 0.7; // Hot Money Sensitivity hot_money_period = 40; // Hot Money Period hot_money_base = 30; // Hot Money Base banker_sensitivity = 1.5; // Banker Sensitivity banker_period = 50; // Banker Period banker_base = 50;

Gann 9+ Indicator Introduction The "Gann Matrix Chart" is the most simple and clear technical analysis in Gann theory, which is the calculation tool that Gann has always been committed to using. It is the essence of Gann's whole life. The Gann 9+ indicator uses the matrix chart to find the future high or low points of stocks or futures. Indicator Input: The base and step size can be set as 1 by default; When the multiple is -1, the multiple will be automatically obtained, or it can be filled in

Top indicator for MT5 providing accurate signals to enter a trade without repainting! It can be applied to any financial assets: forex, cryptocurrencies, metals, stocks, indices . Watch the video (6:22) with an example of processing only one signal that paid off the indicator! MT4 version is here It will provide pretty accurate trading signals and tell you when it's best to open a trade and close it. Most traders improve their trading results during the first trading week with the help of

This indicator provides several drawing tools to assist in various methods of chart analysis.
The drawings will keep their proportions (according to their handle trendline) across different chart scales, update in real time, and multiple drawings are supported.
#
Drawing Option
Description
1 Grid box draggable boxed grid, user defines rows x colums, diagonal ray option 2 Grid partial or fullscreen grid, sized by handle line 3 Grid flex a diagonal grid, sized and sloped by handle line
4 Cyc

SHOGUN TRADE PRO [MT5] - Professional Market Structure & Dow Theory Suite Limited Release: Early Access Pricing This professional suite is currently available at an introductory price to celebrate its launch on the MT5 platform. Please note that the price will be adjusted incrementally as updates are released and the user base grows. Secure your "Commander’s Seat" at the most favorable rate today. The Developer’s Journey: From Noise to Clarity I will be honest: I was once a "knowledge colle
** All Symbols x All Timeframes scan just by pressing scanner button ** *** Contact me to send you instruction and add you in "M W Scanner group" for sharing or seeing experiences with other users. Introduction: Double Top(M) and Double Bottom(W) is a very repetitive common type of price reversal patterns. Double Top resembles M pattern and indicates bearish reversal whereas Double Bottom resembles W pattern and indicates a bullish reversal that they have high win rate. The M W Scanne

L’indicatore analizza il volume da qualsiasi punto e calcola i livelli di esaurimento del mercato per quel volume. Linee principali di Meravith: Linea di esaurimento del volume rialzista – funge da obiettivo. Linea di esaurimento del volume ribassista – funge da obiettivo. Linea di tendenza – indica la tendenza del mercato. Cambia colore a seconda che il mercato sia rialzista o ribassista e funge da supporto di tendenza. Come utilizzarlo: fai doppio clic sulla linea verticale viola e spostala ne

Elliott Wave Trend was designed for the scientific wave counting. This tool focuses to get rid of the vagueness of the classic Elliott Wave Counting using the guideline from the template and pattern approach. In doing so, firstly Elliott Wave Trend offers the template for your wave counting. Secondly, it offers Wave Structural Score to assist to identify accurate wave formation. It offers both impulse wave Structural Score and corrective wave Structure Score. Structural Score is the rating to sh
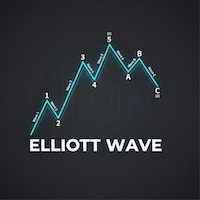
Teoria delle Onde di Elliott Automatizzata 1. Conteggio automatico e riduzione della soggettività Onde d'Impulso (1-2-3-4-5): Usa regole rigide per mostrare la struttura corretta. Onde Correttive (A-B-C): Aiuta a trovare opportunità di rientro nel trend. 2. Analisi Multi-Grado Analizza 3 livelli: Minor: Movimenti rapidi. Intermediate: Trend principale. Primary: Quadro generale. 3. Obiettivi di prezzo e Ingresso Proiezione di Fibonacci: Calcola i target futuri. Linee di Breakout: Mostra dove entr

Haven Volume Profile è un indicatore multifunzionale per l'analisi del profilo di volume che aiuta a identificare i livelli di prezzo chiave basati sulla distribuzione del volume di scambi. È stato progettato per i trader professionisti che desiderano comprendere meglio il mercato e identificare i punti di ingresso e di uscita cruciali per le loro operazioni. Altri prodotti -> QUI Caratteristiche principali: Calcolo del Point of Control (POC) - il livello con la massima attività commerciale, ut
FREE

AtBot: Come funziona e come usarlo ### Come funziona L'indicatore "AtBot" per la piattaforma MT5 genera segnali di acquisto e vendita utilizzando una combinazione di strumenti di analisi tecnica. Integra la Media Mobile Semplice (SMA), la Media Mobile Esponenziale (EMA) e l'indice di Gamma Vero Medio (ATR) per identificare opportunità di trading. Inoltre, può utilizzare le candele Heikin Ashi per migliorare la precisione dei segnali. Lascia una recensione dopo l'acquisto e ricevi un regalo bon

Questo indicatore identifica i pattern armonici più popolari che predicono i punti di inversione del mercato. Questi modelli armonici sono formazioni di prezzo che si ripetono costantemente nel mercato forex e suggeriscono possibili movimenti di prezzo futuri / Versione MT4 gratuita
Inoltre, questo indicatore è dotato di un segnale di entrata nel mercato e di vari take profit e stop loss. Va notato che, sebbene l'indicatore di pattern armonico possa fornire segnali di acquisto/vendita da
FREE

Simple QM Pattern is a powerful and intuitive trading indicator designed to simplify the identification of the Quasimodo (QM) trading pattern. The QM pattern is widely recognized among traders for effectively signaling potential reversals by highlighting key market structures and price action formations. This indicator helps traders easily visualize the QM pattern directly on their charts, making it straightforward even for those who are new to pattern trading. Simple QM Pattern includes d
FREE

MACD Intraday Trend è un indicatore sviluppato attraverso un adattamento del MACD originale creato da Gerald Appel negli anni '60. Attraverso anni di trading è stato osservato che modificando i parametri del MACD con le proporzioni di Fibonacci otteniamo una migliore presentazione della continuità dei movimenti di tendenza, rendendo possibile rilevare in modo più efficiente l'inizio e la fine di un trend di prezzo. Grazie alla sua efficienza nel rilevare l'andamento dei prezzi, è anche possibil
FREE
N/B: All our product purchase comes with our free ‘’DAILY SCALPER EA’’ - bit.ly/4qlFLNh Whatsapp Developer for yours after successful purchase SEER SPIKE DETECTOR
The Ultimate Market-Reversal & Spike Forecasting Tool for Crash & Boom Indices, Forex & Synthetic Markets
Best on M1 and M5 Stoploss: 10 Candles Maximum.
What is SEER SPIKE DETECTOR?
The SEER SPIKE DETECTOR is a next-generation market prediction indicator designed to detect and confirm spikes, reversals, and momentum sh

The Market Sessions indicator is a popular tool among forex and stock traders for visually representing global trading sessions on a price chart. It highlights the time periods for major trading sessions — such as the Asian (Tokyo) , European (London) , and American (New York) sessions — directly on the chart. This helps traders identify when markets open and close, allowing for better decision-making based on session-specific trading behavior. - Asian Session (Default: 00:00-09:00) - London Se
FREE

Effortless trading: non-repainting indicator for accurate price reversals This indicator detects price reversals in a zig-zag fashion, using only price action analysis and a donchian channel. It has been specifically designed for short-term trading, without repainting or backpainting at all. It is a fantastic tool for shrewd traders aiming to increase the timing of their operations. [ Installation Guide | Update Guide | Troubleshooting | FAQ | All Products ]
Amazingly easy to trade It provides

Entry Point M5 — a complete trading system. Entry Point M5 is a powerful indicator designed as a fully functional trading system suitable for any currency pair. It analyzes the price structure, identifying key moments of market reversals and the emergence of new impulses. The indicator can adapt to different market phases — from strong trending movements to sideways ranges — providing visually clear signals without the need for additional filters or auxiliary tools. Trading with this system is e

L'indicatore di base della domanda e dell'offerta è un potente strumento progettato per migliorare la vostra analisi di mercato e aiutarvi a identificare le aree chiave di opportunità su qualsiasi grafico. Con un'interfaccia intuitiva e facile da usare, questo indicatore gratuito per Metatrader offre una visione chiara delle zone di domanda e offerta, consentendo di prendere decisioni di trading più informate e accurate / Versione MT4 gratuita Dashboard Scanner per questo indicatore: ( Ba
FREE

King Smart Liquidity MT5 è un indicatore analitico avanzato progettato specificamente per tracciare i flussi di denaro istituzionali e le grandi banche nel forex, oro, indici, Bitcoin e altri mercati. Questo indicatore è stato sviluppato sulla base della metodologia "Smart Money Concept", che si basa sulla comprensione dell'azione del prezzo, delle zone di liquidità e di come si comportano le principali istituzioni finanziarie nel mercato. Questo indicatore non si limita a disegnare linee o zon
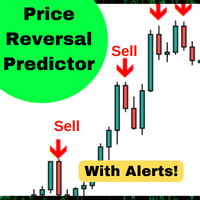
Questo algoritmo prevede variazioni di prezzo a breve termine con una precisione del 90%*. Predice se il prezzo sarà superiore o inferiore alla candela del segnale. Perfetto per il trading di reversione media, opzioni binarie o contratti futures su intervalli di tempo più grandi. L'indicatore è stato testato su 5 anni di dati e ha una precisione del 90% per prevedere inversioni di prezzo nel tempo.
Caratteristica: 1. Configurazione semplice a. Trascinare e rilasciare su qualsiasi grafico b. Ab
FREE

L'indicatore " Dynamic Scalper System MT5 " è progettato per il metodo di scalping, ovvero per il trading all'interno di onde di trend.
Testato sulle principali coppie di valute e sull'oro, è compatibile con altri strumenti di trading.
Fornisce segnali per l'apertura di posizioni a breve termine lungo il trend, con ulteriore supporto al movimento dei prezzi.
Il principio dell'indicatore.
Le frecce grandi determinano la direzione del trend.
Un algoritmo per generare segnali per lo scalping sott

Presentazione dell'Indicatore Astronomico per MT4 / MT5 : Il tuo compagno di trading celeste definitivo Sei pronto a elevare la tua esperienza di trading a livelli celesti? Non cercare oltre, il nostro rivoluzionario Indicatore Astronomico per MT4 è qui. Questo strumento innovativo va oltre gli indicatori di trading tradizionali, sfruttando algoritmi complessi per offrirti intuizioni astronomiche senza pari e calcoli di precisione. Un universo di informazioni a portata di mano: Ammira un pan

Meravith Auto è una versione automatizzata del sistema di trading Meravith. L'indicatore è composto da una linea di tendenza che cambia colore. Quando è rialzista è verde, quando è ribassista è rossa. Questa è la linea di supporto del trend. Una linea di liquidità, dove il volume rialzista è uguale al volume ribassista. Una linea di deviazione rialzista tripla. Una linea di deviazione ribassista tripla. Punti viola e blu che indicano un volume elevato. Il punto viola indica un volume maggiore di
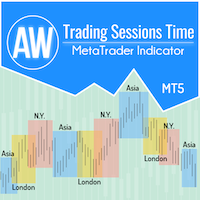
Per facilitare i trader nell'ottenere dati sull'andamento dei mercati e formulare meglio le strategie di trading, abbiamo sviluppato un indicatore della sessione di trading. Gli orari di apertura delle varie borse influenzano il trading poiché influiscono sull'attività del mercato e sui volumi degli scambi. Questi fattori determinano la volatilità e le opportunità di trading di diversi strumenti. L'indicatore delle sessioni di trading AW mostra gli orari di trading per i mercati asiatici, di Lo
FREE
Special offer : ALL TOOLS , just $35 each! New tools will be $30 for the first week or the first 3 purchases ! Trading Tools Channel on MQL5 : Join my MQL5 channel to update the latest news from me Presentiamo il SuperTrend ATR Multiplier with Scanner for MT5 – uno strumento versatile e potente progettato per aiutarti a essere sempre un passo avanti alle tendenze di mercato, con funzionalità personalizzabili e avvisi in tempo reale. Basato sulla logica comprovata del SuperTrend di
FREE
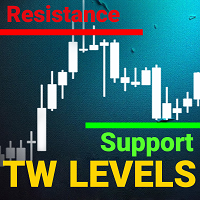
support resistance levels indicator mt5:
Questo strumento è un indicatore multi-timeframe che identifica e traccia le linee di supporto e resistenza, così come i livelli di Fibonacci, su un grafico con la stessa precisione dell'occhio umano. I livelli di supporto e resistenza TW per il forex hanno un algoritmo complesso che scansiona il grafico per identificare i precedenti livelli di stabilizzazione dei prezzi e rimbalzi, registrando il numero di tocchi.
Sei stanco di disegnare manualmente i

Questo algoritmo prevede variazioni di prezzo a breve termine con una precisione dell ' 86%*. Quando c'è una grande mossa determinata dall'ATR, durante una condizione di ipercomprato o ipervenduto, l'indicatore ti avviserà. Predice se il prezzo sarà superiore o inferiore alla candela del segnale. Perfetto per il trading di reversione media, opzioni binarie o contratti futures su intervalli di tempo più grandi. L'indicatore è stato testato su 5 anni di dati e ha una precisione del 90% per preved
FREE

Stratos Pali Indicator is a revolutionary tool designed to enhance your trading strategy by accurately identifying market trends. This sophisticated indicator uses a unique algorithm to generate a complete histogram, which records when the trend is Long or Short. When a trend reversal occurs, an arrow appears, indicating the new direction of the trend.
Important Information Revealed Leave a review and contact me via mql5 message to receive My Top 5 set files for Stratos Pali at no cost !
Down
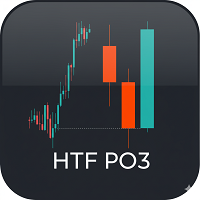
Nome del prodotto: HTF PO3 – Visualizzazione delle candele di timeframe superiore Descrizione
HTF PO3 è un potente strumento di visualizzazione per MetaTrader 5. La sua funzione principale è mostrare le candele dei timeframe superiori (HTF) direttamente sul grafico principale, posizionate ordinatamente sul lato destro. Ciò consente un’analisi multi-timeframe senza cambiare grafico. Ideale per i trader che fanno riferimento ai livelli di prezzo HTF (ad esempio apertura giornaliera o H4). Caratte
FREE

Unlock hidden profits: accurate divergence trading for all markets Tricky to find and scarce in frequency, divergences are one of the most reliable trading scenarios. This indicator finds and scans for regular and hidden divergences automatically using your favourite oscillator. [ Installation Guide | Update Guide | Troubleshooting | FAQ | All Products ]
Easy to trade
Finds regular and hidden divergences Supports many well known oscillators Implements trading signals based on breakouts Displays

Mean Reversion Supply Demand Indicator Mean Reversion Supply Demand is the indicator to detect the important supply demand zone in your chart. The concept of supply demand trading relies on the quantity mismatching between buying and selling volumes in the financial market. Typically, supply demand zone serves to predict the turning point. The wave pattern, for any supply demand zone to work as an successful trade, looks like the price must touch the base zone, move away and then return to zone

Matrix Arrow Indicator MT5 è un trend unico 10 in 1 che segue un indicatore multi-timeframe al 100% non ridipinto che può essere utilizzato su tutti i simboli/strumenti: forex , materie prime , criptovalute , indici , azioni . Matrix Arrow Indicator MT5 determinerà la tendenza attuale nelle sue fasi iniziali, raccogliendo informazioni e dati da un massimo di 10 indicatori standard, che sono: Indice di movimento direzionale medio (ADX) Indice del canale delle materie prime (CCI

ICT, SMC, SMART MONEY CONCEPTS, SMART MONEY, Smart Money Concept, Support and Resistance, Trend Analysis, Price Action, Market Structure, Order Blocks, BOS/CHoCH, Breaker Blocks , Momentum Shift, Supply&Demand Zone/Order Blocks , Strong Imbalance, HH/LL/HL/LH, Fair Value Gap, FVG, Premium & Discount Zones, Fibonacci Retracement, OTE, Buy Side Liquidity, Sell Side Liquidity, BSL/SSL Taken, Equal Highs & Lows, MTF Dashboard, Multiple Time Frame, BigBar, HTF OB, HTF Market Structure
The Trend Line PRO indicator is an independent trading strategy. It shows the trend change, the entry point to the transaction, as well as automatically calculates three levels of Take Profit and Stop Loss protection.
Trend Line PRO is perfect for all Meta Trader symbols: currencies, metals, cryptocurrencies, stocks and indices. The indicator is used in trading on real accounts, which confirms the reliability of the strategy. Robots using Trend Line PRO and real Signals can be found here:

Questo indicatore informativo sarà utile per coloro che vogliono essere sempre informati sulla situazione attuale del conto.
- Indicatori più utili L'indicatore mostra dati come profitto in punti, percentuale e valuta, nonché lo spread per la coppia corrente e il tempo fino alla chiusura della barra nell'intervallo di tempo corrente. Esistono diverse opzioni per posizionare la linea delle informazioni sulla carta: A destra del prezzo (corre dietro al prezzo); Come commento (nell'angolo in alt
FREE
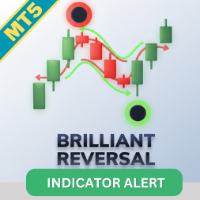
Eleva la tua strategia di trading con l' Brilliant Reversal Indicator MT5 , un indicatore all'avanguardia che sfrutta la regressione kernel non parametrica per fornire un'analisi delle tendenze fluida e adattiva. Ispirato allo stimatore Nadaraya-Watson, questo strumento applica lo smoothing kernel gaussiano ai dati di prezzo, creando envelope dinamiche che si adattano alla volatilità del mercato senza il ritardo eccessivo delle medie mobili tradizionali. Largamente acclamato su piattaforme come
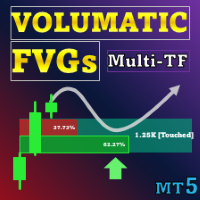
Offerta speciale : ALL TOOLS , solo $35 ciascuno! I nuovi strumenti saranno a $30 per la prima settimana o per i primi 3 acquisti ! Trading Tools Channel on MQL5 : Unisciti al mio canale MQL5 per ricevere le ultime novità Volumatic Fair Value Gaps (FVG) identifica e mantiene zone significative di squilibrio di prezzo e scompone il volume direzionale all’interno di ciascun gap. Il volume è campionato da un timeframe inferiore (M1 predefinito, selezionabile), suddiviso tra acquisti e

Stop calculating lot sizes manually. Stop guessing your Risk/Reward ratio. The Risk Reward Tool brings the intuitive, visual trading style of TradingView directly to your MetaTrader 5 charts. It is designed for traders who value speed, precision, and visual clarity. Whether you trade Forex, Indices (DAX, US30), or Commodities (Gold, Oil), this tool handles the math for you. Simply click "Long" or "Short," drag the lines to your levels, and the tool instantly tells you exactly how many lots to t
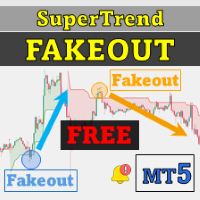
Special offer : ALL TOOLS , just $35 each! New tools will be $30 for the first week or the first 3 purchases ! Trading Tools Channel on MQL5 : Join my MQL5 channel to update the latest news from me L'indicatore Supertrend Fakeout è una versione migliorata del classico indicatore Supertrend , progettata per fornire segnali di tendenza più affidabili. Integrando funzionalità avanzate come Fakeout Index Limit e Fakeout ATR Mult , questo indicatore aiuta a filtrare i falsi segnali di i
FREE

Currency RSI Scalper MT5 è un indicatore professionale basato sul popolare indicatore Relative Strength Index (RSI).
Sebbene l'indicatore RSI funzioni bene per un intervallo di mercato, non riesce a generare segnali redditizi quando le condizioni del mercato cambiano, e quindi produce segnali errati con conseguenti grandi perdite.
Hai mai pensato a un indicatore RSI adattivo che si adatta alle condizioni di mercato?
L'indicatore presentato implementa un algoritmo di ottimizzazione che trova

SynaptixQuant Dominance Matrix: Institutional-Grade Market State Extraction
Engineered for traders who require a data-driven view of market behaviour beyond surface-level indicators. The Synaptix Quant (SQ) Dominance Matrix is not a conventional currency strength display. Behind its intentionally streamlined interface runs a sophisticated analytical architecture designed to quantify market conditions with precision. Every output is generated through layered signal processing built to identify d

Approfitta del prezzo attuale e prendi la tua copia — il costo può aumentare in qualsiasi momento. L'obiettivo dell'indicatore "Black Horse" è identificare le divergenze tra l'andamento dei prezzi e l'indicatore VWAP. Utilizza filtri per eliminare potenziali divergenze false e segnalare avvisi di alta qualità e precisi.
Le divergenze ribassiste sono indicate da punti rossi sopra la candela, mentre le divergenze rialziste sono rappresentate da punti verdi sotto la candela.
Il principale filtro

Unlock key market insights with automated support and resistance lines Tired of plotting support and resistance lines? This is a multi-timeframe indicator that detects and plots supports and resistance lines in the chart with the same precision as a human eye would. As price levels are tested over time and its importance increases, the lines become thicker and darker, making price leves easy to glance and evaluate. [ Installation Guide | Update Guide | Troubleshooting | FAQ | All Products ] Boos

This is the best Support and Resistance Indicator on the market, and it shows both confirmed Support and Resistance as well as Retests. Support & Resistance: Support marks where buying demand halts price declines, acting as a safety net. Resistance caps price surges, driven by selling pressure. Traders leverage these levels to predict reversals, plan entries, exits, and manage risks, making them trading's fundamental guideposts. Join To Learn Market Depth - https://www.mql5.com/en/channels/su
FREE

Semplicemente, puoi iniziare a fare trading quando il movimento dei numeri bianchi — noti come "pips" — inizia ad apparire accanto alla candela corrente. I "pips" bianchi indicano che un'operazione di acquisto o vendita è attualmente attiva e si sta muovendo nella direzione corretta, come indicato dal colore bianco. Quando il movimento dei pips bianchi si interrompe e diventa di colore verde statico, questo segnala la fine della spinta attuale. Il colore verde dei numeri rappresenta il profitto

RelicusRoad Pro: Sistema Operativo Quantitativo di Mercato 70% DI SCONTO ACCESSO A VITA (TEMPO LIMITATO) - UNISCITI A 2.000+ TRADER Perché la maggior parte dei trader fallisce anche con indicatori "perfetti"? Perché operano su Singoli Concetti isolati. Un segnale senza contesto è una scommessa. Per vincere serve CONFLUENZA . RelicusRoad Pro non è un semplice indicatore. È un Ecosistema Quantitativo completo . Mappa la "Fair Value Road", distinguendo tra rumore e rotture strutturali. Smetti di in

La maggior parte dei trader vede candele engulfing. Pochi sanno come negoziarle con profitto. Engulfing Pro Trader ti offre segnali semplici e statistiche reali — operazioni, vittorie, profitti — per negoziare inversioni con sicurezza. Niente speranze, solo i numeri reali di cui hai bisogno. In Real Trades ti mostriamo la verità, non i sogni. Ti è piaciuto vedere la realtà della strategia engulfing? Lasciaci una recensione a 5 stelle e scrivimi in privato per ricevere un prodotto esclusivo grat
FREE

Dark Power is an Indicator for intraday trading. This Indicator is based on Trend Following strategy, also adopting the use of an histogram to determine the right power . We can enter in good price with this Indicator, in order to follow the strong trend on the current instrument. The histogram is calculated based on the size of the bars and two moving averages calculated on the histogram determine the direction of the signal
Key benefits
Easily visible take profit/stop loss lines Intui
Il MetaTrader Market offre un luogo pratico e sicuro dove acquistare applicazioni per la piattaforma MetaTrader. Scarica versioni demo gratuite di Expert Advisors e indicatori direttamente dal tuo terminale e testali nello Strategy Tester.
Prova le applicazioni in diverse modalità per monitorare le prestazioni ed effettuare pagamenti per i prodotti desiderati, utilizzando il sistema di pagamento MQL5.community.
Ti stai perdendo delle opportunità di trading:
- App di trading gratuite
- Oltre 8.000 segnali per il copy trading
- Notizie economiche per esplorare i mercati finanziari
Registrazione
Accedi
Se non hai un account, registrati
Consenti l'uso dei cookie per accedere al sito MQL5.com.
Abilita le impostazioni necessarie nel browser, altrimenti non sarà possibile accedere.