Technische Indikatoren für den MetaTrader 5 - 2
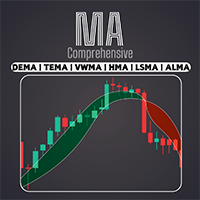
Greifen Sie mit unserem professionellen Comprehensive Moving Average -Indikator auf eine breite Palette gleitender Durchschnitte zu, darunter EMA, SMA, WMA und viele mehr. Passen Sie Ihre technische Analyse mit der perfekten Kombination von gleitenden Durchschnitten an Ihren individuellen Handelsstil an / MT4 Version
Merkmale
Möglichkeit, zwei MAs mit unterschiedlichen Einstellungen zu aktivieren. Möglichkeit zur Anpassung der Chart-Einstellungen. Möglichkeit, die Farbe der Candlesticks in
FREE

Optionen und Privilegien des Miet-/Lifetime-Pakets
Miete Monatlich Sechs Monate Jährlich/Lebenslang Weis Wave mit Geschwindigkeit mit Alert+Speed Index x x x Manuell x x x Video zur Schnelleinrichtung x x x Blog x x x Lifetime-Updates x x x Einrichtungs- und Schulungsmaterial
x x Discord-Zugangskanal "Die SI-Händler" x Rectangle Break Alert Tool x
Wie man damit handelt: http: // www.tradethevolumewaves.com ** Wenn Sie kaufen, nehmen Sie bitte Kontakt mit mir auf, um Ihren : Schulungsraum un

Rtc ML Ai | Predictor CORE MACHINE LEARNING ENGINE
Adaptive ML Market Predictor - Multi-Bar Trend & Candle Forecast Was dieser Indikator tut Im Gegensatz zu herkömmlichen Indikatoren verlässt sich dieses System nicht auf statische Parameter oder historische Kurvenanpassungen , sondern passt seinen internen Zustand dynamisch während des laufenden Marktbetriebs an. Anstatt statische Regeln zu verwenden, lernt der Indikator kontinuierlich aus Live-Marktdaten und passt sein internes Modell dynam

ملاحظة هامة: تظهر لقطات الشاشة مؤشرين "Suleman Levels" و"RSI Trend V". مؤشر مستويات سليمان هو أداة تحليل احترافية متطورة ومتكاملة. بفضل ما يقارب 9800 سطر من التعليمات البرمجية، يجعل مخططات تحليلك أوضح من أي وقت مضى. إنه ليس مجرد مؤشر. الميزات القوية لـ Suleiman Levels: المربعات الصفراء (كشف التدفقات المالية) - ملاحظة حول المربعات الصفراء: "ميزة مبتكرة وحصرية للمؤشر - طُوّرت من الصفر" : تكشف تدفقات رأس المال من البنوك والمؤسسات المالية في شموع محددة. تُمثّل هذه المربعات الأنشطة المال

Crystal Supply Demand Pro (SD Pro)
Handle nicht in jeder Kerze – warte auf institutionelle Zonen. Crystal Supply Demand Pro (SD Pro) ist ein professioneller Supply & Demand Indikator für MetaTrader 5.
Er wurde für Trader entwickelt, die klare, institutionelle Zonen auf dem Chart sehen möchten anstelle von unübersichtlichen Boxen oder veralteten Konzepten.
Mit Optimierung für höhere Zeitrahmen, dynamischen Updates und professioneller Visualisierung zeigt SD Pro nur die wirklich wichtigen Levels.
FREE
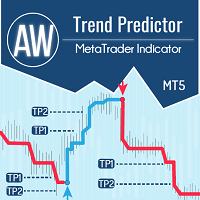
Die Kombination von Trend- und Aufschlüsselungsebenen in einem System. Ein fortschrittlicher Indikatoralgorithmus filtert Marktrauschen, bestimmt den Trend, Einstiegspunkte sowie mögliche Ausstiegsniveaus. Indikatorsignale werden in einem Statistikmodul aufgezeichnet, das es Ihnen ermöglicht, die am besten geeigneten Tools auszuwählen, die die Wirksamkeit der Signalhistorie zeigen. Der Indikator berechnet Take-Profit- und Stop-Loss-Marken. Handbuch und Anleitung -> HIER / MT4-Version -> H

Unser Indikator Basic Candlestick Patterns macht das Erkennen der wichtigsten Candlestick-Muster so einfach wie nie zuvor. Entdecken Sie Muster wie den Hammer, den Abendstern, die drei weißen Soldaten und viele mehr mit einem Blick auf Ihren Chart. Mit einer intuitiven Benutzeroberfläche und klaren visuellen Hinweisen hilft Ihnen unser Indikator, Handelsmöglichkeiten schnell und präzise zu erkennen / MT4-Version
Dashboard Scanner für diesen Indikator: ( Basic Candlestick Patterns Dashboa
FREE
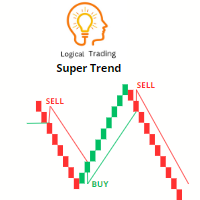
Der Super Trend Indikator ist ein beliebtes technisches Analysewerkzeug, das von Händlern verwendet wird, um die Richtung eines Trends und potenzielle Einstiegs- und Ausstiegspunkte im Markt zu identifizieren. Es handelt sich um einen Trendfolge-Indikator, der Signale auf Basis der Preisbewegung und Volatilität liefert.
Der Super Trend Indikator besteht aus zwei Linien - eine zeigt den bullishen Trend an (in der Regel grün gefärbt) und die andere den bearishen Trend (in der Regel rot gefärbt).
FREE

Der Area of Interest (AOI)-Indikator ist ein leistungsfähiges Instrument, das Händlern hilft, wichtige Marktzonen zu identifizieren, in denen Kursreaktionen sehr wahrscheinlich sind. Dieser Indikator hebt insbesondere zwei kritische Zonen hervor: Verkäufer-AOI (Area of Interest) : Diese Zone stellt Bereiche dar, in denen Verkäufer wahrscheinlich in den Markt eintreten werden und oft als Widerstand wirken. Wenn sich der Kurs dieser Zone nähert oder sie berührt, signalisiert dies, dass ein potenz
FREE

Wenn Sie nach einem zuverlässigen Indikator suchen, um das ICT-Konzept zu handeln, bietet Ihnen die ICT Market Structure eine Bedienungsanleitung für Händler, die fortgeschrittenere Strategien verwenden. Dieser All-in-One-Indikator konzentriert sich auf ICT-Konzepte (Smart Money Concepts). ICT Market Structure versucht zu verstehen, wie Institutionen handeln, um ihre Züge vorherzusagen. Durch das Verständnis und die Anwendung dieser Strategie können Händler wertvolle Einblicke in die Marktbewegu

Spike Detector XTREEM – Präzise Spike-Erkennung für Boom-, Crash- und Pain/Gain-Märkte Der Spike Detector XTREEM bringt professionelle Spike-Analyse in die schnelllebige Welt der synthetischen Indizes. Anstatt auf jede Preisbewegung zu reagieren, identifiziert dieser Indikator echte Spike-Formationen durch intelligente Filterung, sodass Sie Trades mit Vertrauen eingehen können, wenn der Momentum wirklich zählt. Wenn Sie diesen Indikator kaufen, erhalten Sie den Histogram Trend -Indikator KOSTEN
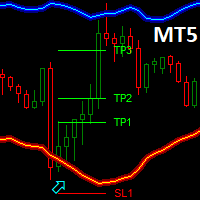
Dark Bands ist ein Indikator für den Intraday-Handel. Dieser Indikator basiert auf der Counter Trend Strategie, nutzt aber auch die Volatilität. Mit diesem Indikator können wir bei guten Preisen einsteigen, um die Umkehrungen des aktuellen Instruments zu verfolgen.
Wichtigste Vorteile
Leicht sichtbare Take-Profit/Stop-Loss-Linien Zuverlässige Bandlinien mit futuristischen Farben und intuitiven Richtungspfeilen Nützliche Statistiken , die die Gewinnrate der Signale anzeigen Plus-Paket verfügb
FREE

Hören Sie auf zu raten. Beginnen Sie mit einem statistischen Vorteil zu handeln. Aktienindizes werden nicht wie Forex gehandelt. Sie haben definierte Sitzungen, Overnight-Gaps und folgen vorhersehbaren statistischen Mustern. Dieser Indikator liefert Ihnen die Wahrscheinlichkeitsdaten, die Sie benötigen, um Indizes wie den DAX, S&P 500 und Dow Jones mit Zuversicht zu handeln. Was ihn anders macht Die meisten Indikatoren zeigen Ihnen, was passiert ist. Dieser zeigt Ihnen, was wahrscheinlich als nä

Candle Smart Range (CSR) für MetaTrader 5 Candle Smart Range ist ein technischer Indikator zur automatischen Identifizierung von Preisspannen in mehreren Zeitrahmen. Dieses Tool analysiert die Marktstruktur basierend auf Kerzenformationen und der Interaktion des Preises mit vorherigen Hochs und Tiefs. Hauptmerkmale: Range-Erkennung: Identifiziert Konsolidierungszonen vor impulsiven Bewegungen. Erkennung falscher Ausbrüche: Markiert Fälle, in denen der Preis ein vorheriges Niveau überschreitet, a
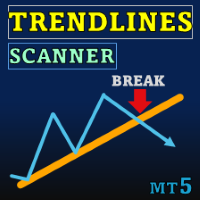
Special offer : ALL TOOLS , just $35 each! New tools will be $30 for the first week or the first 3 purchases ! Trading Tools Channel on MQL5 : Join my MQL5 channel to update the latest news from me Trendlines with Breaks Scanner ist ein hochmodernes Trading-Tool, das Tradern hilft, kritische Trends zu erkennen und Breakouts in Echtzeit zu identifizieren. Mit automatisch generierten Trendlinien, die auf Pivot-Punkten basieren, ermöglicht dieser Indikator den Tradern, Handelsmöglichk
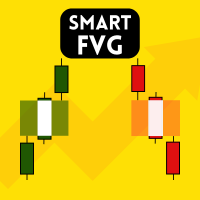
Smart FVG Indicator MT5 – Erkennung von Fair Value Gap und Imbalance in MetaTrader 5 Der Smart FVG Indicator MT5 ist ein professionelles Werkzeug zur Erkennung von Fair Value Gaps (FVG) und Imbalance -Zonen direkt im MetaTrader 5 . Er richtet sich an Trader, die mit Smart Money Concepts (SMC) und ICT -Analysen arbeiten, um Marktstruktur und Liquidität besser zu verstehen. Der Indikator scannt automatisch die Kursbewegung, um gültige FVG- und Imbalance-Zonen zu identifizieren, und zeigt diese dir
FREE

KLICKEN SIE HIER FÜR ALLE MEINE KOSTENLOSEN PRODUKTE
Wenn es darum geht, perfekte Marktchancen zu erkennen und Breakouts präzise zu handeln, gehört der RangeXpert zu den effektivsten Werkzeugen am Markt. Von mir speziell für Anfänger und Semi-Professionelle entwickelt, bringt RangeXpert eine Analysequalität, wie man sie sonst nur aus professionellen Trading-Tools für Banken, institutionelle Händler und Hedgefonds kennt. Der Indikator identifiziert Marktbereiche, die oft zu starken Bewegungen f
FREE

Easy Buy Sell ist ein Marktindikator für das Öffnen und Schließen von Positionen. Es wird einfach, Markteintritte mit Alarmen zu verfolgen.
Er zeigt Trendumkehrpunkte an, wenn ein Preis extreme Werte erreicht, und den günstigsten Zeitpunkt für den Einstieg in den Markt. Er ist genauso effektiv wie ein Fibonacci-Indikator, um ein Niveau zu finden, aber er verwendet andere Werkzeuge wie einen Algorithmus, der auf ATR-Indikatoren und dem Stochastik-Oszillator basiert. Sie können diese beiden Para

TREND FLOW PRO TREND FLOW PRO ist ein nicht neu zeichnender (Non-Repainting) Indikator, der die Marktrichtung anzeigt. Er identifiziert Trendwenden sowie erste und wiederholte Einstiege großer Marktteilnehmer. BOS -Markierungen im Chart stellen echte Trendwechsel und wichtige Ebenen höherer Zeiteinheiten dar. Die Daten werden nicht neu berechnet und bleiben nach dem Schluss jeder Kerze im Chart sichtbar. Fordere per privater Nachricht einen ausführlichen PDF-Leitfaden mit Strategie-Beispielen an

Werden Sie Breaker Trader und profitieren Sie von Änderungen der Marktstruktur, wenn sich der Preis umkehrt.
Der Order Block Breaker Indikator zeigt an, wann sich eine Trend- oder Preisbewegung der Erschöpfung nähert und bereit ist, sich umzukehren. Es weist Sie auf Änderungen in der Marktstruktur hin, die normalerweise auftreten, wenn eine Umkehrung oder ein größerer Rückzug bevorsteht.
Der Indikator verwendet eine proprietäre Berechnung, die Ausbrüche und Preisdynamik identifiziert. Jedes M

**Intelligenter Auto-Trendlinien-Indikator**
Der Smart Auto Trendline Indicator zeichnet automatisch Unterstützungs- und Widerstandstrendlinien auf Ihrem MetaTrader 5-Chart. Er identifiziert wichtige Preisniveaus mithilfe von zwei Methoden: Zwei Extreme (Typ 1) oder Extrem und Delta (Typ 2). Die Trendlinien werden nur aktualisiert, wenn ein neuer Balken entsteht, um eine optimale Leistung zu gewährleisten.
**Funktionen** - **Zwei Extreme (Typ 1):** Zeichnet Trendlinien basierend auf zwei Ex
FREE

Zusammenfassung: Der Sechs-Farben-Drachen-Indikator [MCD Hot Money] in ist ein weit verbreiteter technischer Indikator, der im Aktienhandel weit verbreitet ist. Er besteht aus sechs verschiedenen Indikatoren, darunter der SMA, der Relative-Stärke-Indikator, die gleitende Durchschnittsschlusslinie und so weiter. Dieser menschliche Indikator kann Anlegern effektiv helfen, den Zeitpunkt für den Kauf und Verkauf von Aktien zu bestimmen. Sechs-farbigen Drachen wird verwendet, um Chips zu sehen, um di

Gann 9+ Indikator Einführung Der "Gann-Matrix-Chart" ist die einfachste und klarste technische Analyse der Gann-Theorie und das Berechnungsinstrument, das Gann immer verwendet hat. Es ist die Essenz von Ganns ganzem Leben. Der Gann 9+ Indikator verwendet den Matrix Chart, um die zukünftigen Hoch- oder Tiefpunkte von Aktien oder Futures zu finden. Indikator-Eingabe: Die Basis und die Schrittweite können standardmäßig auf 1 gesetzt werden; Wenn der Multiplikator -1 ist, wird der Multiplikator aut

Dies ist ein Indikator für MT5, der genaue Signale für den Einstieg in einen Handel ohne Repainting (Neuzeichnen) liefert. Er kann auf alle Finanzwerte angewendet werden: Forex, Kryptowährungen, Metalle, Aktien, Indizes. Er liefert ziemlich genaue Schätzungen und sagt Ihnen, wann es am besten ist, eine Position zu eröffnen und zu schließen. Sehen Sie sich das Video (6:22) mit einem Beispiel für die Verarbeitung nur eines Signals an, das sich für den Indikator gelohnt hat! Die meisten Händler ver

Dieser Indikator bietet mehrere Zeichenwerkzeuge, die bei verschiedenen Methoden der Chartanalyse helfen.
Die Zeichnungen behalten ihre Proportionen (entsprechend ihrer Griff-Trendlinie) über verschiedene Chart-Skalen hinweg bei, werden in Echtzeit aktualisiert und es werden mehrere Zeichnungen unterstützt.
#
Zeichnung Option
Beschreibung
1 Rasterbox Ziehbares Gitter, Benutzer definiert Zeilen und Spalten, diagonale Strahlenoption 2 Raster Teil- oder Vollbildraster, Größe durch Griffleiste fes

SHOGUN TRADE PRO [MT5] - Professionelle Marktstruktur & Dow Theorie Suite Begrenzte Veröffentlichung: Early-Access-Preise Diese professionelle Suite ist derzeit zu einem Einführungspreis erhältlich, um ihre Einführung auf der MT5-Plattform zu feiern. Bitte beachten Sie, dass der Preis schrittweise angepasst wird, sobald Updates veröffentlicht werden und die Benutzerbasis wächst. Sichern Sie sich noch heute Ihren "Commander's Seat" zum günstigsten Preis. Die Reise des Entwicklers: Vom Rausch
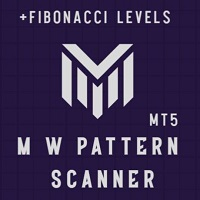
** Alle Symbole x Alle Zeitrahmen scannen nur durch Drücken der Scanner-Taste ** *** Kontaktieren Sie mich , um Ihnen eine Anleitung zu schicken und Sie in die "M W Scanner-Gruppe" aufzunehmen, damit Sie Ihre Erfahrungen mit anderen Nutzern austauschen und sehen können. Einführung: Double Top (M) und Double Bottom (W) ist eine sehr wiederkehrende gemeinsame Art von Preisumkehrmuster. Double Top ähnelt dem M-Muster und zeigt eine bärische Umkehrung an, während Double Bottom dem W-Muster ähnelt un

Der Indikator analysiert das Volumen von jedem beliebigen Punkt aus und berechnet die Erschöpfungsniveaus des Marktes für dieses Volumen. Hauptlinien von Meravith: Bullische Volumen-Erschöpfungslinie – dient als Ziel. Bärische Volumen-Erschöpfungslinie – dient als Ziel. Trendlinie – zeigt den Markttrend an. Sie ändert ihre Farbe je nachdem, ob der Markt bullisch oder bärisch ist, und dient als Trendunterstützung. Verwendung: Doppelklicken Sie auf die violette vertikale Linie und verschieben Sie

Elliott Wave Trend wurde für die wissenschaftliche Wellenzählung entwickelt. Dieses Tool konzentriert sich darauf, die Unschärfe der klassischen Elliott-Wellenzählung zu beseitigen, indem es die Richtlinien des Template- und Pattern-Ansatzes nutzt. Dabei bietet Elliott Wave Trend erstens die Vorlage für Ihre Wellenzählung. Zweitens bietet es den Wave Structural Score, um die genaue Wellenbildung zu identifizieren. Es bietet sowohl den Structural Score für Impulswellen als auch den Structure Scor
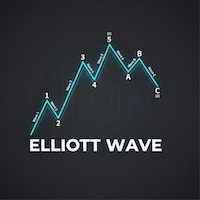
Automatisierte Elliott-Wellen-Theorie 1. Automatische Wellenzählung & Reduzierte Subjektivität Normalerweise beinhaltet das Zählen von Elliott-Wellen viel "Fantasie" oder persönliche Meinung. Dieser Indikator hilft durch: Finden von Impulswellen (1-2-3-4-5): Verwendet strenge Regeln (z.B. Welle 3 darf nicht die kürzeste sein), um die theoretisch korrekte Preisstruktur anzuzeigen. Finden von Korrekturwellen (A-B-C): Hilft, Rücksetzer zu erkennen, um Einstiegsmöglichkeiten im Trend zu finden. 2. A

Haven Volume Profile ist ein multifunktionaler Indikator für die Analyse des Volumenprofils, der dabei hilft, wichtige Preisniveaus basierend auf der Verteilung des Handelsvolumens zu identifizieren. Er wurde für professionelle Trader entwickelt, die den Markt besser verstehen und wichtige Einstiegspunkte sowie Ausstiegspunkte für ihre Trades erkennen möchten. Andere Produkte -> HIER Hauptfunktionen: Berechnung des Point of Control (POC) - des Niveaus mit der höchsten Handelsaktivität, um die l
FREE

AtBot: Wie es funktioniert und wie man es benutzt ### Wie es funktioniert Der "AtBot"-Indikator für die MT5-Plattform generiert Kauf- und Verkaufssignale mithilfe einer Kombination von technischen Analysetools. Er integriert den einfachen gleitenden Durchschnitt (SMA), den exponentiellen gleitenden Durchschnitt (EMA) und den Durchschnitt der wahren Reichweite (ATR)-Index, um Handelsmöglichkeiten zu identifizieren. Darüber hinaus kann er Heikin Ashi-Kerzen verwenden, um die Signalgenauigkeit zu

Dieser Indikator identifiziert die beliebtesten Harmonic Patterns , die Marktumkehrpunkte vorhersagen. Diese harmonischen Muster sind Kursformationen, die sich auf dem Devisenmarkt ständig wiederholen und auf mögliche zukünftige Kursbewegungen hindeuten / Free MT4 Version
Darüber hinaus verfügt dieser Indikator über ein eingebautes Markteintrittssignal sowie über verschiedene Gewinnmitnahmen und Stop-Losses. Es ist zu beachten, dass der Harmonische Muster-Indikator zwar eigenständig Kauf-/
FREE

Simple QM Pattern ist ein leistungsstarker und intuitiver Handelsindikator, der die Identifizierung des Quasimodo (QM) Handelsmusters vereinfacht. Das QM-Muster ist unter Händlern weithin dafür bekannt, dass es potenzielle Umschwünge effektiv signalisiert , indem es wichtige Marktstrukturen und Preisaktionsformationen hervorhebt. Dieser Indikator hilft Händlern, das QM-Muster direkt auf ihren Charts zu visualisieren, so dass es selbst für diejenigen, die noch nicht mit dem Musterhandel vertraut
FREE

MACD Intraday Trend ist ein Indikator, der durch eine Adaption des ursprünglichen MACD von Gerald Appel in den 1960er Jahren entwickelt wurde.
Im Laufe der Jahre des Handels wurde beobachtet, dass wir durch die Änderung der Parameter des MACD mit Fibonacci-Proportionen eine bessere Darstellung der Kontinuität der Trendbewegungen erreichen, wodurch es möglich ist, den Beginn und das Ende eines Preistrends effizienter zu erkennen.
Aufgrund seiner Effizienz bei der Erkennung von Kurstrends ist e
FREE
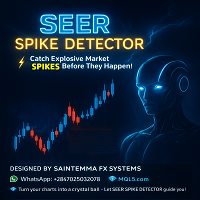
N/B : Alle unsere Produktkäufe kommen mit unserem kostenlosen ''DAILY SCALPER EA'' - bit .ly/4qlFLNh Whatsapp Entwickler für Ihre nach erfolgreichem Kauf SEER SPIKE DETECTOR.
Das ultimative Markt-Reversal & Spike Forecasting Tool für Crash & Boom Indizes, Forex & Synthetische Märkte
Am besten auf M1 und M5 Stoploss: Maximal 10 Kerzen.
Was ist der SEER SPIKE DETECTOR?
Der SEER SPIKE DETECTOR ist ein Marktvorhersage-Indikator der nächsten Generation, der entwickelt wurde, um Spikes, Reversal

Der Indikator Market Sessions ist bei Devisen- und Aktienhändlern ein beliebtes Instrument zur visuellen Darstellung globaler Handelssitzungen in einem Kursdiagramm. Er hebt die Zeiträume für die wichtigsten Handelssitzungen - wie die asiatische (Tokio) , europäische (London) und amerikanische (New York) Sitzung - direkt im Diagramm hervor. Dies hilft Händlern zu erkennen, wann die Märkte öffnen und schließen, und ermöglicht eine bessere Entscheidungsfindung auf der Grundlage des sitzungsspezif
FREE

Dieser Indikator erkennt Preisumkehrungen im Zick-Zack, wobei nur Preisaktionsanalysen und ein Donchian-Kanal verwendet werden. Es wurde speziell für den kurzfristigen Handel entwickelt, ohne dass ein Nachlackieren oder ein Backpainting erforderlich ist. Es ist ein fantastisches Werkzeug für clevere Trader, die darauf abzielen, das Timing ihrer Operationen zu verbessern. [ Installationsanleitung | Update-Anleitung | Fehlerbehebung | FAQ | Alle Produkte ]
Erstaunlich einfach zu handeln Es biet

Entry Point M5 — ein vollständiges Handelssystem. Entry Point M5 ist ein leistungsstarker Indikator, der als vollständiges Handelssystem für alle Währungspaare entwickelt wurde. Er analysiert die Preisstruktur, erkennt entscheidende Umkehrpunkte und den Beginn neuer Marktimpulse. Der Indikator passt sich automatisch an verschiedene Marktphasen an – von starken Trendbewegungen bis hin zu Seitwärtsphasen – und liefert klar verständliche visuelle Signale, ganz ohne zusätzliche Filter oder Hilfsindi

Der Basic Supply Demand Indicator ist ein leistungsfähiges Tool, das Ihre Marktanalyse verbessert und Ihnen hilft, Schlüsselbereiche auf jedem Chart zu identifizieren. Mit einer intuitiven und einfach zu bedienenden Benutzeroberfläche bietet Ihnen dieser kostenlose Metatrader-Indikator einen klaren Überblick über die Angebots- und Nachfragezonen und ermöglicht es Ihnen, fundiertere und genauere Handelsentscheidungen zu treffen / Kostenlose MT4-Version Dashboard Scanner für diesen Indikato
FREE

King Smart Liquidity MT5 ist ein fortschrittlicher analytischer Indikator, der speziell dazu entwickelt wurde, institutionelle Geldflüsse und Großbanken auf Forex, Gold, Indizes, Bitcoin und anderen Märkten zu verfolgen. Dieser Indikator wurde auf der Grundlage der "Smart Money Concept"-Methodik entwickelt, die auf dem Verständnis von Price Action, Liquiditätszonen und dem Marktverhalten großer Finanzinstitute basiert. Der Indikator zeichnet nicht nur einfach Linien oder Zonen, sondern bietet e
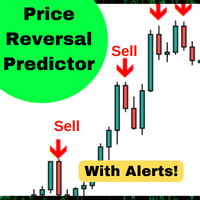
Dieser Algorithmus prognostiziert kurzfristige Preisänderungen mit einer Genauigkeit von 90% *. Prognostiziert, ob der Preis höher oder niedriger als die Signalkerze sein wird. Perfekt für den Mean-Reversion-Handel, binäre Optionen oder Futures-Kontrakte in größeren Zeiträumen. Der Indikator wurde anhand von Daten aus 5 Jahren erneut getestet und hat eine Genauigkeit von 90% für die Vorhersage von Preisumkehrungen im Laufe der Zeit.
Ausstattung:
Einfache Einrichtung Ziehen und Ablegen auf ein
FREE

Der Indikator „ Dynamic Scalper System MT5 “ ist für Scalping-Handel innerhalb von Trendwellen konzipiert.
Getestet an wichtigen Währungspaaren und Gold, Kompatibilität mit anderen Handelsinstrumenten ist gegeben.
Liefert Signale für die kurzfristige Eröffnung von Positionen entlang des Trends mit zusätzlicher Unterstützung von Kursbewegungen.
Das Prinzip des Indikators:
Große Pfeile bestimmen die Trendrichtung.
Ein Algorithmus zur Generierung von Scalping-Signalen in Form kleiner Pfeile arbei

Natürlich, hier ist die Übersetzung in Deutsch: Vorstellung des Astronomie-Indikators für MT4 / MT5 : Dein ultimativer himmlischer Trading-Begleiter Bist du bereit, deine Trading-Erfahrung auf himmlische Höhen zu heben? Suche nicht weiter als unseren revolutionären Astronomie-Indikator für MT4. Dieses innovative Tool übertrifft herkömmliche Trading-Indikatoren und nutzt komplexe Algorithmen, um dir unvergleichliche astronomische Einblicke und präzise Berechnungen zu bieten. Ein Universum an In

Meravith Auto ist eine automatisierte Version des Handelssystems Meravith. Der Indikator besteht aus einer Trendlinie, die ihre Farbe ändert. Bei einem Aufwärtstrend ist sie grün, bei einem Abwärtstrend rot. Dies ist die Unterstützungslinie des Trends. Eine Liquiditätslinie, bei der das Aufwärtsvolumen dem Abwärtsvolumen entspricht. Eine dreifache bullische Abweichungslinie. Eine dreifache bärische Abweichungslinie. Lila und blaue Punkte, die auf hohes Volumen hinweisen. Der lila Punkt zeigt ein
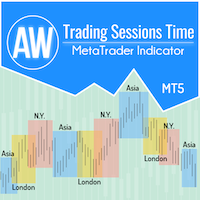
Damit Händler bequem Daten zur Entwicklung der Märkte erhalten und Handelsstrategien besser formulieren können, haben wir einen Handelssitzungsindikator entwickelt. Die Öffnungszeiten verschiedener Börsen wirken sich auf den Handel aus, da sie die Marktaktivität und das Handelsvolumen beeinflussen. Diese Faktoren bestimmen die Volatilität und Handelsmöglichkeiten verschiedener Instrumente. Der AW Trading Sessions Time-Indikator zeigt die Handelszeiten der asiatischen, Londoner und New Yorker Mä
FREE
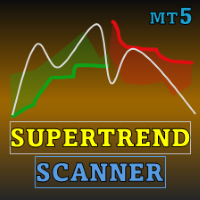
Special offer : ALL TOOLS , just $35 each! New tools will be $30 for the first week or the first 3 purchases ! Trading Tools Channel on MQL5 : Join my MQL5 channel to update the latest news from me Wir präsentieren den SuperTrend ATR Multiplier with Scanner for MT5 – ein vielseitiges und leistungsstarkes Werkzeug, das Ihnen hilft, den Markttrends voraus zu sein, mit anpassbaren Funktionen und Echtzeitwarnungen. Dieses Tool basiert auf der bewährten SuperTrend -Logik von Kivanc Ozbi
FREE
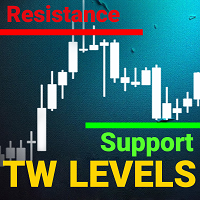
support resistance levels indicator mt5:
Dieses Tool ist ein Multi-Zeitrahmen-Indikator, der Support- und Widerstandslinien sowie Fibonacci-Niveaus mit der gleichen Genauigkeit wie das menschliche Auge auf einem Chart identifiziert und darstellt. Die TW-Support- und Widerstandsniveaus für Forex verfügen über einen komplexen Algorithmus, der das Chart scannt, um frühere Preisstabilisierungs- und Rückprallniveaus zu identifizieren und die Anzahl der Berührungen aufzuzeichnen.
Sind Sie es leid

Dieser Algorithmus prognostiziert kurzfristige Preisänderungen mit einer Genauigkeit von 86% *. Wenn es eine große Bewegung gibt, wie durch die ATR bestimmt, während einer überkauften oder überverkauften Bedingung, wird der Indikator Sie warnen. Prognostiziert, ob der Preis höher oder niedriger als die Signalkerze sein wird. Perfekt für den Mean-Reversion-Handel, binäre Optionen oder Futures-Kontrakte in größeren Zeiträumen. Der Indikator wurde anhand von Daten aus 5 Jahren erneut getestet und
FREE

Der Stratos Pali-Indikator ist ein revolutionäres Instrument zur Verbesserung Ihrer Handelsstrategie durch die genaue Erkennung von Markttrends. Dieser hochentwickelte Indikator verwendet einen einzigartigen Algorithmus, um ein vollständiges Histogramm zu erstellen, das aufzeichnet, wann der Trend Long oder Short ist. Bei einer Trendumkehr erscheint ein Pfeil, der die neue Richtung des Trends anzeigt.
Wichtige Informationen aufgedeckt Hinterlassen Sie eine Bewertung und kontaktieren Sie mich p
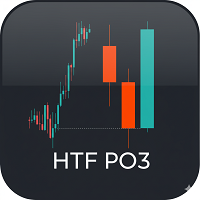
Produktname: HTF PO3 – Anzeige von höheren Zeitrahmen-Kerzen Beschreibung
HTF PO3 ist ein leistungsstarkes Visualisierungstool für MetaTrader 5. Es zeigt Kerzen höherer Zeitrahmen (HTF) direkt im Hauptchart an, sauber auf der rechten Seite positioniert. Dadurch können Trader eine Multi-Zeitrahmen-Analyse durchführen, ohne zwischen Charts wechseln zu müssen, und gleichzeitig die Marktstruktur übergeordneter Zeitebenen erkennen. Ideal für Trader, die Preisniveaus höherer Zeitrahmen (z. B. täglich
FREE

Divergenzen sind schwierig zu finden und seltener anzutreffen. Sie sind eines der zuverlässigsten Handelsszenarien. Dieser Indikator sucht automatisch mit Ihrem bevorzugten Oszillator nach regelmäßigen und versteckten Abweichungen. [ Installationsanleitung | Update-Anleitung | Fehlerbehebung | FAQ | Alle Produkte ]
Einfach zu handeln
Findet regelmäßige und versteckte Abweichungen Unterstützt viele bekannte Oszillatoren Implementiert Handelssignale basierend auf Ausbrüchen Zeigt geeignete Sto

Mean-Reversion-Angebot-Nachfrage-Indikator Mean Reversion Supply Demand ist ein Indikator zur Erkennung der wichtigen Angebots-Nachfrage-Zone in Ihrem Chart. Das Konzept des Angebots-Nachfrage-Handels beruht auf dem quantitativen Ungleichgewicht zwischen Kauf- und Verkaufsvolumen auf dem Finanzmarkt. In der Regel dient die Angebots-Nachfrage-Zone dazu, den Wendepunkt vorherzusagen. Damit eine Angebots-Nachfrage-Zone als erfolgreicher Handel funktioniert, sieht das Wellenmuster so aus, dass der K

Matrix Arrow Indicator MT5 ist ein einzigartiger 10-in-1-Trend, der zu 100 % nicht neu gezeichnet werden kann. Multi-Timeframe-Indikator, der für alle Symbole/Instrumente verwendet werden kann: Forex , Rohstoffe , Kryptowährungen , Indizes , Aktien . Der Matrix Arrow Indicator MT5 wird den aktuellen Trend in seinen frühen Stadien bestimmen und Informationen und Daten von bis zu 10 Standardindikatoren sammeln, die sind: Durchschnittlicher Richtungsbewegungsindex (ADX) Rohstoff

ICT, SMC, SMART MONEY CONCEPTS, SMART MONEY, Smart Money Concept, Support and Resistance, Trend Analysis, Price Action, Market Structure, Order Blocks, BOS/CHoCH, Breaker Blocks , Momentum Shift, Supply&Demand Zone/Order Blocks , Strong Imbalance, HH/LL/HL/LH, Fair Value Gap, FVG, Premium & Discount Zones, Fibonacci Retracement, OTE, Buy Side Liquidity, Sell Side Liquidity, BSL/SSL Taken, Equal Highs & Lows, MTF Dashboard, Multiple Time Frame, BigBar, HTF OB, HTF Market Structure
Der Trend Line PRO Indikator ist eine unabhängige Handelsstrategie. Er zeigt den Trendwechsel, den Einstiegspunkt in die Transaktion an und berechnet automatisch drei Ebenen des Take-Profit- und Stop-Loss-Schutzes.
Trend Line PRO ist perfekt für alle Meta Trader-Symbole: Währungen, Metalle, Kryptowährungen, Aktien und Indizes. Der Indikator wird im Handel auf realen Konten verwendet, was die Zuverlässigkeit der Strategie bestätigt. Robots, die Trend Line PRO verwenden , und echte Signale finden

Dieser Informationsindikator ist nützlich für diejenigen, die immer über die aktuelle Situation auf dem Konto informiert sein möchten.
- Weitere nützliche Indikatoren Der Indikator zeigt Daten wie Gewinn in Punkten, Prozentsatz und Währung sowie den Spread für das aktuelle Paar und die Zeit bis zum Schließen des Balkens im aktuellen Zeitrahmen an. Für die Platzierung der Informationslinie im Diagramm gibt es mehrere Möglichkeiten: Rechts vom Preis (läuft hinter dem Preis); Als Kommentar (in d
FREE
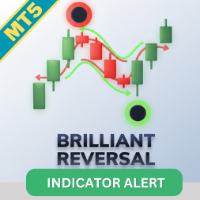
Erhöhen Sie Ihre Trading-Strategie mit dem Brilliant Reversal Indicator MT5 , einem innovativen Indikator, der nicht-parametrische Kernel-Regression nutzt, um eine glatte, adaptive Trendanalyse zu liefern. Inspiriert vom Nadaraya-Watson-Schätzer, wendet dieses Tool Gaussian Kernel-Glättung auf Preisdaten an, um dynamische Envelopes zu erzeugen, die sich an die Markvolatilität anpassen, ohne die übermäßige Verzögerung traditioneller gleitender Durchschnitte. Weit anerkannt auf Plattformen wie T
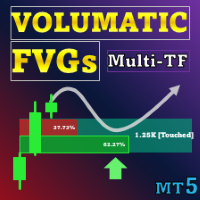
Sonderangebot : ALL TOOLS , nur $35 pro Stück! Neue Tools kosten $30 in der ersten Woche oder für die ersten 3 Käufe ! Trading Tools Channel on MQL5 : Treten Sie meinem MQL5-Kanal bei, um meine neuesten Nachrichten zu erhalten Volumatic Fair Value Gaps (FVG) identifiziert und verwaltet bedeutende Preis-Ungleichgewichtszonen und zerlegt das richtungsbezogene Volumen innerhalb jedes Gaps. Das Volumen wird aus einem niedrigeren Zeitrahmen (Standard M1, vom Nutzer wählbar) entnommen,

Schluss mit der manuellen Berechnung von Losgrößen. Hören Sie auf, Ihr Risiko/Gewinn-Verhältnis zu schätzen. Das Risk Reward Tool bringt den intuitiven, visuellen Handelsstil von TradingView direkt auf Ihre MetaTrader 5 Charts. Es wurde für Trader entwickelt, die Wert auf Geschwindigkeit, Präzision und visuelle Klarheit legen. Egal, ob Sie mit Devisen, Indizes (DAX, US30) oder Rohstoffen (Gold, Öl) handeln, dieses Tool erledigt die mathematischen Aufgaben für Sie. Klicken Sie einfach auf "Long"
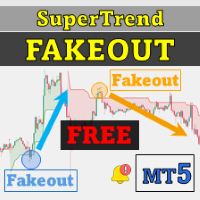
Special offer : ALL TOOLS , just $35 each! New tools will be $30 for the first week or the first 3 purchases ! Trading Tools Channel on MQL5 : Join my MQL5 channel to update the latest news from me Der Supertrend Fakeout -Indikator ist eine verbesserte Version des klassischen Supertrend -Indikators, der entwickelt wurde, um zuverlässigere Trendsignale zu liefern. Durch die Integration fortschrittlicher Funktionen wie Fakeout Index Limit und Fakeout ATR Mult hilft dieser Indikator,
FREE

Currency RSI Scalper MT5 - ist ein professioneller Indikator, der auf dem beliebten Relative Strength Index (RSI) basiert. Dieses Produkt ist ein Oszillator mit dynamischen überkauften und überverkauften Niveaus, während diese Niveaus im Standard-RSI statisch sind und sich nicht ändern. Dies ermöglicht es Currency RSI Scalper, sich an den sich ständig ändernden Markt anzupassen. Wenn ein Kauf- oder Verkaufssignal erscheint, wird ein Pfeil auf dem Chart gezeichnet und eine Warnung ausgelöst, die

SynaptixQuant Dominanz-Matrix: Institutional-Grade Market State Extraction
Entwickelt für Händler, die eine datengestützte Sicht auf das Marktverhalten benötigen, die über oberflächliche Indikatoren hinausgeht. Die Synaptix Quant (SQ) Dominanzmatrix ist keine herkömmliche Anzeige der Währungsstärke. Hinter der bewusst schlanken Oberfläche verbirgt sich eine ausgeklügelte analytische Architektur, die darauf ausgelegt ist, Marktbedingungen präzise zu quantifizieren. Jede Ausgabe wird durch eine m

Sichern Sie sich Ihre Kopie zum aktuellen Preis — dieser kann jederzeit steigen. Das Ziel des "Black Horse"-Indikators besteht darin, Abweichungen zwischen der Preisentwicklung und dem VWAP-Indikator zu identifizieren. Er verwendet Filter, um potenziell falsche Abweichungen herauszufiltern und hochwertige, genaue Warnungen zu generieren.
Bearish-Abweichungen werden durch rote Punkte über der Kerze dargestellt, während Bullish-Abweichungen durch grüne Punkte unter der Kerze repräsentiert werden

Sind Sie es leid, Unterstützungs- und Widerstandslinien zu zeichnen? Der Unterstützungswiderstand ist ein Multi-Zeitrahmen-Indikator, der Unterstützungs- und Widerstandslinien mit einer sehr interessanten Wendung automatisch erkennt und zeichnet: Wenn das Preisniveau im Laufe der Zeit getestet wird und seine Bedeutung zunimmt, werden die Linien dicker und dunkler. [ Installationsanleitung | Update-Anleitung | Fehlerbehebung | FAQ | Alle Produkte ] Steigern Sie Ihre technische Analyse über Nacht

Dies ist der beste Unterstützungs- und Widerstandsindikator auf dem Markt, der sowohl bestätigte Unterstützungen und Widerstände als auch Wiederholungen anzeigt. Unterstützung und Widerstand: Die Unterstützung markiert den Punkt, an dem die Kaufnachfrage den Preisrückgang aufhält und als Sicherheitsnetz fungiert. Der Widerstand begrenzt den durch den Verkaufsdruck ausgelösten Preisanstieg. Händler nutzen diese Niveaus zur Vorhersage von Umschwüngen, zur Planung von Ein- und Ausstiegen und zur R
FREE

Ganz einfach: Sie können mit dem Handel beginnen, sobald die Bewegung der weißen Zahlen – bekannt als „Pips“ – neben der aktuellen Kerze erscheint. Die weißen „Pips“ zeigen an, dass ein Kauf- oder Verkaufsauftrag derzeit aktiv ist und sich in die richtige Richtung bewegt, was durch die weiße Farbe angezeigt wird. Wenn die Bewegung der weißen Pips stoppt und in eine statische grüne Farbe übergeht, signalisiert dies das Ende der aktuellen Dynamik. Die grüne Farbe der Zahlen stellt den Gesamtgewin

RelicusRoad Pro: Quantitatives Markt-Betriebssystem 70% RABATT AUF LEBENSLANGEN ZUGANG (BEGRENZTE ZEIT) - ÜBER 2.000 TRADER Warum scheitern die meisten Trader trotz "perfekter" Indikatoren? Weil sie einzelne Konzepte isoliert handeln. Ein Signal ohne Kontext ist ein Glücksspiel. Für konstante Gewinne benötigen Sie KONFLUENZ . RelicusRoad Pro ist kein einfacher Pfeil-Indikator. Es ist ein vollständiges quantitatives Markt-Ökosystem . Es bildet die „Fair Value Road“ ab und unterscheidet zwischen R

Die meisten Trader sehen Engulfing-Kerzen. Wenige wissen, wie man sie profitabel handelt. Engulfing Pro Trader gibt Ihnen einfache Signale und echte Statistiken — Trades, Gewinne, Profite — um Umkehrungen mit Vertrauen zu handeln. Keine Hoffnungen, nur die echten Zahlen, die Sie brauchen. Bei Real Trades zeigen wir Ihnen, was wahr ist, nicht was träumerisch ist. Haben Sie die Realität der Engulfing-Strategie gesehen und mögen sie? Hinterlassen Sie uns eine 5-Sterne-Bewertung und schreiben Sie m
FREE

Dark Power ist ein Indikator für den Intraday-Handel. Dieser Indikator basiert auf der Trendfolgestrategie und verwendet ein Histogramm, um die richtige Leistung zu bestimmen. Mit diesem Indikator kann man bei guten Preisen einsteigen, um dem starken Trend des aktuellen Instruments zu folgen. Das Histogramm wird auf der Grundlage der Größe der Balken berechnet und zwei gleitende Durchschnitte, die auf dem Histogramm berechnet werden, bestimmen die Richtung des Signals.
Wichtigste Vorteile
Leich
Ist Ihnen bekannt, warum der MetaTrader Market die beste Plattform für den Verkauf von Handelsstrategien und technischer Indikatoren ist? Der Entwickler braucht sich nicht mit Werbung, Programmschutz und Abrechnung mit Kunden zu beschäftigen. Alles ist bereits erledigt.
Sie verpassen Handelsmöglichkeiten:
- Freie Handelsapplikationen
- Über 8.000 Signale zum Kopieren
- Wirtschaftsnachrichten für die Lage an den Finanzmärkte
Registrierung
Einloggen
Wenn Sie kein Benutzerkonto haben, registrieren Sie sich
Erlauben Sie die Verwendung von Cookies, um sich auf der Website MQL5.com anzumelden.
Bitte aktivieren Sie die notwendige Einstellung in Ihrem Browser, da Sie sich sonst nicht einloggen können.