MetaTrader 5용 기술 지표 - 2

LT 회귀 채널을 발견하세요. 이는 피보나치 분석, 엔벨로프 분석 및 푸리에 외삽의 요소를 결합한 강력한 기술 지표입니다. 이 지표는 시장 변동성을 평가하며 피보나치 분석을 통해 과매수 및 과매도 수준을 정확하게 식별하도록 설계되었습니다. 또한 이러한 지표의 데이터를 통합하여 시장 움직임을 예측하기 위해 푸리에 외삽을 활용합니다. 우리의 다용도 도구는 독립적으로 또는 다른 지표와 조합하여 사용할 수 있습니다. 다양한 시간대 및 차트 유형과 호환되며 Renko 및 Heiken Ashi와 같은 사용자 정의 옵션도 포함됩니다. 일부 재그리기가 발생할 수 있지만 장기 시간대(500 이상 권장)로 갈수록 안정성이 크게 향상됩니다. 더 큰 시간대에서는 더 정확한 예측을 제공합니다. LT 회귀 채널의 힘을 여러분의 거래 전략에 경험해보세요. 지금 바로 시도해 보세요!
FREE
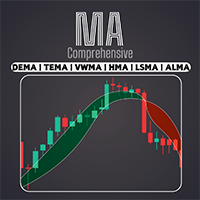
전문 종합 이동평균 지표로 EMA, SMA, WMA 등 다양한 이동평균을 이용할 수 있습니다. 고유한 트레이딩 스타일/ MT4 버전에 맞게 이동평균을 완벽하게 조합하여 기술적 분석을 사용자 지정할 수 있습니다.
특징
서로 다른 설정으로 두 개의 이동평균을 활성화할 수 있습니다. 차트 설정을 사용자 지정할 수 있습니다. 교차 이평선 또는 이평선과 교차한 가격에 따라 캔들 스틱의 색상을 변경할 수 있습니다. 교차 이평선 또는 교차 가격 발생 시 알림 전송.
포함된 이동평균 유형 SMA --------------------> (Simple) EMA --------------------> (Exponential) SMMA [RMA] ----------> (Smoothed) WMA -------------------> (Linear Weighted) DEMA ------------------> (Double EMA) TEMA ----------------
FREE

ARICoin is a powerful trading companion designed to generate high-probability entry signals with dynamic TP/SL/DP levels based on volatility. Built-in performance tracking shows win/loss stats, PP1/PP2 hits, and success rates all updated live. Key Features: Buy/Sell signals with adaptive volatility bands Real-time TP/SL/DP levels based on ATR Built-in MA Filter with optional ATR/StdDev volatility Performance stats panel (Success, Profit/Loss, PP1/PP2) Alerts via popup, sound, push, or email Cust
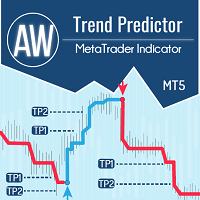
하나의 시스템에서 추세와 고장 수준의 조합입니다. 고급 지표 알고리즘은 시장 노이즈를 필터링하고 추세, 진입점 및 가능한 출구 수준을 결정합니다. 표시기 신호는 통계 모듈에 기록되어 가장 적합한 도구를 선택하여 신호 기록의 효율성을 보여줍니다. 이 표시기는 이익 실현 및 손절매 표시를 계산합니다. 매뉴얼 및 지침 -> HERE / MT4 버전 -> HERE 지표로 거래하는 방법: Trend Predictor로 거래하는 것은 3단계로 간단합니다. 1단계 - 포지션 열기 70% 이상의 성공률로 매수 신호를 받았습니다. 2단계 - StopLoss 결정 반대 신호로 트렁크 선택 3단계 - 이익 실현 전략 정의 전략 1: TP1 도달 시 전체 포지션 청산 전략 2: TP1 도달 시 포지션의 50% 청산 및 TP2 도달 시 나머지 50% 청산 전략 3: 추세 반전 시 전체 포지션 청산 이익: 결과를 다시 그리지 않음, 신호는 엄격하게 양초가 닫힐 때 어드바이저에서 사용할 수 있습니

ARIScalp is a powerful trading companion designed to generate high-probability entry signals with dynamic TP/SL/DP levels based on volatility. Built-in performance tracking shows win/loss stats, PP1/PP2 hits, and success rates all updated live. Key Features: Buy/Sell signals with adaptive volatility bands Real-time TP/SL/DP levels based on ATR Built-in MA Filter with optional ATR/StdDev volatility Performance stats panel (Success, Profit/Loss, PP1/PP2) Alerts via popup, sound, push, or email Cus

BigPlayerRange – MT5 최고의 지표 BigPlayerRange 는 MetaTrader 5에서 미니 인덱스와 미니 달러를 위한 최고의 지표 로 평가받고 있습니다. 이 도구는 주요 기관 투자자들의 전략적 영역을 강조하여 높은 정확도의 기관 기술 분석을 제공합니다. BigPlayerRange 사용법: 이 지표는 매수 구간(녹색선)과 매도 구간(빨간선)을 표시합니다. 가격이 이 구간 밖에서 마감되면 추세 움직임이 예상됩니다. 녹색선 위에서 마감: 강한 매수세와 상승 추세 가능성. 빨간선 아래에서 마감: 매도 압력과 하락 가능성. 범위 내에서 마감: 횡보 시장, 돌파 신호 대기. 주요 혜택: 기관 투자자 영역 매핑: 주요 투자자들의 활동 구간을 식별합니다. 자동 목표 지점 산출: 거래 종료에 적합한 목표 지점을 제공합니다. 풀백 분석: 리스크 관리를 위한 가격 반등 가능성 평가. 활용 방법: BigPlayerRange와 함께 Imba

AtBot: 작동 방식 및 사용 방법 ### 작동 방식 MT5 플랫폼용 "AtBot" 지표는 기술 분석 도구의 조합을 사용하여 매수 및 매도 신호를 생성합니다. 01:37 단순 이동 평균(SMA), 지수 이동 평균(EMA), 평균 진폭 범위(ATR) 지수를 통합하여 거래 기회를 식별합니다. 또한 Heikin Ashi 캔들을 사용하여 신호의 정확성을 향상시킬 수 있습니다. 구매 후 리뷰를 남기면 특별 보너스 선물을 받게 됩니다. ### 주요 기능: - 비재표시: 신호는 플로팅 후 변경되지 않습니다. - 비재작성: 신호는 일관되며 변경되지 않습니다. - 지연 없음: 지연 없이 시기적절한 신호를 제공합니다. - 다양한 시간대: 거래 전략에 맞게 모든 시간대에서 사용할 수 있습니다. ### 운영 단계: #### 입력 및 설정: - firstkey (TrendValue): 추세 감지의 민감도를 조정합니다. - Secondkey (SignalValue): 매수/매도 신호 생성의 민감도를 정의
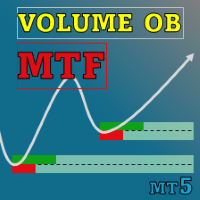
Special offer : ALL TOOLS , just $35 each! New tools will be $30 for the first week or the first 3 purchases ! Trading Tools Channel on MQL5 : Join my MQL5 channel to update the latest news from me 다중 시간 프레임의 체적 주문 블록 지표는 주요 시장 참가자들이 주문을 축적하는 중요한 가격 영역을 식별하여 시장 행동에 대한 더 깊은 통찰을 원하는 트레이더들을 위해 설계된 강력한 도구입니다. 이 영역들은 체적 주문 블록으로 알려져 있으며, 잠재적 지지 및 저항 구역으로 작용해 정보에 입각한 거래 결정에 중요한 이점을 제공합니다. MT4 버전 보기: Volumetric Order Blocks MT4 Multi Timeframe See more products at: https://www.mql5.com

Crystal Supply Demand Pro (SD Pro)
모든 캔들에서 거래하지 마세요 – 기관 존을 기다리세요. Crystal Supply Demand Pro (SD Pro)는 MetaTrader 5용 전문 공급/수요(Supply & Demand) 존 표시기입니다.
차트를 무작위 박스나 오래된 개념으로 채우는 대신, 기관 수준의 깨끗하고 명확한 존 만 표시합니다.
고차원 타임프레임에 최적화되어 있으며, 실시간 업데이트와 전문적인 시각 효과를 제공합니다. 주요 기능 기관 수준의 수요/공급 존 탐지. 새로운 존과 이미 테스트된 존 구분. H1, H4, D1, W1 최적화. 실시간 업데이트, 리페인트 없음. 전문가용 비주얼 (색상, 투명도, 50% 중간선, 라벨). 실시간 통계 패널. 타임프레임 경고 시스템. 가볍고 효율적인 성능. 왜 SD Pro 인가? 대부분의 공급/수요 인디케이터는 차트를 불필요하게 복잡하게 만듭니다.
SD Pro는 의미 있는 존만 필터링 하여 전문적으로 보
FREE

RelicusRoad Pro: 퀀트 시장 운영 체제 70% 할인 평생 이용권 (한정 시간) - 2,000명 이상의 트레이더와 함께하세요 왜 대부분의 트레이더는 "완벽한" 지표를 가지고도 실패할까요? 진공 상태에서 단일 개념 만으로 거래하기 때문입니다. 문맥 없는 신호는 도박입니다. 지속적인 승리를 위해서는 컨플루언스(중첩) 가 필요합니다. RelicusRoad Pro는 단순한 화살표 지표가 아닙니다. 완전한 퀀트 시장 생태계 입니다. 독점적인 변동성 모델링을 사용하여 가격이 이동하는 "공정 가치 로드"를 매핑하고, 단순 노이즈와 실제 구조적 돌파를 구분합니다. 추측은 그만두세요. 기관급 로드 로직으로 거래를 시작하세요. 핵심 엔진: "Road" 알고리즘 시스템의 중심에는 시장 상황에 실시간으로 적응하는 동적 변동성 채널인 Road Algo 가 있습니다. 세이프 라인(평형) 과 가격이 수학적으로 반전될 가능성이 높은 확장 레벨 을 투영합니다. Simple Road: 일반적인 시장을 위

여기를 클릭하여 제 모든 무료 제품을 확인하세요
완벽한 시장 기회를 식별하고 브레이크아웃을 정확하게 거래하는 데 있어서 RangeXpert 는 시장에서 가장 효과적인 도구 중 하나 입니다. 초보자와 세미프로를 위해 특별히 개발되었으며, 일반적으로 은행, 기관 트레이더, 헤지펀드가 사용하는 전문 트레이딩 도구 에서만 볼 수 있는 분석 품질을 제공합니다. 이 인디케이터는 강한 가격 움직임으로 이어지는 시장 영역을 식별하고 이를 매우 명확하고 직관적으로 표시하여 복잡한 구조도 즉시 시각화됩니다. RangeXpert 는 잘못된 결정을 줄이고 타이밍을 개선하며, 레인지가 끝나고 실제 추세가 시작되는 시점을 실시간으로 보여줍니다. 변동성에 대한 동적 적응, 여러 포지션의 강도, 스마트한 이익 분배를 통해 이것은 오늘날 트레이더들이 사용하는 가장 강력한 브레이크아웃 인디케이터 중 하나 가 되었습니다.
사양 완벽한 진입 구간 완벽하게 최적화된 차트 뷰 명확하게 보이는 테이크프로핏 및 스탑
FREE

MetaTrader 5용 Candle Smart Range (CSR) Candle Smart Range는 여러 타임프레임에서 가격 범위를 자동으로 식별하도록 설계된 기술 지표입니다. 이 도구는 캔들 형성 및 이전 고점/저점과의 상호작용을 바탕으로 시장 구조를 분석합니다. 주요 기능: 범위 감지: 급격한 변동 전의 횡보 구간을 자동으로 식별합니다. 거짓 돌파 식별: 가격이 이전 수준을 넘어섰으나 캔들 종가 기준으로 범위 내에서 마감된 경우를 표시합니다. 멀티 타임프레임 분석: 사용자 정의 주기를 포함하여 최대 19개의 타임프레임 데이터를 한 차트에 표시합니다. 내부 시각화 (줌): 차트 변경 없이 상위 타임프레임 캔들 내부의 가격 움직임을 확인할 수 있습니다. 시간 필터: 주요 시장 세션 등 특정 시간대에만 작동하도록 설정 가능합니다. 과거 데이터 복기 모드: 과거 데이터를 단계별로 탐색하며 지표의 작동을 분석할 수 있습니다. 알림 시스템: 캔들 마감 및 새로운 범위 감지에 대한 사용

Spike Detector XTREEM – Boom, Crash 및 Pain/Gain 시장을 위한 정밀 스파이크 감지 Spike Detector XTREEM은 빠르게 변하는 합성 지수 시장에 전문 수준의 스파이크 분석을 제공합니다. 모든 가격 변동에 반응하는 대신, 이 지표는 지능형 필터링을 통해 실제 스파이크 형성을 식별하여, 모멘텀이 중요한 순간에 자신 있게 거래에 진입할 수 있도록 합니다. 이 지표를 구매하면 Histogram Trend 지표를 무료 로 드립니다! 합성 지수 전용 단일 로직 Spike Detector XTREEM은 다음 시장의 고유한 특성에 맞게 특별히 설계되었습니다: Boom 및 Crash 지수 (모든 변형) Weltrade Pain & Gain 시장 이 지표는 심볼의 행동 패턴에 자동으로 적응하며, 시장의 노이즈를 걸러내고 통계적으로 유의미한 스파이크 형성만을 집중적으로 표시합니다. 수동 조정이 필요하지 않습니다. 신호 과부하 대신 스마트 필터링 모든 잠재

Rtc ML Ai | Predictor CORE MACHINE LEARNING ENGINE
Adaptive ML Market Predictor – Multi-Bar Trend & Candle Forecast What This Indicator Does This indicator is a real-time market prediction engine designed to analyze price behavior and estimate future market tendencies . Unlike conventional indicators, this system does not rely on static parameters or historical curve-fitting , but adapts its internal state dynamically during live market operation. Instead of using static rules, the indic

AriX Indicator for MT5
A powerful trend-following and signal-evaluation tool AriX is a custom MT5 indicator that combines Moving Averages and ATR-based risk/reward logic to generate clear buy/sell signals. It visualizes dynamic SL/TP levels, evaluates past trade outcomes, and displays win/loss statistics in a clean on-chart panel. Key features include: Buy/Sell signals based on MA crossovers ATR-based SL/TP1/TP2/TP3 levels with visual lines and labels Signal outcome tracking with real-time stat
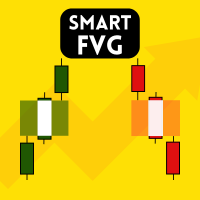
Smart FVG Indicator MT5 – MetaTrader 5에서 Fair Value Gap 및 Imbalance 감지 Smart FVG Indicator MT5 는 Fair Value Gap (FVG) 및 Imbalance 구역을 자동으로 감지하는 전문 도구입니다. Smart Money Concepts (SMC) 와 ICT 분석을 사용하는 트레이더를 위해 설계되었습니다. 이 지표는 가격 움직임을 스캔하여 유효한 FVG 및 Imbalance 구역을 찾고 차트에 실시간으로 표시합니다. 주요 기능 FVG 및 Imbalance 감지: 캔들 구조를 기반으로 가격 비효율성을 식별합니다. Imbalance 필터: 강한 가격 이동이나 유동성 변화를 감지합니다. Body Average 필터: 약한 구조를 제거하여 의미 있는 영역만 표시합니다. 동적 영역 관리: 가격이 채우거나 무효화하면 자동 업데이트됩니다続き: ```html 사용자 지정 시각화: 색상, 투명도 및 선 스타일을 조정할 수 있
FREE
FX Dynamic: 맞춤형 ATR 분석으로 변동성과 트렌드를 파악하세요 개요
FX Dynamic 는 Average True Range(ATR) 계산을 활용하여 트레이더에게 일간 및 일중 변동성에 대한 뛰어난 인사이트를 제공하는 강력한 도구입니다. 80%, 100%, 130%와 같은 명확한 변동성 임계값을 설정함으로써 시장이 평소 범위를 초과할 때 빠르게 경고를 받고, 유망한 수익 기회를 재빨리 식별할 수 있습니다. FX Dynamic 는 브로커의 시간대를 인식하거나 수동으로 조정할 수 있으며, 변동성 측정 기준을 일관되게 유지하며, MetaTrader 플랫폼과 완벽하게 연동되어 실시간 분석을 지원합니다.
1. FX Dynamic이 트레이더에게 매우 유용한 이유 실시간 ATR 인사이트
• 하루 및 일중 변동성을 한눈에 모니터링하세요. ATR의 80%, 100%, 130% 임계값이 도달 또는 초과되면, 시장의 중요한 지점에 있음을 알 수 있습니다.
• 변동성이 완전히 폭발하기
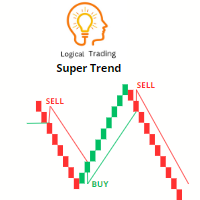
슈퍼 트렌드 지표는 트레이더들이 시장의 추세 방향과 잠재적인 진입 및 청산 지점을 파악하는 데에 사용되는 인기 있는 기술적 분석 도구입니다. 이는 가격 움직임과 변동성에 기반하여 신호를 제공하는 추세 추종형 지표입니다.
슈퍼 트렌드 지표는 두 개의 선으로 구성되어 있으며, 하나는 상승 추세를 나타내는 경우 (일반적으로 녹색으로 표시)이고 다른 하나는 하락 추세를 나타내는 경우 (일반적으로 빨간색으로 표시)입니다. 추세의 방향에 따라 선들은 가격 차트 위 또는 아래에 그려집니다.
슈퍼 트렌드 지표를 효과적으로 사용하기 위해서는 다음과 같은 절차를 따르세요:
1. 추세 방향 파악하기: 시장이 상승 추세인지 하락 추세인지를 판단하기 위해 슈퍼 트렌드 선을 찾아보세요. 녹색 선은 상승 추세를 나타내고, 빨간색 선은 하락 추세를 나타냅니다.
2. 진입 신호: 슈퍼 트렌드 선의 색상이 변경되는 경우, 추세가 반전될 가능성을 나타내는 진입 주문을 고려하세요. 예를 들어, 슈퍼 트렌드 선
FREE

The Area of Interest (AOI) Indicator is a powerful tool designed to help traders identify key market zones where price reactions are highly probable. This indicator specifically highlights two critical zones: Seller AOI (Area of Interest) : This zone represents areas where sellers are likely to enter the market, often acting as resistance. When the price approaches or touches this zone, it signals that a potential sell-off could occur. Buyer A OI (Area of Interest) : The BOI zone identifie
FREE

스마트 오토 트렌드라인 인디케이터는 MetaTrader 5 차트에 자동으로 지지선과 저항선 트렌드라인을 그려줍니다. 두 가지 방법을 사용하여 주요 가격 수준을 식별합니다: 두 극점(Two Extremes, Type 1) 또는 극점과 델타(Extreme and Delta, Type 2). 트렌드라인은 새로운 바가 형성될 때만 업데이트되어 최적의 성능을 보장합니다.
**기능** - **두 극점(Two Extremes, Type 1)**: 사용자가 정의한 바 범위 내에서 식별된 두 개의 극점(고점/저점)을 기반으로 트렌드라인을 그립니다. - **극점과 델타(Extremum and Delta, Type 2)**: 극점과 최소 델타 포인트를 결합하여 보다 동적인 트렌드라인을 제공합니다. - 선의 두께, 색상, 극점 측면 범위에 대한 사용자 정의 가능한 매개변수. - 지지선(핑크)과 저항선(파랑)으로 선이 그려지며, 선택 및 조정 가능한 속성을 제공합니다.
**더 알아보
FREE

Position Size Calculator PRO MT5 (v2.20) Position Size Calculator PRO 는 MetaTrader 5를 위한 전문적인 리스크 관리 도구입니다. 설정한 거래당 리스크, 손절매(Stop Loss) 거리, 그리고 심볼 사양(틱 가치, 틱 사이즈, 최소/최대/스텝 거래량, 증거금)을 기반으로 권장 롯(lot) 크기를 자동으로 계산해 줍니다. 비거래 운영: 이 지표는 주문을 직접 열거나 닫지 않으며 포지션을 관리하지 않습니다. 이는 자금 관리를 표준화하고 진입 전 크기 계산 실수를 줄이기 위한 의사 결정 지원 도구입니다. 차트 표시 항목 권장 롯 크기 (리스크 및 SL 거리에 따름) 진입가 / 손절매(SL) / 익절매(TP) 및 핍/포인트 거리 예상 리스크 (계좌 통화 및 %) 및 SL 도달 시 예상 손실 예상 수익 (TP 도달 시) + 손익비 (R:R Ratio) 필요 증거금 및 증거금 수준 (브로커 지원 시) 예상 손익분기점 (스프레드 포

ICT, SMC, SMART MONEY CONCEPTS, SMART MONEY, Smart Money Concept, Support and Resistance, Trend Analysis, Price Action, Market Structure, Order Blocks, BOS/CHoCH, Breaker Blocks , Momentum Shift, Supply&Demand Zone/Order Blocks , Strong Imbalance, HH/LL/HL/LH, Fair Value Gap, FVG, Premium & Discount Zones, Fibonacci Retracement, OTE, Buy Side Liquidity, Sell Side Liquidity, BSL/SSL Taken, Equal Highs & Lows, MTF Dashboard, Multiple Time Frame, BigBar, HTF OB, HTF Market Structure

Adaptive Volatility Range [AVR] - is a powerful tool for identifying key trend reversals. AVR - accurately displays the Average True Volatility Range taking into account the Volume Weighted Average price. The indicator allows you to adapt to absolutely any market volatility by calculating the average volatility over a certain period of time - this provides a stable indicator of positive transactions. Thanks to this , Adaptive Volatility Range has a high Winrate of 95% There are two ways t
** All Symbols x All Timeframes scan just by pressing scanner button ** After 18 years of experience in the markets and programming, Winner indicator is ready. I would like to share with you! *** Contact me to send you instruction and add you in "123 scanner group" for sharing or seeing experiences with other users. Introduction The 123 Pattern Scanner indicator with a special enhanced algorithm is a very repetitive common pattern finder with a high success rate . Interestingly, this Winner in

Market Structure Order Block Dashboard MT5 는 MetaTrader 5용 MT5 인디케이터 로, 시장 구조 및 ICT / Smart Money Concepts에 기반합니다: HH/HL/LH/LL , BOS , ChoCH 뿐 아니라 Order Blocks , Fair Value Gaps (FVG) , 유동성 (EQH/EQL, sweeps), 세션 / Kill Zones , 그리고 Volume Profile 을 통합하여 콤팩트한 컨플루언스 대시보드를 제공합니다. 중요: 본 제품은 분석 도구 입니다. 자동 매매를 실행하지 않습니다( EA가 아님 ). 구매자 보너스
구매 후 제 스토어에서 보너스 인디케이터 2개 를 (선택하여) 무료로 받을 수 있습니다. 보너스 수령 방법:
1) 본 제품에 대한 솔직한 리뷰를 남겨주세요.
2) MQL5 메시지로 BONUS MSOB + 선택한 인디케이터 2개 이름 을 보내주세요. 주요 기능 시장 구조: HH/HL/LH/LL

기본 캔들 패턴 인디케이터를 사용하면 주요 캔들 패턴을 그 어느 때보다 쉽게 식별할 수 있습니다. 해머, 이브닝 스타, 삼백수형 등 다양한 패턴을 차트에서 한 눈에 확인할 수 있습니다. 직관적인 인터페이스와 명확한 시각적 신호를 통해 빠르고 정확하게 거래 기회를 식별할 수 있습니다 / MT4 버전
이 보조지표용 대시보드 스캐너: ( Basic Candlestick Patterns Dashboard )
특징 정확성 : 주요 캔들 패턴을 자동으로 식별하여 수동 검색이 필요 없습니다. 사용자 지정 : 사용자 지정: 트레이딩 스타일에 맞게 트레이딩 선호도에 따라 매개변수를 조정할 수 있습니다.
하모닉 패턴 포함 상승 패턴 Hammer Inverse hammer Bullish engulfing Morning star 3 White soldiers 약세 패턴 Hanging man Shooting star Bearish engulfing Evening star 3 Black cro
FREE

골드 타겟은 최고의 추세 지표입니다. 지표의 고유한 알고리즘은 기술 및 수학적 분석 요소를 고려하여 자산 가격의 움직임을 분석하고 가장 수익성이 높은 진입점을 결정하며 화살표 및 가격 수준(BUY Entry / SELL Entry) 형태로 신호를 발행합니다. 주문을 엽니다. 표시기는 또한 손절매 가격 수준과 이익 실현을 위한 5가지 가격 수준을 즉시 표시합니다.
주의: 표시기는 사용이 매우 쉽습니다. 한 번의 클릭으로 차트에 표시기를 설치하고 신호 및 가격 수준에 따라 거래하세요. 차트에서는 지표가 설치된 시간대에 관계없이 4개의 시간대(M30 H1 H4 D1)에서 추세 상태가 표시됩니다.
지표의 장점:
1. 표시기는 높은 정확도의 신호를 생성합니다. 2. 표시 신호는 다시 그려지지 않습니다. 가격이 각 라인을 넘으면 소리 알림(알림 및 메시지)이 장착됩니다. 3. 모든 브로커의 MetaTrader 5 거래 플랫폼에서 거래할 수 있습니다. 4. 모든 자산(통화, 금속, 암

Was: $299 Now: $99 Supply Demand uses previous price action to identify potential imbalances between buyers and sellers. The key is to identify the better odds zones, not just the untouched ones. Blahtech Supply Demand indicator delivers functionality previously unavailable on any trading platform. This 4-in-1 indicator not only highlights the higher probability zones using a multi-criteria strength engine, but also combines it with multi-timeframe trend analysis, previously confirmed swings a

FX Volume: 브로커 시각에서 바라보는 진짜 시장 심리 간단 요약
트레이딩 접근 방식을 한층 더 향상시키고 싶으신가요? FX Volume 는 소매 트레이더와 브로커의 포지션을 실시간으로 파악할 수 있게 해 줍니다. 이는 COT 같은 지연된 보고서보다 훨씬 빠릅니다. 꾸준한 수익을 추구하는 분이든, 시장에서 더 깊은 우위를 원하시는 분이든, FX Volume 을 통해 대규모 불균형을 찾아내고, 돌파 여부를 확인하며 리스크 관리를 정교화할 수 있습니다. 지금 시작해 보세요! 실제 거래량 데이터가 의사결정을 어떻게 혁신할 수 있는지 직접 경험해 보시기 바랍니다.
1. 트레이더에게 FX Volume이 매우 유익한 이유 탁월한 정확도를 지닌 조기 경보 신호
• 다른 사람들보다 훨씬 앞서, 각 통화쌍을 매수·매도하는 트레이더 수를 거의 실시간으로 파악할 수 있습니다.
• FX Volume 은 여러 리테일 브로커에서 추출한 실제 거래량 데이터를 종합해 명확하고 편리한 형태로 제공하는

러시아어 설명서 / 영어 설명서 / MT4 버전 주요 기능: 판매자와 구매자의 활동 영역을 표시합니다! 이 지표는 매수 및 매도에 대한 모든 올바른 첫 번째 임펄스 레벨/존을 표시합니다. 진입점 검색이 시작되는 이러한 레벨/존이 활성화되면 레벨의 색상이 바뀌고 특정 색상으로 채워집니다. 상황을 더욱 직관적으로 파악할 수 있도록 화살표도 표시됩니다. LOGIC AI - 템플릿 활성화 시 진입점 검색을 위한 영역(원) 표시 시각적 명확성을 개선하기 위해 인공지능을 사용하여 진입점을 검색한 영역을 표시하는 기능이 추가되었습니다. 더 높은 시간대의 레벨/존 표시(MTF 모드) 더 높은 시간 간격을 사용하여 레벨/존을 표시하는 기능이 추가되었습니다. 또한, 이 지표는 자동 추세 감지 기능( TPSproTREND PRO )을 구현했습니다. 거래를 위한 별도의 전문적인 단계별 알고리즘 이 알고리즘은 추세 방향과 반대 방향으로의 당일 거래 모두에 적합하도록 설계되었습니다. 각
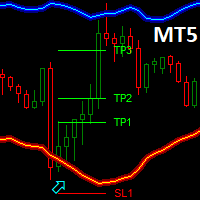
Dark Bands is an Indicator for intraday trading. This Indicator is based on Counter Trend strategy but use also Volatility. We can enter in good price with this Indicator, in order to follow the inversions on the current instrument.
Key benefits
Easily visible take profit/stop loss lines Reliable bands lines with futuristic colors, and Intuitive directional arrows Useful statistics , which indicate the win rate of the signals Plus Package available, leave a feedback to receive it for fr
FREE
UZFX {SSS} 스캘핑 스마트 시그널 MT5는 빠르게 움직이는 시장에서 정확한 실시간 신호를 요구하는 스캘퍼, 데이 트레이더, 스윙 트레이더를 위해 설계된 리페인팅 없는 고성능 트레이딩 지표입니다. (UZFX-LABS)에서 개발한 이 지표는 가격 행동 분석, 추세 확인, 스마트 필터링을 결합하여 모든 통화 쌍과 시간대에서 높은 확률의 매수 및 매도 신호를 생성합니다.
주요 기능 스마트 신호 감지 – 강력한 추세 반전 및 지속 패턴을 정밀하게 식별합니다. 다중 시간대 스캘핑 – 모든 시간대에서 완벽하게 작동합니다. 사용자 지정 알림 – 모든 신호에 대해 팝업, 이메일 및 모바일 알림을 받습니다(구성 가능). 명확한 시각적 화살표 – 차트에서 쉽게 식별할 수 있는 파란색(매수) 및 빨간색(매도) 화살표. 신호 강도 조정 – 단기, 중기, 장기 거래에 맞춰 신호 강도 조절 가능. 사용자 친화적 인터페이스 – 재그리기나 지연 없는 깔끔한 차트 표시.
작동 원리 UZFX SSS 지표는
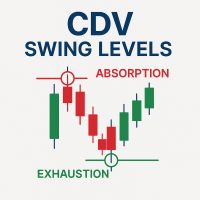
Cumulative Delta Volume (CDV) Swing Level - Absorption & Exhaustion Detector
Full Documentation: [ Download PDF ] CDV Swing Aggressive Score Guide : [ Download PDF ] Free Professional Education Course: After purchasing, contact me to receive access to the complete CDV Professional Training Video Course.
Professional CDV Analysis for Market Reversals This indicator identifies CDV absorption and exhaustion patterns to detect precise market turning points. It analyzes cumulative delta vo

Currency RSI Scalper MT5는 널리 사용되는 RSI(Relative Strength Index) 지표를 기반으로 하는 전문 지표입니다. RSI 지표는 시장의 간격에 대해 잘 작동하지만 시장 상황이 변할 때 수익성있는 신호를 생성하지 못하므로 큰 손실을 초래하는 잘못된 신호를 생성합니다. 시장 상황에 따라 적응하는 적응형 RSI 지표에 대해 생각해 본 적이 있습니까? 제시된 지표는 최고의 과매수 및 과매도 수준을 찾는 최적화 알고리즘을 구현합니다. 이를 통해 Currency RSI Scalper는 끊임없이 변화하는 시장에 적응할 수 있습니다. 매수 또는 매도 신호가 나타나면 차트에 화살표가 그려지고 경고가 발생하여 적시에 포지션을 열고 항상 PC에 앉아 있는 것을 피할 수 있습니다. Currency RSI Scalper는 통화(암호화폐 포함) 및 바이너리 옵션 거래에 적합합니다.
Currency RSI Scalper를 선택하는 이유 지표는 스캘핑 및 일중 거래에 적

이 정보 표시기는 계정의 현재 상황을 항상 알고 싶어하는 사람들에게 유용합니다.
VERSION MT 4 - More useful indicators 표시기는 포인트, 백분율, 통화 단위의 이익뿐만 아니라 현재 쌍의 스프레드와 현재 기간에서 막대가 마감될 때까지의 시간과 같은 데이터를 표시합니다. 차트에 정보선을 배치하는 데는 여러 가지 옵션이 있습니다. 가격 오른쪽(가격보다 뒤에 있음) 코멘트(차트의 왼쪽 상단) 화면의 선택된 모서리에 있습니다. 정보 구분 기호를 선택할 수도 있습니다. | /
\ # 이 표시기는 사용하기 쉽고 매우 유익합니다. 설정에서 불필요한 정보 항목을 비활성화할 수 있습니다. 설정 외모의 종류 - 정보 라인 표시 유형. 세 가지 옵션이 있습니다: 가격을 따르세요 - 가격을 따르세요. 댓글로 - 코멘트로; 화면의 선택된 모서리에서 - 화면의 선택한 모서리에 있습니다. 첨부용 그래프 코너 - 화면의 선택한
FREE

당신에게 소개하는 iVISTscalp5 지표는 독특하면서도 거래 작업에서 효과적입니다. 이 지표는 시간 데이터를 기반으로 하며 금융 시장의 많은 경험과 깊은 분석의 결과입니다. iVISTscalp5 지표는 수동 거래에 뛰어난 도구입니다. 편리성, 간단함 및 시각화 - 모든 복잡성은 숨겨져 있습니다. 우리는 iVISTscalp5 지표의 설정과 사용을 최대한 단순화했습니다. 이 지표는 MT5 터미널에서 가지고 있는 모든 금융 상품에 적합합니다. 시간 기준으로 작동하는 시간은 4am에서 8pm (UTC+3)입니다. iVISTscalp5 지표 메뉴 (스크린샷 1 참조): History - 표시할 주간 수 계산 dT_min - 시간 설정 간격 선택 (분) TFline - 수평 볼륨 생성 (타임프레임) BARSline - 수평 볼륨 생성 (바 수) TFtrend1 - 매일 채널 생성 (타임프레임) BARStrend1 - 매일 채널 생성 (바 수) TFtrend2 - 주간 채널 생성 (타임프레임

이 지표는 시장 반전 시점을 예측하는 가장 인기 있는 하모닉 패턴을 식별합니다. 이러한 하모닉 패턴은 외환 시장에서 지속적으로 반복되는 가격 형성이며 향후 가능한 가격 움직임을 제안합니다 / 무료 MT4 버전
또한 이 보조지표에는 시장 진입 신호와 다양한 이익실현 및 손절매 신호가 내장되어 있습니다. 하모닉 패턴 지표는 자체적으로 매수/매도 신호를 제공할 수 있지만 다른 기술 지표를 사용하여 이러한 신호를 확인하는 것이 좋습니다. 예를 들어, 매수/매도하기 전에 추세의 방향과 모멘텀의 강도를 확인하기 위해 RSI 또는 MACD와 같은 오실레이터를 사용하는 것을 고려할 수 있습니다.
이 인디케이터의 대시보드 스캐너: ( Basic Harmonic Patterns Dashboard )
포함된 하모닉 패턴 가틀리 버터플라이 박쥐 게 Shark Cypher ABCD
주요 입력 Max allowed deviation (%): 이 매개변수는 하모닉 패턴의 형성에 허용되는 허
FREE

Cumulative Volume Delta (CVD) MA-X: Intelligent Order Flow Sentiment Tool Unlock the hidden mechanics of the market with the Cumulative Volume Delta (CVD) MA-X . While standard volume indicators only tell you how much was traded, CVD MA-X tells you W ho is winning the battle between buyers and sellers When . By aggregating tick-level price action and volume distribution, this indicator provides a crystal-clear map of market conviction and exhaustion. The Trader’s Edge: Why CVD MA-X? Mo

Haven Volume Profile은 거래량 분포를 기반으로 중요한 가격 수준을 식별하는 데 도움이 되는 다기능 볼륨 프로파일 분석 지표입니다. 시장을 더 잘 이해하고 중요한 진입 및 퇴장 지점을 식별하려는 전문 트레이더를 위해 설계되었습니다. 기타 제품 -> 여기 주요 기능: Point of Control (POC) 계산 - 최대 거래 활동 수준으로, 가장 유동성이 높은 수준을 식별하는 데 도움이 됩니다 Value Area 정의 (높은 활동 영역) 및 사용자 지정 가능한 거래량 비율로 거래 범위를 보다 정확하게 평가할 수 있습니다 틱 거래량과 실제 거래량 모두 지원, 다양한 시장 유형과 거래 전략에 적합 계산 기간(일 수)의 유연한 설정으로 모든 시간 프레임에 도구를 적용할 수 있습니다 터미널의 밝은 테마와 어두운 테마에 자동 적응하여 사용자 인터페이스의 시각적 경험을 향상시킵니다 레벨 시각화가 명확하고 스타일과 색상을 사용자 지정할 수 있어 빠른 의사 결정을 돕습니다 이 지표
FREE

After your purchase, feel free to contact me for more details on how to receive a bonus indicator called VFI, which pairs perfectly with Easy Breakout for enhanced confluence!
Easy Breakout MT5 is a powerful price action trading system built on one of the most popular and widely trusted strategies among traders: the Breakout strategy ! This indicator delivers crystal-clear Buy and Sell signals based on breakouts from key support and resistance zones. Unlike typical breakout indicators

The main purpose of the indicator is to detect and mark on a chart the following trade signals described in "Trading Chaos (2-nd edition)": Bullish and bearish divergence bars with angulation (including squat). Bars in the red and in the green zones according to the color of the Awesome Oscillator histogram. Squat bars on the chart independent of the color of the Awesome Oscillator histogram. Levels of "important" fractals relative to the "Teeth line" of the Alligator indicator. Drawing angulati

Monster Harmonics Indicator is a harmonic pattern indicator. It recognizes Gartley, Bat, Crab, Butterfly, Cypher, White Swan, Black Swan, Shark and AB=CD patterns. Projected patterns that are not yet completed are recognized, too. Monster even shows the PRZ (Potential Reversal Zone). Users can add their own user defined patterns to Monster. Besides the current pattern, Monster also shows all patterns in the symbols history. Monster will provide alerts for developing patterns. Introduced by H.M.

Divergence indicator 10 different indicators. Finding and displaying classic and hidden divergences.
Indicators in which divergences are searched: MACD MACD Histogram; RSI; Stochastic; CCI; momentum; OBV; VWmacd; Chaikin Money Flow; Money Flow Index. This is a replica of the indicator from the tradingview resource, adapted for the MT5 terminal.
MT4 version available here: https://www.mql5.com/en/market/product/87846
Settings: Bars in history for analysis - number of bars for analysis; D
Orderflow Scalp Pro v2.4 delivers institutional-grade trading intelligence through advanced volume analysis, dynamic VWAP calculations, real-time aggressive score monitoring, and precision arrow signals. This complete trading system transforms complex market data into clear, actionable signals for consistent profitability on 3-4 minute timeframes.
Full Documentation: [Download PDF] Four Powerful Components in One System Volume Profile HeatMap with POC/VAH/VAL Transform your charts into inst

MACD 장중 추세는 1960년대 Gerald Appel이 만든 원본 MACD를 개조하여 개발한 지표입니다.
수년간의 거래를 통해 MACD의 매개변수를 피보나치 비율로 변경함으로써 추세 움직임의 연속성을 더 잘 표현함으로써 가격 추세의 시작과 끝을 보다 효율적으로 감지할 수 있다는 것이 관찰되었습니다.
가격 추세를 감지하는 효율성으로 인해 상단과 하단의 차이를 매우 명확하게 식별하여 거래 기회를 더 잘 활용할 수도 있습니다.
구성 가능한 기능과 경고가 있는 전문가용 버전을 사용해 보십시오: MACD Intraday Trend PRO
특징 모든 통화 쌍에서 작동 모든 시간대에 작동 Renko 차트와 함께 작동 여전히 질문이 있는 경우 다이렉트 메시지로 저에게 연락하십시오. https://www.mql5.com/ko/users/robsjunqueira/
FREE
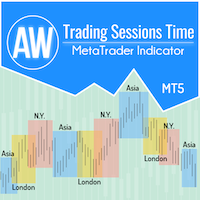
거래자가 시장 성과에 대한 데이터를 쉽게 얻고 거래 전략을 더 잘 수립할 수 있도록 거래 세션 지표를 개발했습니다. 다양한 거래소의 개장 시간은 시장 활동 및 거래량에 영향을 미치므로 거래에 영향을 미칩니다. 이러한 요소는 다양한 상품의 변동성과 거래 기회를 결정합니다. AW 거래 세션 표시기는 아시아, 런던 및 뉴욕 시장의 거래 시간을 표시합니다. 거래자는 더 나은 경험을 위해 다양한 시간대를 표시하거나 숨길 수 있습니다. 차트에서는 세션 종료까지의 시간과 거래 세션 규모를 확인할 수 있습니다. 차트의 데이터 표시에는 다양한 스타일의 거래 차트에 적합한 유연한 그래픽 조정 기능이 있습니다.
더 많은 제품 -> 여기
장점:
아시아, 런던, 뉴욕 거래 세션을 표시합니다. 필요한 경우 세션 크기를 숫자로 표시하고, 켜져 있으면 거래 세션이 끝날 때까지의 시간을 표시합니다. 거래 세션을 개별적으로 비활성화할 수 있습니다. 차트의 사용자 정의 가능한 세션 테두리 스타일 필요한 경우
FREE

Simple QM Pattern is a powerful and intuitive trading indicator designed to simplify the identification of the Quasimodo (QM) trading pattern. The QM pattern is widely recognized among traders for effectively signaling potential reversals by highlighting key market structures and price action formations. This indicator helps traders easily visualize the QM pattern directly on their charts, making it straightforward even for those who are new to pattern trading. Simple QM Pattern includes d
FREE

트렌드 라인 맵 표시기는 트렌드 스크리너 표시기의 애드온입니다. Trend screener(Trend Line Signals)에 의해 생성된 모든 신호에 대한 스캐너로 작동합니다.
Trend Screener Indicator 기반의 Trend Line Scanner입니다. Trend Screener Pro 표시기가 없으면 Trend Line Map Pro가 작동하지 않습니다.
It's a Trend Line Scanner based on Trend Screener Indicator. If you don't have Trend Screener Pro Indicator, the Trend Line Map Pro will not work .
MQL5 블로그에 액세스하여 추세선 지도 표시기의 무료 버전을 다운로드할 수 있습니다. Metatrader Tester 제한 없이 구매하기 전에 사용해 보십시오. : 여기를 클릭하세요
1. 쉽게 얻을 수 있는 이점 통화 및 시간 프레

The Market Sessions indicator is a popular tool among forex and stock traders for visually representing global trading sessions on a price chart. It highlights the time periods for major trading sessions — such as the Asian (Tokyo) , European (London) , and American (New York) sessions — directly on the chart. This helps traders identify when markets open and close, allowing for better decision-making based on session-specific trading behavior. - Asian Session (Default: 00:00-09:00) - London Se
FREE
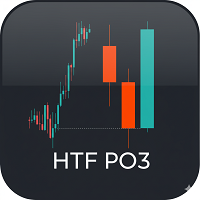
제품명: HTF PO3 - 상위 시간봉 표시 인디케이터 설명
HTF PO3는 MetaTrader 5용 강력한 시각화 도구입니다. 주요 기능은 상위 시간대(HTF)의 캔들을 메인 차트의 오른쪽에 직접 표시하여, 차트를 전환하지 않고도 멀티 타임프레임 분석을 가능하게 합니다. 이를 통해 낮은 시간봉의 움직임을 보면서 시장의 큰 구조를 명확히 파악할 수 있습니다. 일간 또는 4시간 봉의 시가와 같은 HTF 가격 레벨을 참고하는 트레이더에게 이상적입니다. 주요 기능 HTF 오버레이: 지정한 개수의 HTF 캔들(H1, H4, D1 등)을 차트 오른쪽에 표시. 현재 시가선: 현재 형성 중인 HTF 캔들의 시가에 자동으로 사용자 정의 가능한 수평선을 표시. 뉴욕 시간 조정: 각 HTF 캔들의 시작 시간을 HH:MM 형식으로 표시하고, 시간대 오프셋 설정 가능. 완전한 사용자 정의: 상승/하락 캔들 색상, 몸통 너비, 간격, 시가선 스타일, 글꼴 크기, 시간 텍스트 위치 등 조정 가능. 사용 방
FREE

Introduction to X3 Chart Pattern Scanner X3 Cherart Pattern Scanner is the non-repainting and non-lagging indicator detecting X3 chart patterns including Harmonic pattern, Elliott Wave pattern, X3 patterns, and Japanese Candlestick patterns. Historical patterns match with signal patterns. Hence, you can readily develop the solid trading strategy in your chart. More importantly, this superb pattern scanner can detect the optimal pattern of its kind. In addition, you can switch on and off individu
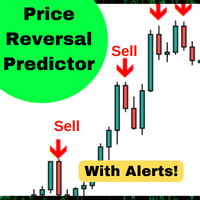
이 알고리즘은 90%*정확도로 가격의 단기 변화를 예측합니다. 가격이 신호 촛불보다 높거나 낮은 경우 예측한다. 더 큰 시간 프레임에 평균 복귀 거래,바이너리 옵션 또는 선물 계약에 적합합니다. 이 지표는 5 년간의 데이터에 대해 백 테스트되었으며 시간 경과에 따른 가격 반전을 예측하는 데 90%의 정확도가 있습니다.
특징::
간단한 설정 모든 차트로 드래그 앤 드롭 경고 사용(선택 사항) 그리고 당신은 완료! 시각 및 오디오 경고 휴대 전화로 직접 전송 경고 터미널로 전송 된 팝업 알림 높은 승률 거래의 90%까지 승리 백 테스트 5 년 여러 통화. (백 테스트 세부 정보 및 분석은 웹 사이트를 참조하십시오). 많은 수의 신호 활성 모드에서 심볼 당 하루에 3~6 개의 신호를 기대합니다 기대 1 에 2 수동 모드에서 기호 당 하루 신호. 당신이 표시가있는 경우*이입니다 30 분 촛불. 유연한 외환,지수,상품 및 주식에서 작동합니다. 어떤 시간 프레임에서 작동 매일 바 5 분에
FREE

Reversal Sniper Pro 리페인팅 없는 신호를 갖춘 전문가급 다중 컨플루언스 극단 반전 감지 시스템 Reversal Sniper Pro는 여섯 가지 다른 기술적 방법을 동시에 분석하여 높은 확률의 반전 포인트를 식별하는 정교한 기술 지표입니다. 단일 지표 접근 방식과 달리 이 도구는 신호를 생성하기 전에 여러 기술적 확인을 요구하여 잘못된 경고를 크게 줄이고 가장 강력한 설정에 집중할 수 있도록 도와줍니다. 이 지표는 Z-Score 분석, 볼린저 밴드 포지셔닝, RSI 모멘텀, 스토캐스틱 오실레이터, CCI 사이클 감지, ATR 스파이크 분석을 통합된 컨플루언스 시스템으로 결합합니다. 각 신호는 여러 기술적 확인으로 뒷받침되어 거래 결정에 자신감을 줍니다. 리페인팅 없는 확인된 신호와 조기 잠재적 경고, 그리고 자동 이익실현 구역 감지를 통해 Reversal Sniper Pro는 완전한 반전 거래 솔루션을 제공합니다. 전문가급 차트 상 대시보드는 실시간 컨플루언스 강도,
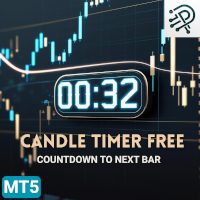
Candle Timer Countdown to Next Bar is a MetaTrader 5 indicator that displays the remaining time until the current candle closes directly on the chart. The indicator shows a real-time countdown for the active bar. During the final 10 seconds before the candle closes, the timer changes color and blinks to indicate an upcoming bar close. Functionality
Displays remaining time until the current bar closes Updates automatically in real time Visual blinking alert during the last 10 seconds of the candl
FREE

"Haven Candle Timer Countdown" 지표는 다양한 시간 프레임의 시간 범위를 관리하는 간단하고 유용한 도구입니다. 현재 서버 시간과 선택한 세 개의 시간 프레임에서 동시에 촛대가 끝날 때까지의 카운트다운을 표시합니다. 이 도구는 여러 시간 프레임에서 현재 촛대가 끝날 때까지 남은 시간을 정확히 알아야 하는 트레이더에게 특히 유용하며, 적시에 결정을 내릴 수 있게 도와줍니다. 이 지표를 사용하면 분석 속도가 크게 빨라지고 시간에 대한 정보 부족으로 인한 오류를 피할 수 있습니다. 다른 제품들 -> 여기 주요 기능: 시간과 색상 표시 설정을 유연하게 조정 가능 1분에서 1개월까지의 시간 프레임 지원 차트에서 편리한 배치 현재 및 다음 기간에 대한 정보에 빠르게 접근 가능 거래 결정을 내릴 때 정확히 시간 간격을 제어해야 하는 트레이더에게 적합합니다. 이 지표는 촛대 종료 시간에 대한 불확실성과 관련된 리스크를 최소화하고 효과적으로 행동 계획을 세울 수 있도록 도와줍
FREE

기본 공급 수요 지표는 시장 분석을 향상시키고 모든 차트에서 주요 기회 영역을 식별하는 데 도움이 되도록 설계된 강력한 도구입니다. 직관적이고 사용하기 쉬운 인터페이스를 갖춘 이 무료 메타트레이더 지표는 공급 및 수요 영역을 명확하게 볼 수 있어 보다 정보에 입각한 정확한 거래 결정을 내릴 수 있습니다 / 무료 MT4 버전 이 지표에 대한 대시보드 스캐너: ( Basic Supply Demand Dashboard )
특징
지표는 차트에서 공급 및 수요 영역을 자동으로 스캔하여 지루한 수동 분석이 필요하지 않습니다. 가장 가까운 공급 및 수요 구역까지의 남은 거리 그래픽 표시 공급 구역은 하나의 고유 한 색상으로 강조 표시되고 수요 구역은 다른 색상으로 표시되어 빠르고 정확한 해석이 용이합니다. 인디케이터는 가장 가까운 공급 또는 수요 구간과 차트상의 현재 가격 사이의 핍 단위 거리를 자동으로 계산하여 명확하고 정량화할 수 있는 기준을 제공합니다. 핍 단위의 거리가 차트에 명확하
FREE
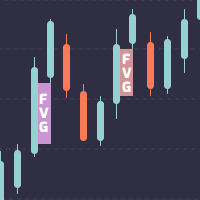
MetaTrader 4에 대한 공정 가치 갭 지표.
공정 가치 격차는 유명한 스마트 머니 트레이더인 내부 서클 트레이더인 ICT가 가르친 3개 캔들 가격 행동 패턴입니다. 기본적으로 가격이 너무 빨리 움직일 때 차트에 열려 있는 갭입니다. 왼쪽 캔들과 그 옆의 오른쪽 캔들에 틱이 겹치지 않는 중간 캔들의 몸체 부분입니다. 가격이 차트에 공백을 남기면 두 가지를 염두에 둘 수 있습니다. 첫째, 가격은 그 방향으로 갈 수 있는 매우 강력한 모멘텀을 가지고 있고, 둘째, 가격은 일반적으로 그 방향으로 가기 전에 갭을 메우기 위해 되돌립니다.
공정 가치 갭은 가격 행동 거래자 사이에서 가장 일반적으로 사용되며 가격 전달에 비효율 또는 불균형이 있는 경우로 정의됩니다. 이 비효율성은 이전에 채워지지 않은 많은 대기 주문이 있기 때문에 이 가격 불균형을 재조정하기 위해 미래의 가격에 대한 자석이 될 수 있습니다. 거래자는 이 정보를 사용하여 공정 가치 갭을 목표로 하거나 좋은 POI가 되

MetaForecast는 가격 데이터의 조화를 기반으로 모든 시장의 미래를 예측하고 시각화합니다. 시장이 항상 예측 가능한 것은 아니지만 가격에 패턴이 있다면 MetaForecast는 가능한 정확하게 미래를 예측할 수 있습니다. 다른 유사한 제품과 비교했을 때, MetaForecast는 시장 동향을 분석하여 더 정확한 결과를 생성할 수 있습니다.
입력 매개변수 Past size (과거 크기) MetaForecast가 미래 예측을 생성하기 위한 모델을 만드는 데 사용하는 막대의 수를 지정합니다. 모델은 선택한 막대 위에 그려진 노란색 선으로 표시됩니다. Future size (미래 크기) 예측해야 할 미래 막대의 수를 지정합니다. 예측된 미래는 핑크색 선으로 표시되며 그 위에 파란색 회귀선이 그려집니다. Degree (차수) 이 입력은 MetaForecast가 시장에서 수행할 분석 수준을 결정합니다. Degree 설명 0 차수 0의 경우, "Past size" 입력에 모든 봉우리와

Visit our all-new Stein Investments Welcome Page to get the latest information, updates and trading strategies. Do you want to become a constantly profitable 5-star forex trader? Then get our Stein Investments trading tools and send us a screenshot to get your personal invitation to our exclusive trading chat with 500+ members.
FX Trend displays the trend direction, duration, intensity and the resulting trend rating for all time frames in real time.
You'll see at a glance at which direct

As it name implies, this is an exaustion oscillator. However, you may wonder: what differs you from others oscillators like RSI, Stochastic, CCI etc? The difference is that ours is more powerful and accurate ! Your oscillator filters the nois e made by other oscillators, and shows you only the exact moment to enter the trade. Of course, using it alone, like any other indicator, has its risks. Ideally, reconcile it with technical analysis and/or others indicators. If you have any doubt or suggest

Meravith Auto는 Meravith 거래 시스템의 자동화 버전입니다. 이 지표는 색상이 변하는 추세선으로 구성되어 있습니다. 상승 추세일 때는 녹색, 하락 추세일 때는 빨간색입니다. 이것이 추세 지지선입니다. 상승 거래량과 하락 거래량이 같은 유동성 라인. 세 배 상승 편차 라인. 세 배 하락 편차 라인. 높은 거래량을 나타내는 보라색 및 파란색 점. 보라색 점은 평균 거래량보다 2편차 큰 거래량을 나타내며, 파란색 점은 2편차를 나타냅니다. 사용 방법은? 상승 추세선과 추세선 위의 유동성은 상승 추세를 나타냅니다. 시장이 상승할 것으로 예상됩니다. 롱 포지션을 엽니다. 하락 추세선과 추세선 아래의 유동성은 하락 추세를 나타냅니다. 시장이 하락할 것으로 예상됩니다. 숏 포지션을 엽니다. 다른 지표와 자유롭게 조합하여 사용할 수 있습니다.
모든 통화쌍과 모든 시간대에서 사용할 수 있습니다.
브로커마다 표시하는 거래량이 다르기 때문에 결과가 다를 수 있습니다.
거래량이 많은 대형

안녕하세요, 여러분.
단일 지표와 세 가지 다른 지표 화면에서 동시에 여러 데이터 포인트를 표시할 수 있는 “All in One Screen” 기능을 무료로 사용하는 방법을 설명해 드리겠습니다.
먼저, 이 지표는 어떤 것들을 사용할 수 있나요? ; 피보나치 수준 FVG 및 OrderBlock 수준 이치모쿠 지표 봉, 볼린저 밴드 돈치안 채널 리테스트 구역 지지 및 저항 구역 스토캐스틱 그리고 마지막으로 ATR 지표들.
1. 제어판 화면에는 무엇이 있나요? ;
피보나치 값, HH 및 LL 값을 얻기 위해 최근 100개의 캔들에서 가져온 실시간 가격 데이터.
최근 100개의 캔들을 분석하여 얻은 피보나치 수준.
오더블록 및 FVG 값 (사용자에게 차트 상에 수평 직사각형으로 표시됨).
2. 제어판 화면에는 무엇이 있나요? ;
ATR 지표 데이터. 스토캐스틱 지표 데이터. 이치모쿠 지표 데이터. 돈체인 지표 데이터. 볼린저 밴드 지표 데
FREE

" Dynamic Scalper System MT5 " 지표는 추세 파동 내에서 스캘핑 방식으로 거래하도록 설계되었습니다.
주요 통화쌍 및 금에서 테스트되었으며, 다른 거래 상품과의 호환성이 가능합니다.
추가적인 가격 변동 지원을 통해 추세에 따라 단기 포지션 진입 신호를 제공합니다.
지표의 원리
큰 화살표는 추세 방향을 결정합니다.
작은 화살표 형태의 스캘핑 신호를 생성하는 알고리즘은 추세 파동 내에서 작동합니다.
빨간색 화살표는 상승 방향을, 파란색 화살표는 하락 방향을 나타냅니다.
민감한 가격 변동선은 추세 방향으로 그려지며, 작은 화살표의 신호와 함께 작용합니다.
신호는 다음과 같이 작동합니다. 적절한 시점에 선이 나타나면 진입 신호가 형성되고, 선이 있는 동안 미결제 포지션을 유지하며, 완료되면 거래를 종료합니다.
권장되는 작업 시간대는 M1~H4입니다.
화살표는 현재 캔들에 형성되며, 다음 캔들이 이미 시작되었더라도 이전 캔들의 화살표는 다시 그려지지 않습니다.
입

물론입니다. 아래는 제공해주신 텍스트의 한국어 번역입니다: MT4용 천문학 지표 소개: 귀하의 최상급 하늘 트레이딩 동반자 트레이딩 경험을 천체의 높이로 끌어올리기 준비가 되셨나요? MT4용 천문학 지표를 소개합니다. 이 혁신적인 도구는 복잡한 알고리즘의 힘을 활용하여 탁월한 천문학적 통찰과 정밀한 계산을 제공합니다. 정보의 우주를 손에 담다: 천문학적 데이터의 보물함을 드러내는 포괄적인 패널을 살펴보세요. 행성의 지오/헬리오센트릭 좌표, 태양/지구 거리, 크기, 길이, 별자리, 황도 좌표 및 적도 좌표, 심지어 수평 좌표 등 각각이 정밀하게 계산되고 아름답게 제시됩니다. 지표에 의해 생성된 수직선은 시간 값에 해당하여 트레이딩 여정에 우주적인 시각을 부여합니다. 행성 라인과 관계: 수정 가능한 스케일과 각도로 차트를 장식하는 행성 라인의 마법을 경험해보세요. 직관적인 컨트롤 패널을 통해 각 행성의 라인의 가시성을 손쉽게 전환할 수 있습니다. 쥰션이나 섹스타일, 사분각, 삼분

시장 매물대 지표(Volume Profile) + 스마트 오실레이터. 통화 쌍, 주식, 선물, 암호화폐 등 거의 모든 종목에서 작동하며, 실제 거래량(Real Volume)과 틱 거래량(Tick Volume)을 모두 지원합니다. 프로파일 생성 범위를 일주일이나 한 달 등으로 자동 설정할 수 있을 뿐만 아니라, 두 개의 수직선(빨간색과 파란색)을 이동하여 수동으로 범위를 설정할 수도 있습니다. 히스트그램 형태로 표시되며, 특정 가격 수준의 히스토그램 너비는 해당 가격대에서 발생한 거래량을 의미합니다. Mode level line color 파라미터를 사용하면 가격이 반등할 가능성이 높은 주요 매물대 수준을 자동으로 표시할 수 있으며, Maximum color 파라미터는 설정된 전체 범위에서 거래가장 많이 발생한 최대 거래량 수준을 별도로 보여줍니다. 스마트 오실레이터는 과매수 및 과매도 구간을 표시합니다. 여러 지표로부터 오는 정보를 분석하고, 처리된 데이터를 바탕으로 과매수 및 과매

Golden Spikes Indicator Technical indicator for synthetic indices trading on M1 timeframe. Compatible with Boom/Crash indices on Deriv platform and Gain/Pain indices on Weltrade platform. send me A private message to receive trade ASISTANT EA.. booklet guide: https://drive.google.com/file/d/1knQJqGHZSP5eQN24ndRz2ayZVCst6XhN/view?usp=sharing
Also check my premium spikes bot: https://www.mql5.com/en/market/product/142350 Features Uses Parabolic SAR, RSI, and Bollinger Bands analysis Three risk
Special offer : ALL TOOLS , just $35 each! New tools will be $30 for the first week or the first 3 purchases ! Trading Tools Channel on MQL5 : Join my MQL5 channel to update the latest news from me SuperTrend ATR Multiplier with Scanner for MT5 를 소개합니다 – 시장 트렌드를 앞서기 위해 설계된 다기능 강력한 도구로, 사용자 맞춤형 기능과 실시간 알림을 제공합니다. Kivanc Ozbilgic 의 신뢰할 수 있는 SuperTrend 로직을 기반으로 한 이 지표는 정확한 트렌드 신호를 제공합니다. ATR 계산 방법을 RMA (상대 이동 평균)와 SMA (단순 이동 평균) 중에서 선택하여 최대한의 유연성을 제공할 수 있습니다. 기본 설정으로 ATR 기간은 10, 배수는 3
FREE

이 알고리즘은 86%*정확도로 단기간의 가격 변화를 예측합니다. 과매수 또는 과매도 상태인 경우,이 표시기가 사용자에게 알립니다. 가격이 신호 촛불보다 높거나 낮은 경우 예측한다. 더 큰 시간 프레임에 평균 복귀 거래,바이너리 옵션 또는 선물 계약에 적합합니다. 이 지표는 5 년간의 데이터에 대해 백 테스트되었으며 시간 경과에 따른 가격 반전을 예측하는 데 90%의 정확도가 있습니다.
특징::
간단한 설정 모든 차트로 드래그 앤 드롭 원하는대로 매개 변수 조정(선택 사항) 경고 사용(선택 사항) 그리고 당신은 완료! 시각 및 오디오 경고 휴대 전화로 직접 전송 경고 터미널로 전송 된 팝업 알림 높은 승률 거래의 90%까지 승리 백 테스트 5 년 여러 통화. (백 테스트 세부 정보 및 분석은 웹 사이트를 참조하십시오). 많은 수의 신호 기대 1 에 2 기호 당 하루 신호*. 당신이 표시가있는 경우*이입니다 30 분 촛불. 유연한 외환,지수,상품 및 주식에서 작동합니다. 어떤 시간
FREE

SMC 세션 지표는 ICT 개념, 유동성 사냥 및 세션 기반 전략 에 의존하는 스마트 머니 트레이더를 위해 제작된 정밀 도구입니다.기관 수준 트레이더가 사용하는 가장 입증되고 인기 있는 개념을 사용하여 중요한 세션 기반 거래 구역을 원활하게 매핑합니다.이 올인원 세션 지표는 다음을 포함하여 가장 효과적이고 확률이 높은 범위 전략으로 차트를 오버레이합니다.ICT 아시아 범위, 런던 브레이크아웃, 뉴욕 범위, ICT 런던 오픈 킬존, ICT 뉴욕 오픈 킬존, 오프닝 범위 브레이크아웃(ORB) ( 런던, 뉴욕, 도쿄 포함) 및 강력한 자정 오프닝 범위 .또한 시드니, 도쿄, 런던 및 뉴욕 을 포함한 주요 외환 거래 세션을 강조 표시합니다.각 범위는 TimeBox 방법론을 사용하여 최대 정확도로 그려져 주요 FVG(공정 가치 갭), 범위 스윕, 세션 최고/최저 및 잠재적인 마켓 메이커 조작 구역을 식별하는

This is the best Support and Resistance Indicator on the market, and it shows both confirmed Support and Resistance as well as Retests. Support & Resistance: Support marks where buying demand halts price declines, acting as a safety net. Resistance caps price surges, driven by selling pressure. Traders leverage these levels to predict reversals, plan entries, exits, and manage risks, making them trading's fundamental guideposts. Join To Learn Market Depth - https://www.mql5.com/en/channels/su
FREE
MetaTrader 마켓은 과거 데이터를 이용한 테스트 및 최적화를 위해 무료 데모 거래 로봇을 다운로드할 수 있는 유일한 스토어입니다.
어플리케이션의 개요와 다른 고객의 리뷰를 읽어보시고 터미널에 바로 다운로드하신 다음 구매 전 트레이딩 로봇을 테스트해보시기 바랍니다. 오직 MetaTrader 마켓에서만 무료로 애플리케이션을 테스트할 수 있습니다.
트레이딩 기회를 놓치고 있어요:
- 무료 트레이딩 앱
- 복사용 8,000 이상의 시그널
- 금융 시장 개척을 위한 경제 뉴스
등록
로그인
계정이 없으시면, 가입하십시오
MQL5.com 웹사이트에 로그인을 하기 위해 쿠키를 허용하십시오.
브라우저에서 필요한 설정을 활성화하시지 않으면, 로그인할 수 없습니다.