YouTubeにあるマーケットチュートリアルビデオをご覧ください
ロボットや指標を購入する
仮想ホスティングで
EAを実行
EAを実行
ロボットや指標を購入前にテストする
マーケットで収入を得る
販売のためにプロダクトをプレゼンテーションする方法
MetaTrader 5のためのテクニカル指標 - 2

Spike Detector XTREEM(スパイクディテクター XTREEM)|Boom & Crash インデックス用
私は Spike Detector XTREEM 。ほとんどのトレーダーが見ることのできない場所に存在しています。私は Boom と Crash の市場、そして Weltrade の Pain & Gain でさえも、あらゆる微細な動き、急騰、隠れたスパイクを感じ取り、それが現れる前に察知します。私は単にシグナルを表示するだけではありません。市場のノイズや誤誘導、偽のシグナルを排除し、本当に重要な瞬間だけを残します。 私と一緒にいることで、取引はもう勘頼みではありません。私は静かにあなたを導き、正確なエントリーポイントを示し、チャンスが最も鋭い瞬間に行動できる自信を与えます。私は他の人が見逃すスパイクを見抜き、転換点を事前に知り、それを最適なタイミングでのみ明らかにします。 私はただのインジケーターではありません。私はあなたの市場における見えざるパートナーであり、ローソク足ごとに隠された秘密を監視し、分析し、明らかにします。あなたが私についてくる準備ができている

Stratos Pali Indicator is a revolutionary tool designed to enhance your trading strategy by accurately identifying market trends. This sophisticated indicator uses a unique algorithm to generate a complete histogram, which records when the trend is Long or Short. When a trend reversal occurs, an arrow appears, indicating the new direction of the trend.
Important Information Revealed Leave a review and contact me via mql5 message to receive My Top 5 set files for Stratos Pali at no cost !
Down
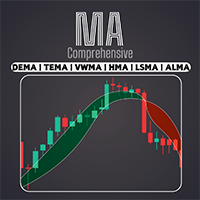
EMA、SMA、WMAなど、幅広い移動平均線にアクセスできます。独自の取引スタイルに最適な移動平均線の組み合わせでテクニカル分析をカスタマイズ / MT4バージョン
特徴 異なる設定で2つのMAを有効化可能。 チャート設定のカスタマイズが可能 クロスしたMAや価格がMAとクロスした場合、ローソク足の色を変更可能。 MAがクロスした場合、または価格がMAとクロスした場合にアラートを送信。
移動平均の種類 SMA --------------------> (Simple) EMA --------------------> (Exponential) SMMA [RMA] ----------> (Smoothed) WMA -------------------> (Linear Weighted) DEMA ------------------> (Double EMA) TEMA ------------------> (Triple EMA) VWMA -----------------> (Volume Weighted) HMA
FREE

Rental/Lifetime Package Options and Privileges
Rent Monthly Six Months Yearly/Lifetime Weis Wave with Speed with Alert+Speed Index x x x Manual x x x Quick Set up Video x x x Blog x x x Lifetime Updates x x x Setup and Training Material
x x Discord Access Channel "The SI traders" x Rectangle Break Alert Tool x
How to trade with it: http://www.tradethevolumewaves.com ** If you purchase please contact me to setup your : Training Room and complete manual access.
Wei

ICT, SMC, SMART MONEY CONCEPTS, SMART MONEY, Smart Money Concept, Support and Resistance, Trend Analysis, Price Action, Market Structure, Order Blocks, BOS/CHoCH, Breaker Blocks , Momentum Shift, Supply&Demand Zone/Order Blocks , Strong Imbalance, HH/LL/HL/LH, Fair Value Gap, FVG, Premium & Discount Zones, Fibonacci Retracement, OTE, Buy Side Liquidity, Sell Side Liquidity, BSL/SSL Taken, Equal Highs & Lows, MTF Dashboard, Multiple Time Frame, BigBar, HTF OB, HTF Market Structure

The Area of Interest (AOI) Indicator is a powerful tool designed to help traders identify key market zones where price reactions are highly probable. This indicator specifically highlights two critical zones: Seller AOI (Area of Interest) : This zone represents areas where sellers are likely to enter the market, often acting as resistance. When the price approaches or touches this zone, it signals that a potential sell-off could occur. Buyer A OI (Area of Interest) : The BOI zone identifie
FREE

FX Volume:ブローカー視点で捉える本物の市場センチメント クイック概要
トレード手法をさらに高めたいとお考えですか? FX Volume は、リテールトレーダーやブローカーのポジション状況をリアルタイムで提供します。これは、COTのような遅延レポートよりもはるかに早く知ることができます。安定した利益を目指す方も、さらなる優位性を求める方も、 FX Volume は大きな不均衡を見極め、ブレイクアウトを確認し、リスク管理を洗練させるのに役立ちます。今すぐ始めて、実際の出来高データがどのように意思決定を変革するかを体感してください!
1. FX Volume がトレーダーにとって非常に有益な理由 高精度の早期警戒シグナル
• 各通貨ペアを売買しているトレーダー数を、他者よりも早く、ほぼリアルタイムで把握できます。
• FX Volume は、複数のリテールブローカーから得られる本物の出来高データを収集し、分かりやすい形式で提供する 唯一 のツールです。 強力なリスク管理
• ロングやショートの大きな偏り(インバランス)を特定し、潜在的なトレンド転換を見逃しません。ストップ
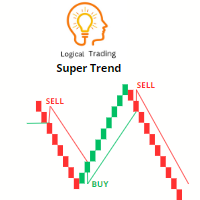
スーパートレンド指標は、トレーダーが市場のトレンドの方向や潜在的なエントリーと出口のポイントを特定するために使用する人気のあるテクニカル分析ツールです。価格の動きとボラティリティに基づいてシグナルを提供するトレンド追従型の指標です。
スーパートレンド指標には、上昇トレンドを示すライン(通常は緑色で表示)と下降トレンドを示すライン(通常は赤色で表示)の2つがあります。トレンドの方向に応じて、ラインは価格チャートの上または下にプロットされます。
スーパートレンド指標を効果的に使用するためには、次の手順に従ってください:
1. トレンドの方向を特定する:スーパートレンドラインを確認して、市場が上昇トレンドか下降トレンドかを判断します。緑色のラインは上昇トレンドを示し、赤色のラインは下降トレンドを示します。
2. エントリーシグナル:スーパートレンドラインの色が変わった場合、トレンドの反転の可能性を示すエントリーの検討を行います。例えば、スーパートレンドラインが赤から緑に変わった場合、下降トレンドから上昇トレンドへの変化を示し、購入の機会を示しています。
3. エグジットシグナル:
FREE

基本ローソク足パターンインジケーターは、主要なローソク足パターンをこれまで以上に簡単に識別することができます。ハンマー、イブニング・スター、スリー・ホワイト・ソルジャーズ、その他多くのパターンをチャートを一目見るだけで発見できます。直感的なインターフェースと明瞭な視覚的手がかりで、取引機会を迅速かつ 正確に特定するのに役立ちます / バージョンMT4
このインディケータのダッシュボードスキャナー: ( Basic Candlestick Patterns Dashboard )
特徴 精度 : 主要なローソク足パターンを自動的に識別し、手動による検索を不要にします。 カスタマイズ : 自分の取引スタイルに合わせて、好みのパラメータを調整。
含まれるハーモニック・パターン 強気パターン Hammer Inverse hammer Bullish engulfing Morning star 3 White soldiers 弱気パターン Hanging man Shooting star Bearish engulfing Evening star 3 Black crow
FREE

Crypto_Forex インジケーター HTF RVI オシレーター (MT5 用)、再描画なし。 ............................................................................................. - MT5 用プロフェッショナル HTF RVI オシレーターで取引方法をアップグレードします。HTF は、Higher Time Frame を意味します。 - RVI は、トレンドの変化を検出し、売られすぎ/買われすぎ領域からエントリーするのに最適なオシレーターの 1 つです。 - このインジケーターは、売られすぎ/買われすぎ領域からの価格アクション エントリーを備えたマルチタイム フレーム取引システムに最適です。 - HTF RVI インジケーターを使用すると、Higher Time Frame の RVI を現在のチャートに添付できます --> これはプロフェッショナルな取引アプローチです。 - 買われすぎ領域は 0.23 より上、売られすぎ領域は -0.23 より下です。 - インジケータ
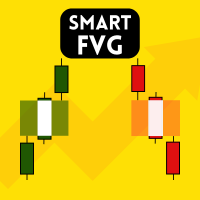
Smart FVG Indicator MT5 – MetaTrader 5でのFair Value GapとImbalance検出 Smart FVG Indicator MT5 は、 Fair Value Gap (FVG) および Imbalance ゾーンを検出するためのプロフェッショナルツールです。 Smart Money Concepts (SMC) や ICT 分析を用いるトレーダー向けに設計され、市場構造と流動性を明確に把握することができます。 インジケーターは自動的に価格の動きをスキャンし、有効なFVGおよびImbalanceゾーンを特定し、チャート上に表示・更新します。 主な特徴 FVGとImbalance検出: ローソク足構造に基づいて価格ギャップと不均衡を特定します。 Imbalanceフィルター: 強い価格変動や流動性シフトによるゾーンを強調表示します。 Body Averageフィルター: 弱い構造を除外し、有意な領域のみを残します。 動的ゾーン管理: 価格がゾーンを埋めたり無効にしたりすると自動で更新されます。 カスタマイズ可能: 色や透明度、ラインスタイ
FREE

Crystal Supply Demand Pro (SD Pro)
すべてのローソク足で取引しない – 機関投資家のゾーンを待つ. Crystal Supply Demand Pro (SD Pro) は、MetaTrader 5 向けのプロフェッショナルな需給ゾーンインジケーターです。
チャートを乱雑な四角や古い概念で埋める代わりに、 機関レベルの明確なゾーン を表示します。
高時間足に最適化され、リアルタイム更新とプロフェッショナルな視覚効果で、重要なレベルのみを示します。 主な機能 機関レベルの需給ゾーン検出。 新鮮なゾーンとテスト済みゾーンの区別。 H1, H4, D1, W1 に最適化。 リアルタイム更新、リペイントなし。 プロフェッショナルな表示(色、透明度、50%ミッドライン、ラベル)。 リアルタイム統計パネル。 タイムフレーム警告システム。 軽量で効率的。 なぜ SD Pro を選ぶのか? 多くのインジケーターはランダムなゾーンでチャートを埋めます。
SD Pro は重要なゾーンのみをフィルタリングし、プロの形で表示します。 ユーザーガイド 購入後、完全なガイドを提
FREE

AtBot: どのように機能し、どのように使用するか ### どのように機能するか MT5プラットフォーム用の「AtBot」インジケーターは、テクニカル分析ツールの組み合わせを使用して売買シグナルを生成します。単純移動平均(SMA)、指数移動平均(EMA)、および平均真実範囲(ATR)インデックスを統合して取引機会を特定します。さらに、Heikin Ashiキャンドルを使用してシグナルの精度を向上させることもできます。 購入後にレビューを残すと、特別なボーナスギフトを受け取ります。 ### 主な機能: - 再描画なし: シグナルはプロット後に変更されません。 - 再描画なし: シグナルは一貫しており、変更されません。 - 遅延なし: 遅延なくタイムリーなシグナルを提供します。 - 多様な時間枠: あらゆる時間枠で使用可能で、取引戦略に合わせることができます。 ### 操作手順: #### 入力と設定: - firstkey (TrendValue): トレンド検出の感度を調整します。 - Secondkey (SignalValue): 売買シグナル生成の感度を定義します。 - ma

Dark Support Resistance is an Indicator for intraday trading. This Indicator is programmed to identify Support and Resistance Lines , providing a high level of accuracy and reliability.
Key benefits
Easily visible lines Only the most important levels will be displayed Automated adjustment for each timeframe and instrument Easy to use even for beginners Never repaints, never backpaints, Not Lag 100% compatible with Expert Advisor development All types of alerts available: Pop-up, Email, Push
オープニングレンジブレイクアウトインジケーターは 、ICT(インナーサークルトレーダー)、スマートマネーコンセプト(SMC)、 ボリューム または オーダーフロー ベースの戦略といった機関投資家の取引コンセプトに従うトレーダー向けに設計されたセッションベースの取引ツールです。このインジケーターは重要なセッションオープニングレンジをプロットし、トレーダーが主要な世界為替セッション全体にわたって潜在的な 流動性スイープ、ブレイクアウトゾーン、フェイクアウト、 そして 重要な日中レベル を特定できるようにします。 この戦略は 、オープニングレンジの概念に基づいています。これは、 各セッションの開始後に事前に定義されたタイムボックスであり、トレーダーがマーケットメーカーの意図、短期的なバイアス、日中の方向性を判断するのに役立ちます。このインジケーターは、レンジの高値と安値をマークし、それらのレベルを拡大することで、 スマートマネーブレイクアウト 、 セッションスイープ 、 フォールスブレイクアウト 、 フェアバリューギャップ(FVG) 、 レンジ拡大を 視覚的に監視するのに役立ちます。 こ

FX Dynamic: カスタマイズ可能なATR分析でボラティリティとトレンドを把握 概要
FX Dynamic は平均的な真のレンジ(ATR)の計算を活用して、日次および日中ボラティリティに関する卓越した情報をトレーダーに提供する強力なツールです。80%、100%、130%などのボラティリティ閾値を設定することで、通常の範囲を超えた際にすぐに警告を受け取ったり、有望な利益機会を素早く捉えられます。 FX Dynamic はブローカーのタイムゾーンに合わせて調整でき、安定したボラティリティ測定を維持しながら、リアルタイム分析のためにMetaTraderとシームレスに連携します。
1. なぜFX Dynamicがトレーダーにとって非常に有益か リアルタイムのATRインサイト
• 日次・日中のボラティリティをひと目で把握。価格がATRの80%、100%、130%などに達したときに警告を受け取り、重要な水準にあるかどうかを確認できます。
• ボラティリティが完全に爆発する前に潜在的な反転やブレイクアウトを先取り可能。 幅広いマーケットへの適用
• 外国為替、コモディティ、株価指数な
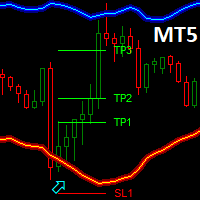
Dark Bands is an Indicator for intraday trading. This Indicator is based on Counter Trend strategy but use also Volatility. We can enter in good price with this Indicator, in order to follow the inversions on the current instrument.
Key benefits
Easily visible take profit/stop loss lines Reliable bands lines with futuristic colors, and Intuitive directional arrows Useful statistics , which indicate the win rate of the signals Plus Package available, leave a feedback to receive it for fr
FREE

Was: $299 Now: $99 Supply Demand uses previous price action to identify potential imbalances between buyers and sellers. The key is to identify the better odds zones, not just the untouched ones. Blahtech Supply Demand indicator delivers functionality previously unavailable on any trading platform. This 4-in-1 indicator not only highlights the higher probability zones using a multi-criteria strength engine, but also combines it with multi-timeframe trend analysis, previously confirmed swings a

MTF WAD Simplified Indicator - Professional Trading Solution Overview The MTF WAD Simplified is a sophisticated multi-timeframe volume-based indicator designed to track smart money flow across financial markets. By monitoring the Williams Accumulation/Distribution (WAD) across 8 different timeframes, this tool provides traders with unprecedented insight into institutional accumulation and distribution patterns. Core Benefits for Traders 1. Smart Money Tracking - Detect Institutional

The MTF Candlestick Patterns Detector indicator is a comprehensive Momentum & Trend Intelligence System designed to strip away market noise and provide institutional-grade clarity for retail traders. It specializes in high-probability signal detection by merging price action geometry with temporal confluence. Here is why this tool is a game-changer for your trading desk: Core Functionalities · Automated Candlestick Pattern Recognition: The indicator scans for high-alpha patterns (like E

Dark Absolute Trend is an Indicator for intraday trading. This Indicator is based on Trend Following strategy but use also candlestick patterns and Volatility. We can enter in good price with this Indicator, in order to follow the main trend on the current instrument. It is advised to use low spread ECN brokers. This Indicator does Not repaint and N ot lag . Recommended timeframes are M5, M15 and H1. Recommended working pairs: All. I nstallation and Update Guide - Troubleshooting

Gann 9+ Indicator Introduction The "Gann Matrix Chart" is the most simple and clear technical analysis in Gann theory, which is the calculation tool that Gann has always been committed to using. It is the essence of Gann's whole life. The Gann 9+ indicator uses the matrix chart to find the future high or low points of stocks or futures. Indicator Input: The base and step size can be set as 1 by default; When the multiple is -1, the multiple will be automatically obtained, or it can be filled in

The Quantum VPOC indicator has been developed to expand the two dimensional study of volume and price, to a three dimensional one which embraces time. The volume/price/time relationship then provides real insight to the inner workings of the market and the heartbeat of sentiment and risk which drives the price action accordingly. The Quantum VPOC indicator displays several key pieces of information on the chart as follows: Volume Profile - this appears as a histogram of volume on the vertical pr

This indicator provides several drawing tools to assist in various methods of chart analysis.
The drawings will keep their proportions (according to their handle trendline) across different chart scales, update in real time, and multiple drawings are supported.
#
Drawing Option
Description
1 Grid box draggable boxed grid, user defines rows x colums, diagonal ray option 2 Grid partial or fullscreen grid, sized by handle line 3 Grid flex a diagonal grid, sized and sloped by handle line
4 Cyc
The Trend Line PRO indicator is an independent trading strategy. It shows the trend change, the entry point to the transaction, as well as automatically calculates three levels of Take Profit and Stop Loss protection.
Trend Line PRO is perfect for all Meta Trader symbols: currencies, metals, cryptocurrencies, stocks and indices. The indicator is used in trading on real accounts, which confirms the reliability of the strategy. Robots using Trend Line PRO and real Signals can be found here:

スマートオートトレンドラインインジケーターは、MetaTrader 5チャート上に自動的にサポートとレジスタンストレンドラインを描画します。2つの方法(2つの極値(タイプ1)または極値とデルタ(タイプ2))を使用して主要な価格レベルを特定します。トレンドラインは新しいバーが形成されたときにのみ更新され、最適なパフォーマンスを保証します。
**特徴** **2つの極値(タイプ1)**:ユーザーが定義したバー範囲内で特定された2つの極値ポイント(高値/安値)に基づいてトレンドラインを描画します。
**極値とデルタ(タイプ2)**:極値ポイントと最小デルタポイントを組み合わせて、よりダイナミックなトレンドラインを描画します。
ラインの幅、色、極値の範囲などのカスタマイズ可能なパラメータ。
サポート(ピンク)とレジスタンス(ブルー)としてラインが描画され、選択および調整可能なプロパティを備えています。
**さらに詳しく** 市場での優位性と効率性を提供するために設計された当社の製品スイートで、トレーディングの可能性を最大限に引き出しましょう。 [ Link to
FREE
** All Symbols x All Timeframes scan just by pressing scanner button ** *** Contact me to send you instruction and add you in "M W Scanner group" for sharing or seeing experiences with other users. Introduction: Double Top(M) and Double Bottom(W) is a very repetitive common type of price reversal patterns. Double Top resembles M pattern and indicates bearish reversal whereas Double Bottom resembles W pattern and indicates a bullish reversal that they have high win rate. The M W Scanne

Elliott Wave Trend was designed for the scientific wave counting. This tool focuses to get rid of the vagueness of the classic Elliott Wave Counting using the guideline from the template and pattern approach. In doing so, firstly Elliott Wave Trend offers the template for your wave counting. Secondly, it offers Wave Structural Score to assist to identify accurate wave formation. It offers both impulse wave Structural Score and corrective wave Structure Score. Structural Score is the rating to sh

これはほぼ間違いなく、MetaTraderプラットフォームで見つけることができる最も完全な調和価格形成自動認識インジケーターです。 19種類のパターンを検出し、フィボナッチプロジェクションをあなたと同じように真剣に受け止め、潜在的逆転ゾーン(PRZ)を表示し、適切なストップロスとテイクプロフィットレベルを見つけます。 [ インストールガイド | 更新ガイド | トラブルシューティング | よくある質問 | すべての製品 ]
19の異なる調和価格形成を検出します
プライマリ、派生および補完フィボナッチ投影(PRZ)をプロットします
過去の価格行動を評価し、過去のすべてのパターンを表示します この指標は、独自の品質とパフォーマンスを分析します 適切なストップロスとテイクプロフィットのレベルを表示します
ブレイクアウトを使用して適切な取引を通知します すべてのパターン比をグラフにプロットします 電子メール/音声/視覚アラートを実装します スコット・M・カーニーの本に着想を得て、この指標は最も純粋で急を要するトレーダーのニーズを満たすように設計されています。ただし、トレードを容易にする

このインディケータは、相場の反転ポイントを予測する最もポピュラーなハーモニックパターンを識別します。これらのハーモニックパターンは、外国為替市場で常に繰り返され ている価格形成であり、将来起こりうる値動きを示唆します。/ MT4無料バージョン
さらに、このインジケーターには、市場エントリーシグナルと、様々な利食いと損切りが組み込まれています。ハーモニック・パターン・インディケータは、それ自体で売買シグナルを発 信することができますが、他のテクニカル・インディケータを使用してこれらの シグナルを確認することをお勧めします。例えば、RSIやMACDなどのオシレーターを使用して、トレンドの方向性やモメンタ ムの強さを確認してから売買を行うことを検討するとよいでしょう。
このインディケータのダッシュボードスキャナ: ( Basic Harmonic Patterns Dashboard )
含まれるハーモニックパターン ガートレー バタフライ バット カニ サメ サイファー ABCD
主な入力 Max allowed deviation (%): このパラメータは、調
FREE

Adaptive Volatility Range [AVR] - is a powerful tool for identifying key trend reversals. AVR - accurately displays the Average True Volatility Range taking into account the Volume Weighted Average price. The indicator allows you to adapt to absolutely any market volatility by calculating the average volatility over a certain period of time - this provides a stable indicator of positive transactions. Thanks to this , Adaptive Volatility Range has a high Winrate of 95% There are two ways t

Simple QM Pattern is a powerful and intuitive trading indicator designed to simplify the identification of the Quasimodo (QM) trading pattern. The QM pattern is widely recognized among traders for effectively signaling potential reversals by highlighting key market structures and price action formations. This indicator helps traders easily visualize the QM pattern directly on their charts, making it straightforward even for those who are new to pattern trading. Simple QM Pattern includes d
FREE

Haven Volume Profileは、取引量の分布に基づいて重要な価格レベルを識別するための多機能なボリュームプロファイル分析インジケーターです。市場をより深く理解し、重要なエントリーポイントとエグジットポイントを特定したいプロのトレーダー向けに設計されています。 その他の製品 -> こちら 主な機能: Point of Control (POC) 計算 - 最大の取引活動が行われるレベルで、最も流動性の高いレベルを特定するのに役立ちます Value Area(高い活動の領域)の定義とカスタマイズ可能な取引量の割合で、取引範囲をより正確に評価できます ティックボリュームと実際の取引量の両方に対応し、さまざまな市場タイプや取引戦略に対応しています 計算期間(日数)の柔軟な設定により、任意の時間枠にツールを適応させることができます ターミナルのライトテーマとダークテーマに自動的に適応し、ユーザーインターフェースの視覚的な体験を向上させます レベルの視覚化が明確で、スタイルや色をカスタマイズでき、グラフ分析と迅速な意思決定を支援します このインジケーターは、重要な価格レベルや統合ゾー
FREE

Super Signal Market Slayer
非リペイント|高精度|マルチマーケット対応インテリジェントトレンド指標 トレードにおいて本当に難しいのは、
注文することではなく、相場のノイズの中で「トレンドが始まった瞬間」を見極めることです。 Market Slayer はそのために開発されました。 本インジケーターは、日中取引向けに設計された非リペイント型のインテリジェント指標です。
多層確認とトレンドフィルターにより、重要な局面でのみ明確かつ信頼性の高い Buy / Sell シグナルを表示します。 主な特長 非リペイントシグナル
一度表示されたシグナルは固定され、消えたり移動したりしません。 高精度なトレンド判定
複数銘柄で検証され、特にゴールド M5 / M15 で安定した結果を示します。 マルチマーケット対応
ゴールド、FX、指数、主要暗号資産に対応。 日中取引向け最適化
M5・M15 に特化し、ノイズを抑え実行性を向上。 直感的で分かりやすい
初心者でも理解しやすく、すぐに使用可能。 技術ロジック概要 Market Slayer は単一条件の矢印ではありません。
以

トレンドラインマップインジケーターは、トレンドスクリーナーインジケーターのアドオンです。トレンドスクリーナー(トレンドラインシグナル)によって生成されたすべてのシグナルのスキャナーとして機能します。
これは、トレンドスクリーナーインジケーターに基づくトレンドラインスキャナーです。 Trend Screener Pro インジケーターがない場合、Trend Line Map Proは機能しません。
It's a Trend Line Scanner based on Trend Screener Indicator. If you don't have Trend Screener Pro Indicator, the Trend Line Map Pro will not work .
ブログにアクセスすると、トレンドラインマップインジケーターの無料バージョンをダウンロードできます。 Metatrader Testerの制限なしで、購入する前に試してみてください。 : ここをクリック
1.簡単になる利点 通貨と時間枠に基づいて売買シグナルを表示します。 チャー

マトリックスアローインジケーターMT5は、すべてのシンボル/商品(外国為替、商品、暗号通貨、インデックス、株式)で使用できる100%再描画されていないマルチタイムフレームインジケーターに続くユニークな10in1トレンドです。マトリックスアローインジケーターMT5は、初期段階で現在のトレンドを判断し、最大10の標準インジケーターから情報とデータを収集します。
平均方向移動指数(ADX) 商品チャネルインデックス(CCI) クラシック平研アシキャンドル 移動平均 移動平均収束発散(MACD) 相対活力指数(RVI) 相対力指数(RSI) 放物線SAR ストキャスティクス ウィリアムズのパーセント範囲 すべてのインジケーターが有効な買いまたは売りシグナルを与えると、対応する矢印がチャートに印刷され、次のろうそく/バーの開始時に強い上昇トレンド/下降トレンドを示します。ユーザーは、使用するインジケーターを選択し、各インジケーターのパラメーターを個別に調整できます。マトリックスアローインジケーターMT5は選択されたインディケーターからのみ情報を収集し、それらのデータのみに基づいてアローを印刷

The Market Sessions indicator is a popular tool among forex and stock traders for visually representing global trading sessions on a price chart. It highlights the time periods for major trading sessions — such as the Asian (Tokyo) , European (London) , and American (New York) sessions — directly on the chart. This helps traders identify when markets open and close, allowing for better decision-making based on session-specific trading behavior. - Asian Session (Default: 00:00-09:00) - London Se
FREE
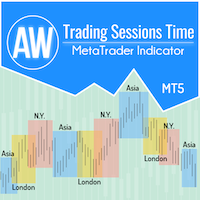
トレーダーが市場のパフォーマンスに関するデータを取得し、より適切な取引戦略を立てる際の利便性のために、当社は取引セッションインジケーターを開発しました。さまざまな取引所の営業時間は、市場活動や取引量に影響を与えるため、取引に影響します。これらの要因によって、さまざまな商品のボラティリティと取引機会が決まります。 AW トレーディング セッション インジケーターは、アジア、ロンドン、ニューヨーク市場の取引時間を表示します。トレーダーは、より良い体験のために、さまざまなタイム ゾーンを表示または非表示にすることができます。チャートでは、セッションの終了までの時間と、取引セッションのサイズを確認できます。チャート上のデータの表示には、さまざまなスタイルの取引チャートに適した柔軟なグラフィック調整機能があります。
その他の製品 -> こちら
利点:
アジア、ロンドン、ニューヨークの取引セッションを表示します。 必要に応じてセッションサイズを数字で表示します。 オンにすると、取引セッションの終了までの時間が表示されます。 取引セッションは個別に無効にすることができます。 チャート上のセッシ
FREE

Gartley Hunter Multi - An indicator for searching for harmonic patterns simultaneously on dozens of trading instruments and on all possible timeframes. Manual (Be sure to read before purchasing) | Version for MT4 Advantages 1. Patterns: Gartley, Butterfly, Shark, Crab. Bat, Alternate Bat, Deep Crab, Cypher
2. Simultaneous search for patterns on dozens of trading instruments and on all possible timeframes
3. Search for patterns of all possible sizes. From the smallest to the largest
4. All fou

ボリューム&流動性ハンター - スキャルピング は、複数の時間軸にわたるリアルタイムのボリューム急増や流動性ゾーンを追跡するために設計されたプロフェッショナルグレードのスキャルピング用インジケーターです。
このインジケーターは「スマートマネー(賢い資金)」のコンセプトとリアルタイムの市場状況を組み合わせており、正確なスキャルピング取引に最適なツールです。リバーサル(反転)、ブレイクアウト(突破)、またはフェアバリューギャップ(FVG)のいずれで取引している場合でも、このインジケーターは、実際の買いと売りの圧力が集中している場所を特定するのに役立ちます。 リアルタイム・ボリューム検出
ティックボリュームの急騰を追跡し、最近の履歴と比較して市場の異常な動きを強調表示します。 流動性ゾーンの識別
自動的にフェアバリューギャップ(FVG)や潜在的なオーダーブロックを検出します。価格が反応する可能性のあるゾーンを強調表示します。 M5〜H4までのマルチタイムフレーム分析、任意のタイムフレームを非表示にすることも可能
チャート上に明確なバーとボックスを直接表示します。邪魔にならず、カスタマ

すべての無料商品を見るにはここをクリック
完璧なマーケットチャンスを見極め、正確にブレイクアウトを取引するために、 RangeXpert は市場で最も 効果的なツールの1つ です。初心者やセミプロ向けに特別に開発されており、通常は 銀行、機関投資家、ヘッジファンドが使用するプロフェッショナルツール でしか見られない分析品質を提供します。 このインジケーターは、強い値動きにつながりやすいマーケットゾーンを特定し、それらを非常に明確かつ直感的に表示するため、複雑な構造でも瞬時に視覚化できます。 RangeXpert は誤った判断を減らし、タイミングを改善し、レンジが終わり本物のトレンドが始まる瞬間をリアルタイムで示します。 ボラティリティへの動的な適応、複数ポジションの強さ、利益のインテリジェントな分配によって、これは現在トレーダーが使用する 最も強力なブレイクアウトインジケーターの1つ となっています。
仕様 完璧なエントリーゾーン 完全に最適化されたチャートビュー 視認性の高いテイクプロフィットとストップロスライン シグナル最適化されたトレーリングストップ (pips 表示付
FREE

Gold Trend - これは優れた株価テクニカル指標です。指標のアルゴリズムは、資産の値動きを分析し、ボラティリティと潜在的なエントリーゾーンを反映しています。
最高の指標シグナル:
- 売りの場合 = 赤のヒストグラム + 赤のショートポインター + 同じ方向に黄色のシグナル矢印 + 赤色のトレンド方向矢印 。 - 買いの場合 = 青のヒストグラム + 青のロングポインター + 同じ方向の水色のシグナル矢印 + 青色のトレンド方向矢印 。
インジケータの利点
1. このインディケータは、高い精度でシグナルを発信します。 2. 確定した矢印シグナルは、トレンドが変化したときにのみ再描画されます。 3. どのブローカーのMetaTrader 5取引プラットフォームでも取引できます。 4. あらゆる資産(通貨、金属、暗号通貨、株式、指数など)を取引できます。 5. M15-H1タイムフレーム(中期取引)で取引するのがよい。 6. 各トレーダーがインディケータを自分用に簡単にカスタマイズできるよう、インディケータ設定で個々のパラメータ(TF、色など)を変更できます。 7.

この情報インジケーターは、アカウントの現在の状況を常に把握したい人にとって役立ちます。
- より便利なインジケーター このインジケーターには、ポイント、パーセンテージ、通貨での利益、現在のペアのスプレッド、現在の時間枠でバーが閉じるまでの時間などのデータが表示されます。 チャート上に情報線を配置するには、いくつかのオプションがあります。 価格の右側 (価格の後ろにあります)。 コメントとして (グラフの左上隅に); 画面の選択した隅。 情報区切り記号を選択することもできます。 | /
\ # このインジケーターは使いやすく、非常に有益です。設定で不要な情報項目を無効にすることも可能です。 設定 外観の種類 - 情報行の表示タイプ。次の 3 つのオプションがあります。 価格に従ってください - 価格に従う。 コメントとして - コメントとして; 画面の選択した隅に - 画面の選択した隅にあります。 添付用グラフコーナー - 表示タイプを選択した場合 画面の選択されたコーナーでは、この項目を使用して 4 つのスナップ コーナーの 1 つを選択
FREE
Special offer : ALL TOOLS , just $35 each! New tools will be $30 for the first week or the first 3 purchases ! Trading Tools Channel on MQL5 : Join my MQL5 channel to update the latest news from me SuperTrend ATR Multiplier with Scanner for MT5 をご紹介します。これは、マーケットトレンドに先んじるための多機能で強力なツールで、カスタマイズ可能な機能とリアルタイムのアラートが備わっています。このインディケーターは、 Kivanc Ozbilgic の信頼できる SuperTrend ロジックを基に、正確なトレンド信号を提供します。 ATR の計算方法は、柔軟に対応するために RMA (相対移動平均)と SMA (単純移動平均)から選べます。デフォルト設定では、 ATR 期間が10、乗数が3に設定されており、 SuperT
FREE
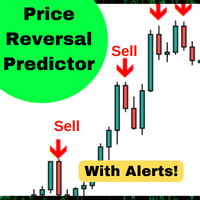
このアルゴリズムは、90%*の精度で価格の短期的な変化を予測します。 価格が信号キャンドルよりも高いか低いかを予測します。 より大きな時間枠で平均復帰取引、バイナリオプションや先物契約のための完璧な。 この指標は5年間のデータに基づいてバックテストされ、時間の経過とともに価格の逆転を予測するための90%の精度を持っています。
特徴:
簡単なセットアップ 任意のグラフにドラッグアンドドロップ アラートを有効にする(オプション) そして、あなたは完了です! 視覚的および音声的な警告 お使いの携帯電話に直接送信されるアラート 端末に送信されるポップアップ警告 高いwinrate 取引の最大90%を獲得 バックテストされた5年と複数の通貨。 (バックテストの詳細と分析については、ウェブサイトを参照してください)。 多数の信号 アクティブモードでは、シンボルごとに一日3-6信号を期待しています パッシブモードでは、シンボルごとに1日に2つの信号を期待しています。 *これは30分の蝋燭の表示器があればあります。 柔軟性 外国為替、指数、コモディティや株式に取り組んでいます。 任意の時間枠で動
FREE

MACD Intraday Trendは、1960年代にGeraldAppelによって作成された元のMACDを適応させて開発された指標です。
長年の取引を通じて、MACDのパラメーターをフィボナッチの比率で変更することにより、トレンドの動きの連続性をより適切に表現できることが観察され、価格トレンドの開始と終了をより効率的に検出できるようになりました。
価格トレンドの検出が効率的であるため、トップとボトムの相違を非常に明確に識別し、取引機会をより有効に活用することもできます。
設定可能な機能とアラートを備えたプロフェッショナルバージョンをぜひお試しください: MACD Intraday Trend PRO
特徴 任意の通貨ペアで機能します 任意の時間枠で動作します 練行足チャートで動作します
それでも質問がある場合は、直接メッセージで私に連絡してください。 https://www.mql5.com/ja/users/robsjunqueira/
FREE

Golden Spikes Indicator Technical indicator for synthetic indices trading on M1 timeframe. Compatible with Boom/Crash indices on Deriv platform and Gain/Pain indices on Weltrade platform. send me A private message to receive trade ASISTANT EA.. booklet guide: https://drive.google.com/file/d/1knQJqGHZSP5eQN24ndRz2ayZVCst6XhN/view?usp=sharing
Also check my premium spikes bot: https://www.mql5.com/en/market/product/142350 Features Uses Parabolic SAR, RSI, and Bollinger Bands analysis Three risk

基本的な需給インジケータは、あなたの市場分析を強化し、あらゆるチャート上の重要な機会領域を特定するために設計された強力なツールです。直感的で使いやすいインターフェイスで、この無料のメタトレーダー用インディケータは、需給ゾーンを明確に表示し、より多くの情報に基づいた正確な取引判断を可能にします / MT4無料版 この指標のダッシュボードスキャナー: ( Basic Supply Demand Dashboard )
特徴 チャートの需給ゾーンを自動的にスキャンし、面倒な手動分析を不要にします。 直近の需給ゾーンまでの残り距離をグラフィカルに表示 供給ゾーンは特徴的な色で強調表示され、需要ゾーンは別の色で表示されるため、迅速かつ正確な解釈が可能。 このインディケータは、最も近い供給ゾーンまたは需要ゾーンとチャート上の現在価格との距離をpips単位で自動的に計算し、明確かつ定量的な指標を提供します。pips単位の距離はチャート上にはっきりと見やすく表示され、現在価 格との距離が大きい、または小さいエリアを素早く特定できます。 需給ゾーンの接近やブレイクを警告 どのタイムフレームでも機
FREE

After your purchase, feel free to contact me for more details on how to receive a bonus indicator called VFI, which pairs perfectly with Easy Breakout for enhanced confluence!
Easy Breakout MT5 is a powerful price action trading system built on one of the most popular and widely trusted strategies among traders: the Breakout strategy ! This indicator delivers crystal-clear Buy and Sell signals based on breakouts from key support and resistance zones. Unlike typical breakout indicators

Meravith Autoは、Meravithトレーディングシステムの自動化バージョンです。 このインジケーターは、色が変化するトレンドラインで構成されています。強気のときは緑色、弱気のときは赤色になります。これはトレンドのサポートラインです。強気の出来高と弱気の出来高が等しくなる流動性ライン。三重の強気デビエーションライン。三重の弱気デビエーションライン。大きな出来高を示す紫色と青色のドット。紫色のドットは平均出来高より2つのデビエーション分大きい出来高を示し、青色のドットは2つのデビエーションを示します。 使い方は? 強気のトレンドラインと、トレンドラインの上にある流動性は強気トレンドを示します。市場は上昇すると予想されます。ロングポジションを開きます。 弱気のトレンドラインと、トレンドラインの下にある流動性は弱気トレンドを示します。市場は下落すると予想されます。ショートポジションを開きます。 他のインジケーターと自由に組み合わせて使用できます。
どの通貨ペア、どの時間足でも使用できます。
ブローカーが提示する出来高の違いにより、結果が異なる場合があります。
出来高が多いため、大

Gold Venamax - これは最高の株式テクニカル指標です。 指標アルゴリズムは資産の価格変動を分析し、ボラティリティと潜在的なエントリーゾーンを反映します。 インジケーターの機能: これは、快適で収益性の高い取引のためのマジックとトレンド矢印の 2 つのブロックを備えたスーパー インジケーターです。 チャート上にブロックを切り替えるための赤いボタンが表示されます。 マジックはインジケーター設定で設定されているため、異なるブロックを表示する 2 つのチャートにインジケーターをインストールできます。 Gold Venamax は、異なる矢印バッファー (GV と SD) を備えた 2 つのチャートに配置できます。 これを行うには、設定で異なる Magic を選択する必要があります。たとえば、あるマジック = 999、別のマジック = 666 を選択します。次に、チャート上の赤いボタンで矢印バッファを選択できます。 インジケーター設定の各矢印バッファー (GV および SD) には、快適で収益性の高い取引のための個別の矢印フィルターがあります (UseFiltrGV = true;

Volume Bar POC インジケーター は、ティック取引量に基づいて、重要な価格レベル(Point of Control, POC)を正確に可視化する革新的なツールです。このインジケーターは、各ローソク足内のすべての価格ポイントを分析し、最も重要な価格レベルを表示します。これにより、強力なサポートゾーンおよびレジスタンスゾーンとして利用できます。日中取引や長期的な取引戦略に最適です。 Volume Bar POC インジケーターはどのように機能しますか? このインジケーターは、各ローソク足の形成中にPOCを計算するための高度なプロセスを使用しています: ローソク足のオープン時にテーブルを作成 : 新しいローソク足がオープンすると、インジケーターは次のデータを含む内部テーブルを作成します: 価格 :ローソク足の安値(Low)と高値(High)の範囲内にあるすべての価格レベル。 取引量 :各価格レベルのティック数(ティック取引量)。 このテーブルは、ローソク足の範囲内のすべての価格ポイントを動的にカバーします。 ローソク足の形成中にテーブルを更新 : 高値と安値が変化すると、新しい価

Magic Histogram MT5インジケーターは、スキャルピングや中期取引に適したユニバーサルツールです。 この指標は革新的な公式を使用しており、トレンドの方向性と強さを判断することができます。 Magic Histogram MT5は再描画されないため、履歴データを使用してその効率を評価できます。 M15、M30、H1、H4に最適です。
インジケーターの利点 優れたインジケーター信号! 初心者や経験豊富なトレーダーに適しています。 柔軟なインジケーター設定を使用して、インジケーターを取引スタイルに合わせて調整できます。 すべての時間枠で動作します。 あらゆる金融商品で動作します。 再描画/再描画しません。 電子メールおよびモバイルデバイスへの信号の送信。
推奨される使用法
買いシグナル:インジケーター値が負から正に変化しました。 売りシグナル:インジケーター値が正から負に変化しました。 Magic Histogramは、位置入力信号を直接提供します。したがって、適切なストップロスを計算して利益値を取得するだけで済みます。 推奨される記号: AUDUSD、EURUSD、USD

Mean Reversion Supply Demand Indicator Mean Reversion Supply Demand is the indicator to detect the important supply demand zone in your chart. The concept of supply demand trading relies on the quantity mismatching between buying and selling volumes in the financial market. Typically, supply demand zone serves to predict the turning point. The wave pattern, for any supply demand zone to work as an successful trade, looks like the price must touch the base zone, move away and then return to zone
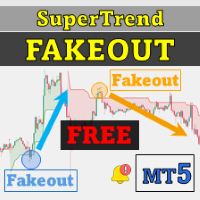
Special offer : ALL TOOLS , just $35 each! New tools will be $30 for the first week or the first 3 purchases ! Trading Tools Channel on MQL5 : Join my MQL5 channel to update the latest news from me Supertrend Fakeout インジケーターは、従来の Supertrend インジケーターを改良したバージョンで、より信頼性の高いトレンドシグナルを提供することを目的としています。 Fakeout Index Limit や Fakeout ATR Mult といった高度な機能を取り入れることで、このインジケーターは短期的な価格変動や市場ノイズによって引き起こされる誤ったトレンド反転をフィルタリングするのに役立ちます。 MT4バージョンを見る: Supertrend Fakeout MT4 その他の製品を見る: すべての製品 動作の仕組み Supertr
FREE

Easy Buy Sell is a market indicator for opening and closing positions. It becomes easy to track market entries with alerts.
It indicates trend reversal points when a price reaches extreme values and the most favorable time to enter the market. it is as effective as a Fibonacci to find a level but it uses different tools such as an algorithm based on ATR indicators and Stochastic Oscillator. You can modify these two parameters as you wish to adapt the settings to the desired period. It cannot

Orderflow Scalp Pro v2.4 delivers institutional-grade trading intelligence through advanced volume analysis, dynamic VWAP calculations, real-time aggressive score monitoring, and precision arrow signals. This complete trading system transforms complex market data into clear, actionable signals for consistent profitability on 3-4 minute timeframes.
Full Documentation: [Download PDF] Four Powerful Components in One System Volume Profile HeatMap with POC/VAH/VAL Transform your charts into inst

ブレーカートレーダーになり、価格が反転すると市場構造からの利益が変化します。
注文ブロックブレーカーインジケーターは、トレンドまたは価格の動きが枯渇に近づいており、逆転の準備ができていることを識別します。通常、反転または大規模なプルバックが発生しようとしているときに発生する市場構造の変化について警告します。
この指標は、ブレイクアウトと価格の勢いを識別する独自の計算を使用します。使い果たされる可能性のあるポイントの近くで新しい高値が形成されるたびに、インディケーターはその高値の作成を担当する最後の注文ブロックを描きます。次に、移動する価格とともに注文ブロックを追跡します。その後、価格が反対方向にシフトし、その注文ブロックを突破すると、新しい市場構造を作成し、トレンドまたは大きな後退の可能性のある反転の開始を警告します。
注文ブロックは、高値/安値が作成される前の最後の反対色のろうそくであり、価格がこれらの重要な領域を下抜けすると、トレンドの短期的または長期的な反転の兆候です。
特徴 重要な枯渇点での市場構造の変化を警告します 価格が使い果たされるレベルに近づくと、自動的に

サポート線と抵抗線のプロットにうんざりしていませんか? サポートレジスタンス は、非常に興味深いひねりを加えてチャート内のサポートとレジスタンスラインを自動検出およびプロットするマルチタイムフレームインジケーターです。価格レベルは時間とともにテストされ、その重要性が高まるにつれて、ラインは太くなり、暗くなります。 [ インストールガイド | 更新ガイド | トラブルシューティング | よくある質問 | すべての製品 ] 一晩でテクニカル分析を強化 チャートを閲覧せずに重要な価格レベルを検出 一目ですべての価格レベルの相対的な強さを認識する すべての取引で最大30時間のプロットラインを節約 インジケーターは、すべての価格レベルの年齢を表示します インジケーターは再描画されていません 過去および現在の価格レベルは近接によって崩壊し、現在の市場行動に合わせて調整されます。動作は、必ずしもピークではない場所に線が引かれます。 価格レベルは、時間とともに拒否されるにつれて、より暗く、より広くなります ノイズを避けるために、重要でない価格レベルは定期的にクリアされます カスタマイズ可能な時間枠の

ほとんどのトレーダーが 見る のはエンゴルフィングキャンドルです。 それらを利益を出して取引する方法を知っている人は少ないです。 Engulfing Pro Traderは、シンプルなシグナルと実際の統計データ—取引、勝率、利益—を提供し、自信を持ってリバーサルを取引できるようにします。希望ではなく、あなたが必要とする実際の数字だけです。Real Tradesでは、夢物語ではなく真実をお見せします。 エンゴルフィング戦略の現実を見て気に入りましたか?5つ星のレビューを残して、 私にプライベートメッセージを送ってください 。感謝の気持ちとしてReal Tradesから独占無料製品をお贈りします!
他の製品をチェック してさらに現実的な戦略をご覧いただき、 Real Tradesコミュニティに参加 して自信を持って取引し、本物のトレーダーとつながりましょう! このインジケーターは、古典的なエンゴルフィングパターンをあなたのために機能させます: 明確なシグナル:チャート上に最大3つのテイクプロフィットレベルとストップロス付きの買い/売りシグナルをプロットします。 キルゾーンタイミング: 高
FREE

このアルゴリズムは、86%*の精度で価格の短期的な変化を予測します。 ATRによって決定されるように大きな動きがある場合,買われ過ぎや売られ過ぎの状態の間に,インジケータはあなたに警告します. 価格が信号キャンドルよりも高いか低いかを予測します。 より大きな時間枠で平均復帰取引、バイナリオプションや先物契約のための完璧な。 この指標は5年間のデータに基づいてバックテストされ、時間の経過とともに価格の逆転を予測するための90%の精度を持っています。
特徴:
簡単なセットアップ 任意のグラフにドラッグアンドドロップ お好みに合わせてパラメータを調整(オプション) アラートを有効にする(オプション) そして、あなたは完了です! 視覚的および音声的な警告 お使いの携帯電話に直接送信されるアラート 端末に送信されるポップアップ警告 高いwinrate 取引の最大90%を獲得 バックテストされた5年と複数の通貨。 (バックテストの詳細と分析については、ウェブサイトを参照してください)。 多数の信号 シンボル*ごとに1日に2つの信号を期待しています。 *これは30分の蝋燭の表示器があればありま
FREE
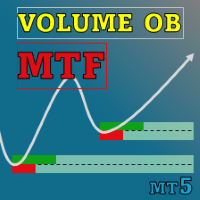
Special offer : ALL TOOLS , just $35 each! New tools will be $30 for the first week or the first 3 purchases ! Trading Tools Channel on MQL5 : Join my MQL5 channel to update the latest news from me ボリュメトリックオーダーブロック多時間枠 インジケーターは、主要な市場参加者が注文を蓄積する重要な価格エリアを特定することで、より深い市場の洞察を求めるトレーダー向けに設計された強力なツールです。これらのエリアはボリュメトリックオーダーブロックとして知られており、サポートやレジスタンスの潜在的ゾーンとして機能し、取引の意思決定において重要な優位性を提供します。 MT4バージョンを見る: Volumetric Order Blocks MT4 Multi Timeframe See more products at: https://www.mql5.com/en
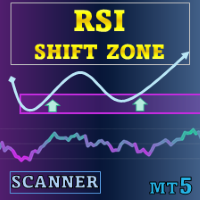
特別オファー : ALL TOOLS 、各 $35 のみ! 新しいツール は 最初の週 または 最初の 3 つの購入 で $30 になります! Trading Tools Channel on MQL5 :最新情報を受け取るにはチャンネルに参加してください RSI Shift Zone Scanner は、RSI シグナルをプライスアクションと結び付け、市場センチメントが変化する可能性のある瞬間を特定します。RSI が設定レベル(デフォルトでは 70=買われ過ぎ、30=売られ過ぎ)を上抜け・下抜けすると、インジケーターはチャート上にチャネルを描画します。これらのチャネルはセンチメントが反転した可能性のある領域を示し、サポートやレジスタンスとして機能することがあります。 MT4 版はこちら: RSI Shift Zone MT4 Scanner その他の製品: All P roducts RSI が上限または下限をクロスすると、新しいチャネルが生成されます。 チャネルの境界はクロスしたローソク足の高値と安値に固定され、中間線が平均値を示します。 各チャネル
すべての無料商品を見るにはここをクリック
ZoneXpert は MetaTrader 5 のための視覚的マーケット分析ツールで、 サポートゾーンとレジスタンスゾーンを自動検出 し、色で強調し、リアルタイムで更新します。 このインジケーターは価格構造、高値、安値、ボリューム領域を分析し、市場が実際に反応する場所と、突破する場所を正確に示します。 ZoneXpert を使えば、市場の力がどこに集中しているかを即座に把握でき、ランダム性が支配する場所ではなく、実際に意思決定が行われる場所でトレードできます。 手動でラインを引いたり、古いレベルを比較したりする必要はなく、 ZoneXpert はグラフ上に直接、動的で分かりやすいゾーンシステムを提供します。 各ゾーンは市場の動きに合わせて自動的に調整され、エントリーやエグジットの計画、リスク管理、市場反応の理解に最適です。 Forex、Gold、Index など、どの市場でも ZoneXpert は市場が本当に意思決定を行う見えない価格領域を明らかにします。 構造、タイミング、視覚的な明瞭さ を重視するトレーダーに最適なツールです。
FREE
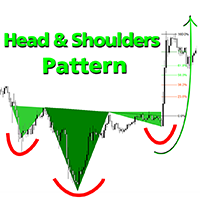
ウェルカムプライス:35ドル ヘッドアンドショルダーパターン は、信頼性の高いパターン認識を求めるトレーダーに最適です。強気と弱気の両方のヘッドアンドショルダー形成を含み、フィボナッチレベル、ネックラインブレイク検出、早期予測技術が統合されています。テクニカル分析とチャート構造・トレンド反転の正確な識別を重視する方のための強力なMT5ツールです。 二重検出方法 方法1 - クラシックパターン検出
明確な構造ルールを使用して標準的なヘッドアンドショルダーパターン(通常型、逆型、非標準型)を検出します。
この方法が強調する点: 明確なネックラインブレイク 対称的なパターン形成 フィボナッチリトレースメントレベルに基づく即時反応ゾーン 方法2 - 予測的パターン検出
右肩が形成される前でも左肩と頭部を早期に識別する革新的なアプローチ。
予測三角形 を使用し、 Early_Quick_Pipsライン を描画 - より速いエントリーポイントと価格変動への準備時間を提供します。 この方法ではフィボナッチレベルが異なる方法で計算されます: 0.0%レベル は Early_Quick_Pips予測

SynaptixQuant Dominance Matrix: Institutional-Grade Market State Extraction
Engineered for traders who require a data-driven view of market behaviour beyond surface-level indicators. The Synaptix Quant (SQ) Dominance Matrix is not a conventional currency strength display. Behind its intentionally streamlined interface runs a sophisticated analytical architecture designed to quantify market conditions with precision. Every output is generated through layered signal processing built to identify d

MetaTrader 5用 Candle Smart Range (CSR) Candle Smart Rangeは、複数のタイムフレームで価格レンジを自動的に識別するためのテクニカル指標です。このツールは、ローソク足の形成と、以前の高値・安値との相互作用に基づいて市場構造を分析します。 主な機能: レンジ検出: 勢いのある動きの前のコンソリデーション(保ち合い)ゾーンを特定します。 だまし(フェイクアウト)の識別: 価格が以前の水準を超えたものの、ローソク足の終値基準でレンジ内に戻った場合をマークします。 マルチタイムフレーム分析: カスタム期間を含む最大19のタイムフレームのデータを1つのチャートに表示します。 内部可視化(ズーム): チャートを切り替えずに、上位足のローソク足内部の値動きを確認できます。 時間フィルター: 主要な市場セッションなど、特定の時間帯で動作するように設定可能です。 履歴確認モード: 過去のデータをステップバイステップで確認し、分析できます。 アラート機能: ローソク足の確定や新しいレンジの検出を通知します。 インターフェース: 視覚的な負荷を管理する画面
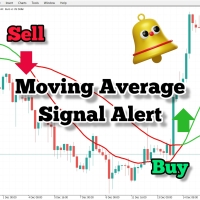
取引戦略で移動平均を使用している場合、このインジケーターは非常に役立ちます。 2つの移動平均がクロスするとアラートを提供し、音声アラートを送信し、取引プラットフォームに通知を表示し、イベントに関する電子メールも送信します。 独自の取引スタイルと戦略に適応するための簡単にカスタマイズ可能な設定が付属しています。
調整可能なパラメーター: 高速MA 遅速MA メール送信 音声アラート プッシュ通知
他の製品もチェックしてください: https://www.mql5.com/en/users/8587359/seller
それらに関する質問やフィードバックがある場合は、コメントを残すか、プライベートメッセージを送信してください。
成功した取引を!
FREE

This is the best Support and Resistance Indicator on the market, and it shows both confirmed Support and Resistance as well as Retests. Support & Resistance: Support marks where buying demand halts price declines, acting as a safety net. Resistance caps price surges, driven by selling pressure. Traders leverage these levels to predict reversals, plan entries, exits, and manage risks, making them trading's fundamental guideposts. Join To Learn Market Depth - https://www.mql5.com/en/channels/su
FREE

Trendline Targets Dashboard MT5 Trendline Targets Dashboard MT5 は、MetaTrader 5 用のインジケーターで、完全なビジュアル・トレードプランを表示します。 シグナル 、 エントリー価格(Entry) 、 ストップロス(Stop Loss) 、および 利確目標(Take Profits) を、リスク比率 R に基づいて自動的に計算します。 このツールは注文を出すものではありません。トレードの分析と視覚的管理を目的としたツールであり、自動売買ロボット(EA)ではありません。 リリース記念特典: 購入者全員に、私の MQL5 プロフィールにあるお好きな インジケーターを1つ無料でプレゼント します。 ※ 注意: Market Structure Order Block Dashboard MT5 は特典対象外です。 特典を受け取るには、購入後に MQL5 メッセージ機能でご希望の製品名をお送りください。 主な機能 ネオンエフェクト付きトレンドライン(強気/弱気) ローソク足確定時のトレンド反転による BUY/SELL
MetaTraderマーケットは自動売買ロボットとテクニカル指標を販売するための最もいい場所です。
魅力的なデザインと説明を備えたMetaTraderプラットフォーム用アプリを開発するだけでいいのです。マーケットでプロダクトをパブリッシュして何百万ものMetaTraderユーザーに提供する方法をご覧ください。
取引の機会を逃しています。
- 無料取引アプリ
- 8千を超えるシグナルをコピー
- 金融ニュースで金融マーケットを探索
新規登録
ログイン