
PRESSURE BREAKOUT
Rejection > Formation > Volume > Breakout

MQL5 Blogs = https://www.mql5.com/en/blogs/post/776873
MT4 Version = https://www.mql5.com/en/market/product/199357
MT5 Version = https://www.mql5.com/en/market/product/199358
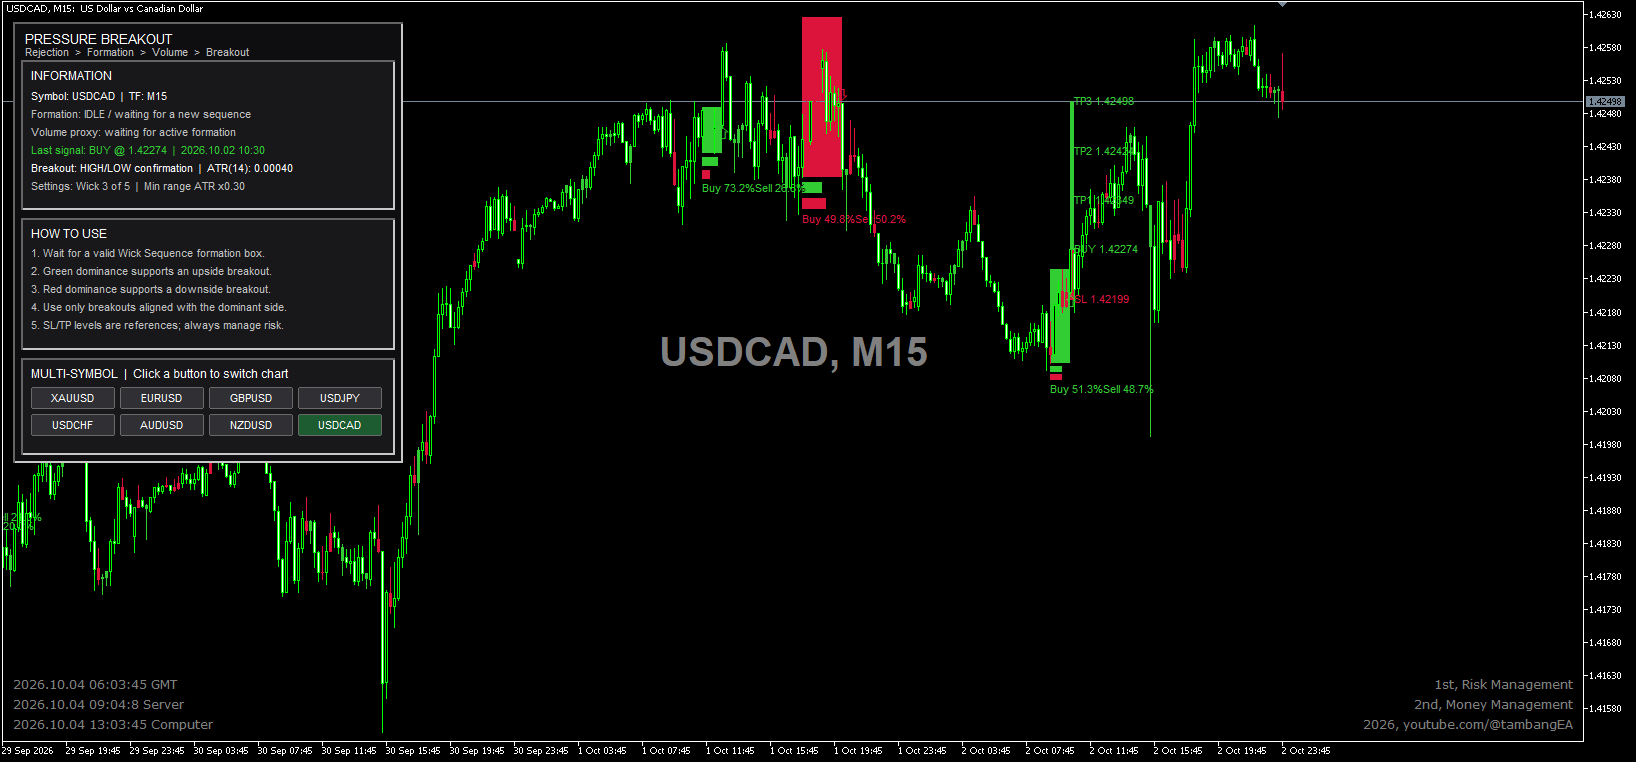
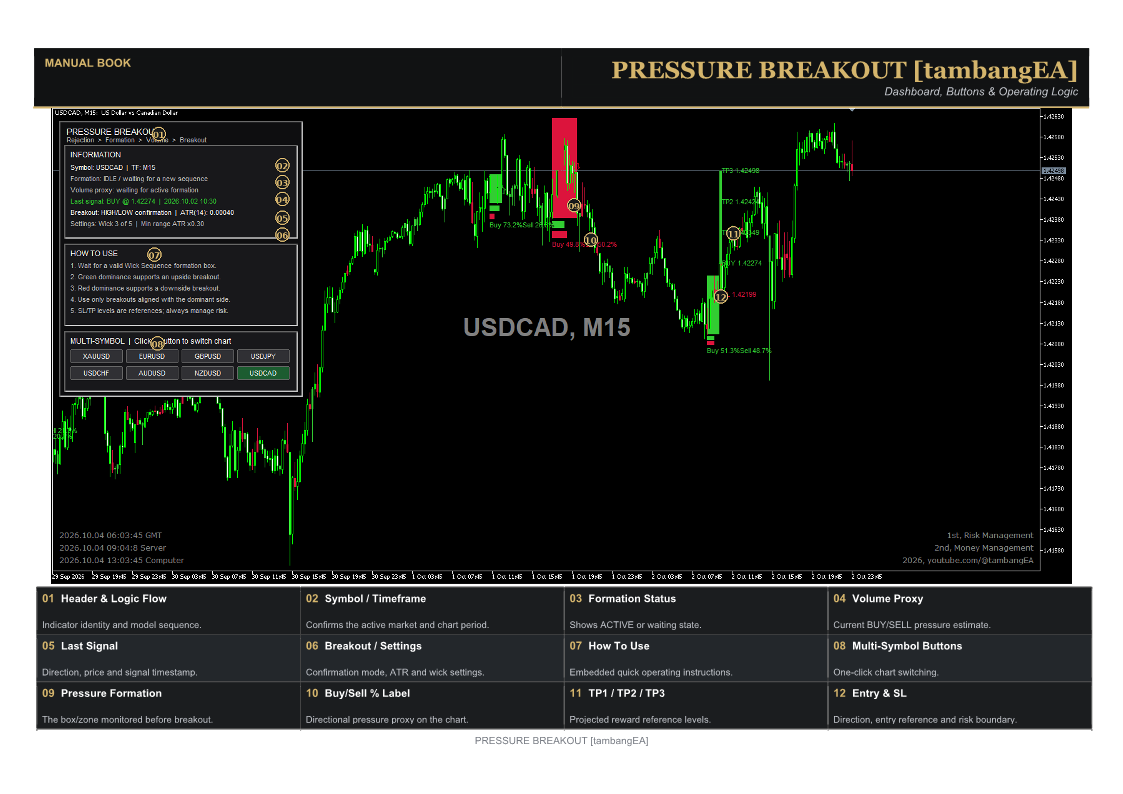
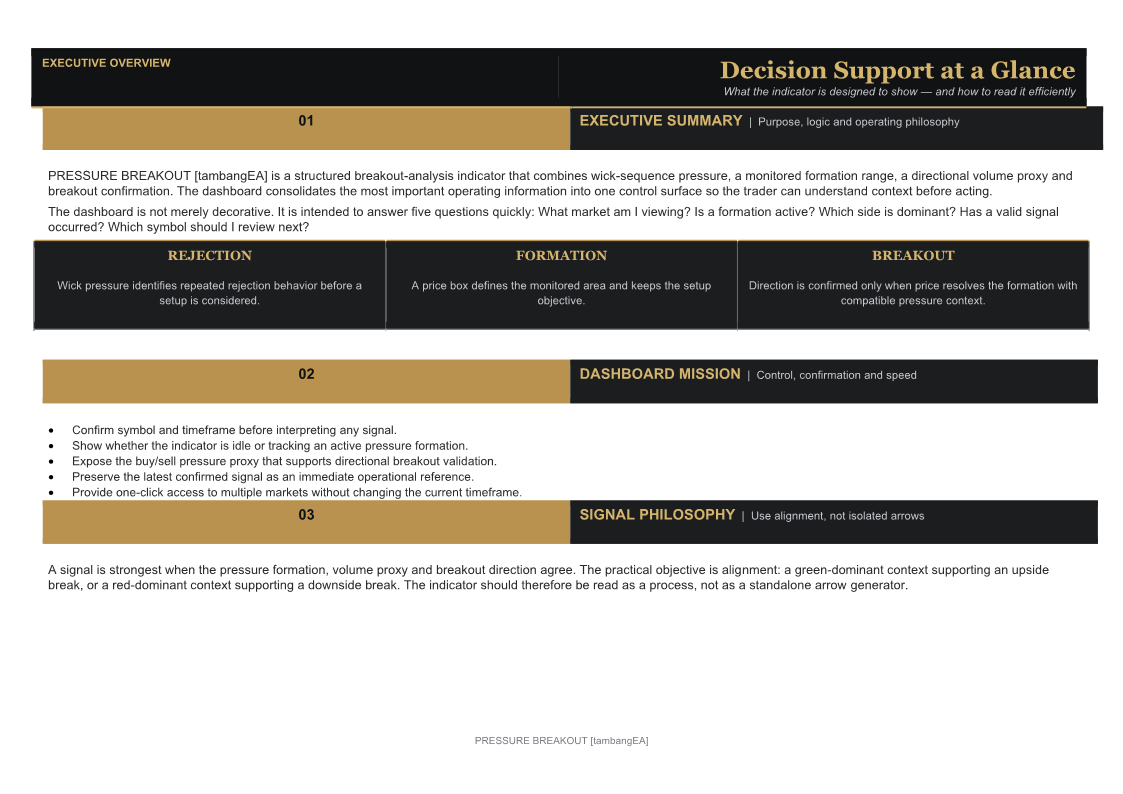
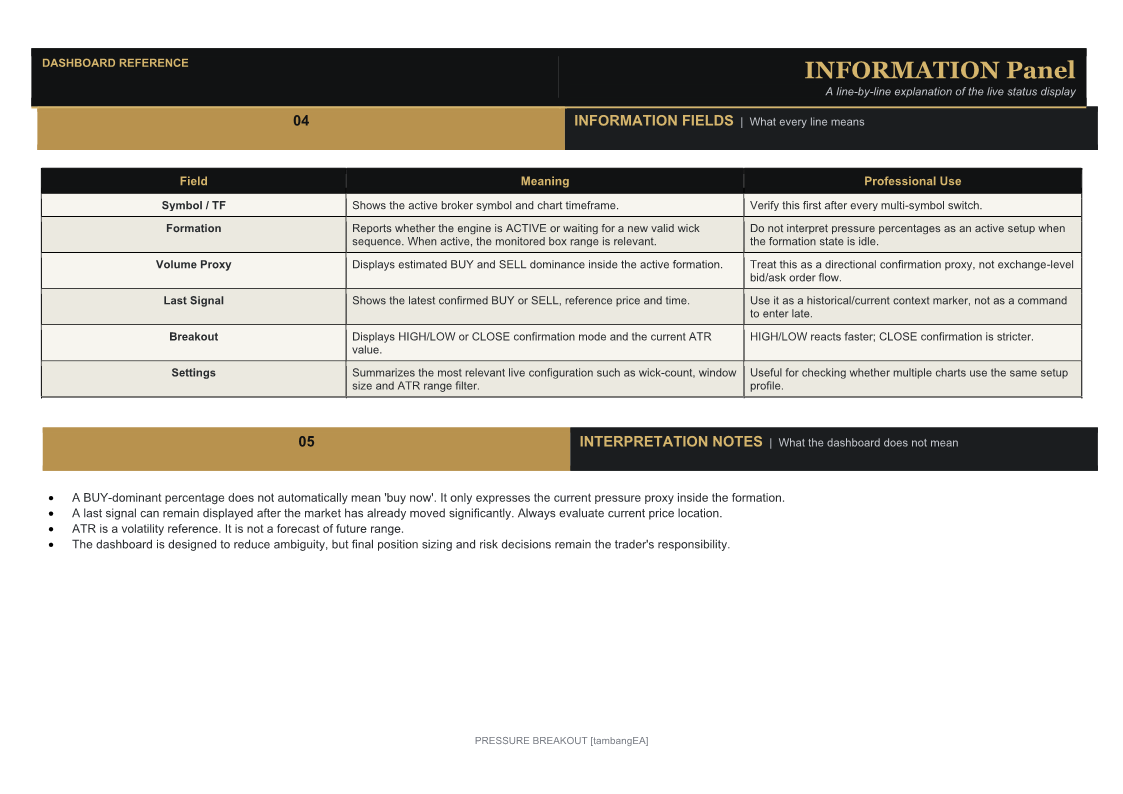
Pressure Breakout [tambangEA] is a professional MetaTrader indicator designed to identify price-pressure formations, evaluate directional dominance inside the formation, and confirm breakouts using a structured combination of wick behavior, volatility, volume proxy, and price expansion.
Instead of reacting to a single candle, the indicator looks for a sequence of qualifying wick candles within a configurable window, builds a pressure zone, monitors the development of that zone, and waits for a breakout that is aligned with the dominant pressure side.
The workflow is simple:
Rejection → Formation → Volume → Breakout
The indicator also includes an integrated dashboard, interactive multi-symbol navigation, visual entry/SL/TP references, and automatic broker symbol prefix/suffix detection.
Key Features
Wick Sequence Detection
Pressure Breakout analyzes candle geometry and identifies:
- upper-wick rejection formations;
- lower-wick rejection formations;
- multiple qualifying candles within a configurable window;
- ATR-based minimum candle-size filtering.
The candle body color is not the primary criterion. The indicator focuses on the location and proportion of the wick relative to the complete candle range.
This allows the system to recognize rejection pressure rather than relying only on bullish or bearish candle color.
N-of-M Formation Logic
The indicator does not require every wick candle to appear consecutively.
For example:
3 qualifying candles inside the latest 5 candles
can be used to create a valid pressure formation.
This provides a more flexible formation model while still requiring repeated evidence of rejection.
Automatic Pressure Formation Box
Once a valid Wick Sequence is detected, the indicator creates a formation box based on the recent price range.
The box represents the area where price pressure is being evaluated.
The indicator then waits for price to resolve the formation through either:
- an upside breakout, or
- a downside breakout.
The box automatically expands while the formation remains active.
Buy / Sell Pressure Proxy
Pressure Breakout estimates the directional pressure inside the formation.
The dashboard and chart can display:
Buy xx%
Sell xx%
The calculation combines candle position within its High-Low range with available volume information.
Example:
If candles repeatedly close near their highs, the system assigns more weight to buying pressure.
If candles repeatedly close near their lows, the system assigns more weight to selling pressure.
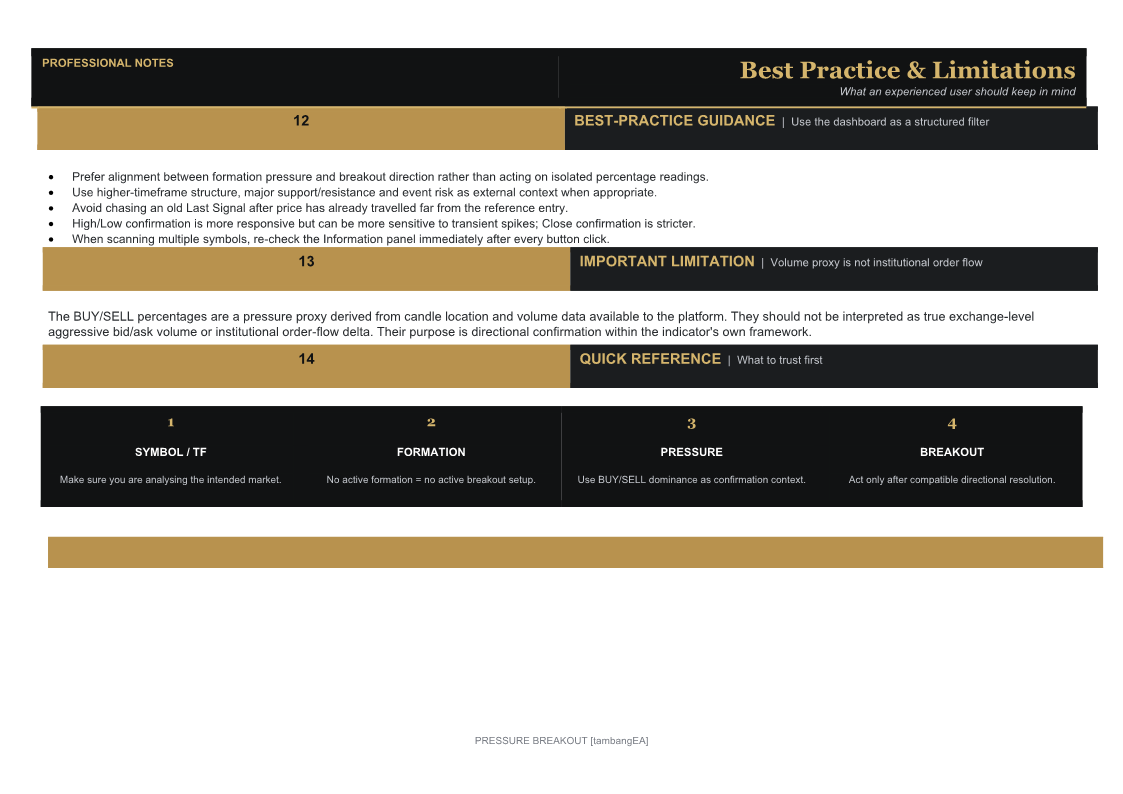
The pressure calculation is used as a directional confirmation filter.
Important: Buy/Sell percentages are an analytical volume-pressure proxy. They should not be interpreted as true exchange-level bid/ask order-flow delta.
Breakout Confirmation
A breakout signal is generated when price exits the active formation and the breakout direction agrees with the dominant pressure side.
Bullish Signal
Typical sequence:
Lower-wick pressure → Formation → Buy dominance → Upward breakout → BUY signal
Bearish Signal
Typical sequence:
Upper-wick pressure → Formation → Sell dominance → Downward breakout → SELL signal
A breakout against the dominant side can be rejected by the indicator.
This helps reduce signals caused by directionally inconsistent price movement.
Two Breakout Modes
Pressure Breakout supports two breakout-confirmation methods.
High / Low Confirmation
The breakout is confirmed when:
High > Formation High
or:
Low < Formation Low
This mode is more responsive.
Close Confirmation
The breakout is confirmed only when the candle closes outside the formation.
This mode is more conservative and can help reduce sensitivity to intrabar spikes and temporary liquidity sweeps.
Breakout Candle Size Filter
An optional breakout-strength filter can require the breakout candle to be larger than the recent average candle range.
For example:
Breakout Range ≥ Average Range × 1.20
This feature can help filter weak or marginal breaks of the formation boundary.
ATR Volatility Filter
Small candles can optionally be excluded from Wick Sequence calculations.
Example:
Candle Range ≥ ATR × Minimum Multiplier
This prevents very small candles from creating formations during low-volatility market conditions.
Professional Dashboard
Pressure Breakout includes a dedicated dashboard in the upper-left corner of the chart.
The dashboard is divided into three sections.
INFORMATION
Displays important real-time information including:
- Current Symbol
- Current Timeframe
- Formation Status
- Formation Price Range
- Buy / Sell Pressure
- Last Signal
- Signal Price
- Signal Time
- Breakout Confirmation Mode
- Current ATR
- Wick Sequence Settings
- ATR Range Filter
Example:
Symbol: XAUUSD | TF: M15
Formation: ACTIVE
Volume Proxy: BUY 63.5% | SELL 36.5%
Last Signal: BUY @ 4350.20
Breakout: CLOSE confirmation
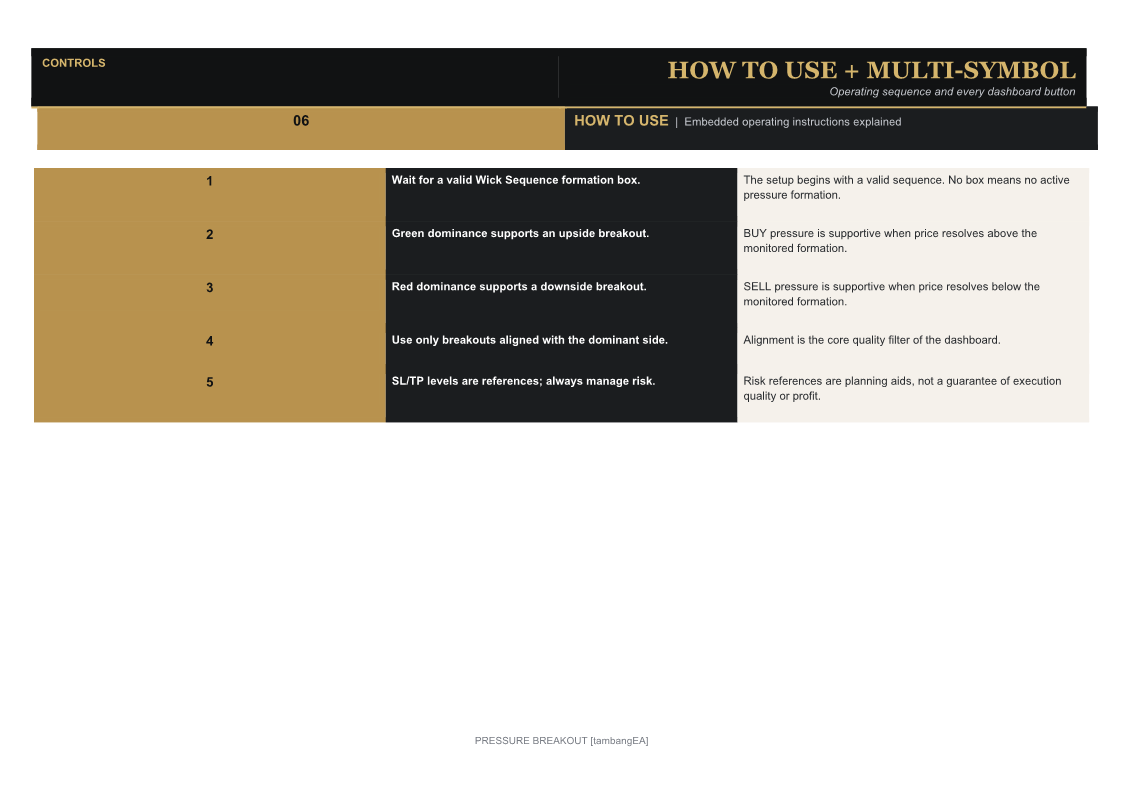
HOW TO USE
A short operating guide is integrated directly into the dashboard:
- Wait for a valid Wick Sequence formation box.
- Green dominance supports an upside breakout.
- Red dominance supports a downside breakout.
- Use breakouts aligned with the dominant side.
- Use SL/TP levels as risk-management references.
This makes the indicator easier to operate without continuously opening the parameter window.
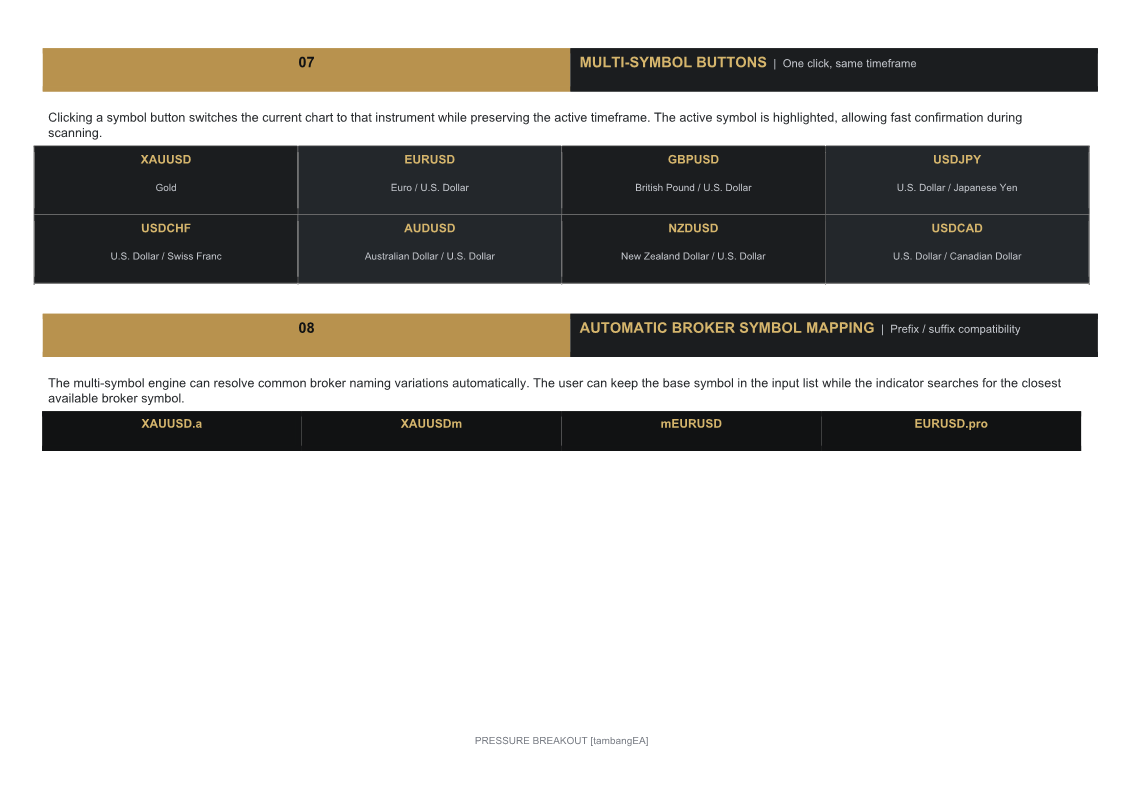
Interactive Multi-Symbol Dashboard
The indicator includes clickable symbol buttons.
Default symbols include:
- XAUUSD
- EURUSD
- GBPUSD
- USDJPY
- USDCHF
- AUDUSD
- NZDUSD
- USDCAD
Clicking a button automatically changes the current chart to the selected instrument while keeping the active timeframe.
This provides a fast workflow for scanning several markets using the same Pressure Breakout methodology.
Automatic Broker Prefix / Suffix Detection
Pressure Breakout automatically searches for broker-specific symbol naming formats.
You can configure the base symbol:
XAUUSD
and the indicator can automatically recognize variations such as:
- XAUUSD
- XAUUSD.a
- XAUUSDm
- XAUUSD.pro
- mXAUUSD
The same logic applies to Forex symbols.
For example, using:
EURUSD
the indicator can detect:
- EURUSD
- EURUSDm
- EURUSD.pro
- mEURUSD
- mEURUSD.pro
This allows the same indicator configuration to work across many brokers without manually editing every symbol button.
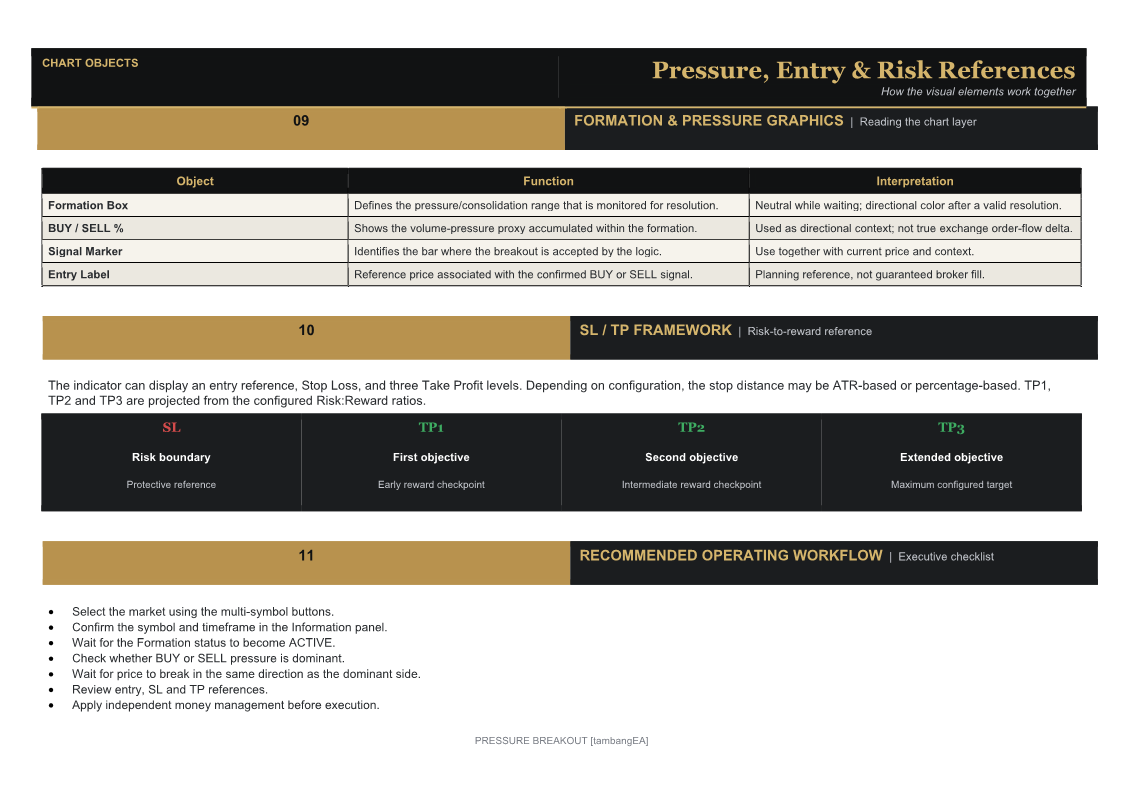
Entry, Stop Loss and Take Profit Levels
When a valid signal appears, Pressure Breakout can display a complete visual trade framework.
The indicator can show:
- BUY / SELL Entry
- Stop Loss
- TP1
- TP2
- TP3
- Risk Area
- Reward Area
ATR-Based Stop Loss
The Stop Loss can be calculated using ATR:
Risk Distance = ATR × SL Multiplier
Example:
ATR × 1.5
Percentage-Based Stop Loss
Alternatively, the Stop Loss can be calculated as a percentage of the signal entry price.
Risk:Reward Targets
Take Profit levels are calculated from the initial risk.
Example default structure:
- TP1 = 1R
- TP2 = 2R
- TP3 = 3R
This provides a clear visual framework for evaluating potential reward relative to risk.
Main Input Groups
Pressure Breakout provides organized settings for:
Candle & Signal Settings
- Minimum Wick Candles
- Formation Window Size
- Minimum Upper Wick %
- Maximum Lower Wick %
- Minimum Lower Wick %
- Maximum Upper Wick %
- Breakout Waiting Limit
- Breakout by Close / High-Low
Signal Filters
- ATR Minimum Range Filter
- ATR Period
- Breakout Candle Size Filter
- Average Candle Size Period
- Bullish Signal Enable
- Bearish Signal Enable
- Invalid Breakout Handling
Visualization
- Wick Highlighting
- Bullish Color
- Bearish Color
- Neutral Color
- Volume Bars
- Buy/Sell Percentage Label
TP / SL
- ATR or Percentage Stop Loss
- ATR Period
- SL Multiplier
- SL Percentage
- TP1 Risk:Reward
- TP2 Risk:Reward
- TP3 Risk:Reward
Dashboard & Multi-Symbol
- Panel Visibility
- Panel Position
- Symbol List
- Button Columns
Typical Workflow
A practical workflow can be:
1. Formation
Wait until the indicator identifies a valid Wick Sequence.
2. Pressure
Observe which side is dominant inside the formation.
3. Breakout
Wait for price to exit the formation.
4. Confirmation
Prefer breakout direction that agrees with the dominant pressure side.
5. Risk Evaluation
Review Entry, SL, TP1, TP2 and TP3.
6. Execution
Apply your own position sizing, risk limits and market-context analysis before entering a trade.
Suitable Markets
Pressure Breakout is designed for chart-based analysis and can be used on instruments such as:
- Gold / XAUUSD
- Major Forex pairs
- Minor Forex pairs
- Indices
- CFDs
- Other instruments supported by MetaTrader where sufficient price and volume data are available.
The optimal parameters may differ between symbols and timeframes.
Suggested Timeframes
The indicator can operate across multiple timeframes.
For active trading:
M5 – M15 – M30
For broader intraday or swing analysis:
H1 – H4
Parameter optimization should always be performed according to the instrument, timeframe and trading style being used.
What Makes Pressure Breakout Different?
Pressure Breakout does not rely on a single breakout condition.
Its analysis combines:
**Wick Geometry
- Repeated Rejection
- Formation Range
- Volume Pressure
- Breakout Direction
- Volatility
- Risk:Reward Framework**
The objective is to identify structured breakouts supported by context, rather than displaying every price movement beyond a simple support or resistance level.
Visual Logic
REJECTION
↓
PRESSURE FORMATION
↓
BUY / SELL DOMINANCE
↓
BREAKOUT
↓
BUY / SELL SIGNAL
↓
SL + TP1 + TP2 + TP3
Important Notes
Pressure Breakout is an indicator, not an Expert Advisor.
It does not automatically open or close trades.
The Entry, Stop Loss and Take Profit levels are visual analytical references.
The Buy/Sell percentages are internal directional pressure estimates and should not be interpreted as centralized exchange order-flow data.
Historical performance does not guarantee future results.
Trading Forex, Gold, CFDs and other leveraged instruments involves substantial risk. Always use appropriate money management and test the indicator thoroughly before using it in live trading.
PRESSURE BREAKOUT [tambangEA]
Rejection → Formation → Volume → Breakout



