Neue technische Indikatoren für den MetaTrader 5 - 20
Erschließen Sie den Präzisionshandel: Das ATR Dynamic Pivot System Laden Sie diesen kostenlosen Indikator für ATR-Pivot-Signale herunter und verschaffen Sie sich sofort einen Vorteil gegenüber dem Marktrauschen. Dies ist das ultimative Werkzeug für Händler, die auf der Grundlage echter Marktumschwünge - und nicht auf der Grundlage von Vermutungen - überzeugende Einstiegspunkte suchen. Das ATR Pivot Signals System ist ein innovativer technischer Indikator, der die Average True Range (ATR) nutzt,
FREE
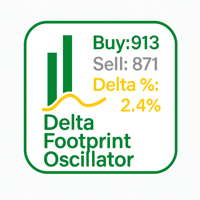
Delta Footprint Oscillator – Professionelles Order-Flow-Werkzeug für MT5 Der Delta Footprint Oscillator ist ein leistungsstarkes Order-Flow-Indikator, das die tatsächliche Kauf-/Verkaufsaktivität direkt im Chart sichtbar macht.
Er verfolgt jede Tick-Bewegung des Mid-Preises und berechnet in Echtzeit Delta , Delta% sowie eine vollständige Footprint-Historie pro Kerze .
Ideal für Scalper, Daytrader und Trader, die ein klares Bild über Marktaggression benötigen. Hauptfunktionen Echtes Order-Flow-

Gamma & Volatility Levels Pro [XAUUSD Edition] - Der Indikator, der von professionellen Goldhändlern im Jahr 2025 verwendet wird Vollautomatischer Indikator, der ausschließlich für den XAUUSD (Gold) entwickelt wurde. Zeigt in Echtzeit die stärksten institutionellen Levels an, die den Goldpreis jeden Tag bewegen: - HVL (High Volatility Level) - Orange gestrichelte Linie Dynamisches Niveau der extremen Volatilität (20-Perioden-SMA + 1 Standardabweichung). Gold prallt an diesem Niveau ab oder durch
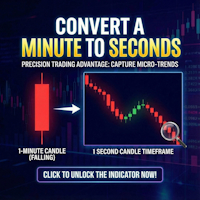
Second Timeframe Pro - Sehen Sie den Markt vor allen anderen!
Erschließen Sie eine verborgene Ebene der Preisaktion
Während andere Händler die Kerzen im Minutentakt betrachten, können Sie 60 Kerzen in jeder Minute sehen!
Was ist Second Timeframe Pro?
Es ist ein revolutionärer Indikator, der vollwertige Candlestick-Charts mit zweiten Zeitrahmen direkt im MetaTrader 5 erstellt.
Der Standard-MT5 beschränkt Sie auf einen Minutenchart. Aber der Markt hält nicht jede Minute an - er pulsiert jede
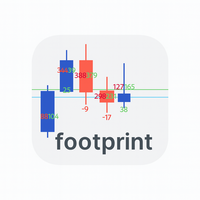
Footprint_Indicator_Fixed ist ein leichtes, aber sehr leistungsstarkes Footprint-Tool für Trader, die tiefere Einsicht in die Markt-Mikrostruktur suchen.
Der Indikator zeigt Buy/Sell-Tick-Zähler sowie den Delta-Wert direkt auf jeder Kerze an – so erkennen Sie sofort, welche Marktseite dominiert. Hauptfunktionen ️ Tick-basierte Buy/Sell-Volumenerfassung in Echtzeit ️ Delta-Footprint unter jeder Kerze ️ Saubere, übersichtliche Darstellung ohne Indikatorpuffer ️ Automatische Verwaltung historis

SUP – Tool zur Erkennung von Support- und Resistance-Zonen
Das SUP-Tool ist ein professionelles Analysewerkzeug, das automatisch Support- und Resistance-Preiszonen auf jedem Marktchart erkennt und hervorhebt. Mit seiner fortschrittlichen Zonen-Analyse markiert es die stärksten Preisbereiche, an denen der Markt typischerweise reagiert — ideal zur Identifikation von Einstiegen, Umkehrpunkten, Breakouts und Risikozonen.
Zusätzlich zur automatischen Erkennung bietet das Tool die Möglichkeit, eige
Mystic Pulse V2.0 ist ein Trendstärkeindikator, der auf dem Directional Movement System (DI+ / DI-) basiert. Er zählt, wie viele aufeinanderfolgende Kerzen eine zunehmende bullische oder bearische Dynamik aufweisen. Eine steigende DI+ erzeugt einen positiven Zähler (Aufwärtsdruck), während eine steigende DI- einen negativen Zähler (Abwärtsdruck) erzeugt. Diese Zählungen werden zurückgesetzt, wenn das Momentum nachlässt, was eine klare visuelle Darstellung der Trendbeständigkeit und möglicher Umk
FREE
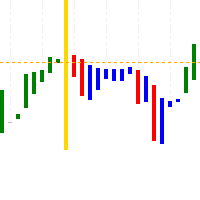
L3 Banker Fund Flow Trend Oscillator v5 ist eine einfache Übersetzung der Arbeit von blackcat aus dem Pine-Skript (Sprache der TradingView-Plattform) in mql5. Er generiert Kauf- und Verkaufssignale, wenn sich zwei berechnete Puffer im überverkauften und überkauften Bereich des Oszillators überkreuzen. Die aktuelle Version bietet keine veränderbaren Eingaben, kann aber in der modifizierten Version leicht hinzugefügt werden, wenn dies gewünscht wird.

Volatilitätsdurchbruch-Signale Beschreibung:
Volatility Break Signals ist ein Indikator, der entwickelt wurde, um potenzielle Trendwechsel zu erkennen und gleichzeitig das Marktrauschen teilweise zu filtern. Er verwendet ein adaptives Volatilitätsmaß auf der Grundlage des ausgewählten Preises (Close, Open, High, Low, etc.) und generiert Kauf- und Verkaufssignale , wenn der Preis eine Umkehrung gegenüber der vorherigen Richtung zeigt. Wie es funktioniert: Messung der Preisvolatilität Der Indikat
FREE
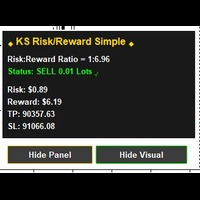
RR Ratio KS Simple Calculator-Indikator Übersicht Der RR Ratio KS Simple Calculator Indicator ist ein kostenloses, leichtgewichtiges Tool für MetaTrader 5, das automatisch Risiko-Ertrags-Verhältnisse (RR) auf Ihrem Chart visualisiert. Er wurde für manuelle Händler und automatisierte Systeme (EAs) entwickelt und erkennt offene Positionen mit definierten Stop-Loss (SL)- und Take-Profit (TP)-Levels und überlagert dann klare visuelle Zonen, um potenzielle Risiko- und Gewinnbereiche, einschließlich g
FREE

Der Indikator ist stabil auf Lärm Schwankungen im Preis und reagiert schnell auf den Trend. Er basiert auf einem Algorithmus aus einem System hyperbolischer Funktionen, der eine aggressive Glättung des Flats mit minimaler Verzögerung auf den Trend ermöglicht. Er kann direkt auf das Preisdiagramm, auf sich selbst oder auf andere Indikatoren angewendet werden, um falsche Signale zu eliminieren. Der Hauptzweck des Indikators besteht darin, kleine sägezahnförmige Kursbewegungen so weit wie möglich z
RSI Bollinger DualStrike Signals bietet einen klaren und strukturierten Ansatz zur Identifizierung von Bereichen, die für eine potenzielle Trendumkehr günstig sein könnten. Durch die Kombination des RSI mit den Bollinger Bändern hebt der Indikator Momente hervor, in denen der Preis Anzeichen von Druck oder Schwungverlust zeigt. Die KAUF-/VERKAUFssignale helfen Händlern, besser organisierte und diszipliniertere Entscheidungen zu treffen. Er ist ein nützliches Instrument für Scalping, Daytrading o
FREE

STRAT Price Action Scanner - Sehen Sie das Setup, bestimmen Sie das Risiko, platzieren Sie den Handel. Wichtig
Um Trades direkt vom Handelsassistenten aus zu platzieren, müssen Sie auch den STRAT Price Action Trade Manager EA (siehe Kommentarbereich) auf demselben Terminal installieren. Der Indikator sendet die Handelsanweisungen; der EA ist die Komponente, die die Aufträge tatsächlich platziert und verwaltet. Installationsanweisung (bitte lesen) Anleitung zur STRAT-Handelsstrategie Warum STR
FREE

Global Session 4X Indikator Global Session 4X ist ein visueller Indikator, der aktive Devisenhandelssitzungen auf der ganzen Welt in Echtzeit anzeigt. Er wurde mit Präzision und unter Berücksichtigung der Marktvielfalt entwickelt und deckt Finanzzentren wie London, New York, Tokio, Sydney, São Paulo, Istanbul, Riad, Toronto und andere ab. Jede Sitzung wird als farbkodiertes Band angezeigt, das die am meisten gehandelten Währungspaare in der jeweiligen Region hervorhebt. Das Layout ist übersichtl
FREE
ZigZag-Reversal-Detektor-Signale Dies ist ein technischer Indikator, der auf dem ZigZag-Prinzip basiert und entwickelt wurde, um automatisch Marktumkehrpunkte zu erkennen und klare Kauf- und Verkaufssignale zu erzeugen. Anpassbare Parameter ️: Level : Bestimmt die Empfindlichkeit des ZigZag auf Preisänderungen. Ecart : Legt den Mindestabstand zwischen zwei ZigZag-Punkten fest . Rebond : Passt die Bestätigungsschwelle für eine Umkehrung an . Alerts & Notifications : Aktivieren oder
FREE
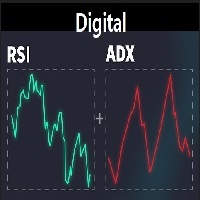
Ein leichtgewichtiger digitaler Indikator, der die wichtigsten Momentum-Tools direkt auf dem Chart kombiniert. Er zeigt die Echtzeitwerte von RSI, ADX, +DI, -DI und DI Spread in einem klaren und kompakten Format an, ohne irgendwelche Linien oder grafischen Objekte auf dem Chart zu zeichnen. Entwickelt, um einen schnellen Einblick in die Trendstärke und das Gleichgewicht zwischen Käufern und Verkäufern zu geben, ohne dass Sie zusätzliche Indikatorfenster öffnen müssen. Vollständig anpassbar - Sch
FREE

INDIKATOR FÜR LIQUIDITÄTSSCHWÜNGE - MT5 Fortgeschrittenes Smart Money Konzept Tool
ÜBERBLICK
Der Liquidity Sweeps Indicator ist ein professionelles MT5-Tool, das entwickelt wurde, um institutionelle Liquiditätseinbrüche und Stop-Hunt-Muster zu erkennen. Basierend ICT (Inner Circle
FREE

Trading Sessions von Mahefa R ist ein Indikator für MetaTrader 5, der die vier wichtigsten Handelssitzungen visuell identifiziert: New York, London, Tokio und Sydney . Der Indikator wurde entwickelt, um eine saubere, intuitive und professionelle Marktansicht zu bieten. Er hebt die aktivsten Perioden des Forex-Marktes hervor, indem er eine intelligente Visualisierung der Sitzungsbereiche , sitzungsspezifische Kerzenfarben und tägliche Trennlinien verwendet. Hauptmerkmale: Automatische Erkennung
FREE

Metatrader 5 Version des bekannten MT4 Indikators "Currency Slope Strength". Dieses Tool wurde entwickelt, um die Stärke der wichtigsten globalen Währungen in Echtzeit visuell zu messen und so Trendwährungen, Umkehrungen und Cross-Currency-Gelegenheiten zu identifizieren. Währungen: AUD, CAD, CHF, EUR, GBP, JPY, NZD und USD.
Level-Crossing-Warnungen (Pop-up, Push, E-Mail). Anpassbare Zeitrahmen (Haupt- und Extrazeitrahmen). Anpassbare Farben. Nicht wiederholend . Der Indikator läuft im Strategy

Instant Pitchfork wurde für Händler entwickelt, die sich auf schnelle und präzise Pitchfork-Trendstrukturen verlassen, um Einstiege, Stopps und Ziele zu planen. Klicken Sie auf einen Anker im Chart und Instant Pitchfork zeichnet automatisch die am besten passende Andrews' Pitchfork für die aktuelle Marktstruktur.
Klicken Sie erneut auf den Anker, um sofort zwischen den Modi Andrews', Schiff und Modified Schiff Pitchfork zu wechseln, um die beste strukturelle Anpassung in Sekundenschnelle zu fin
BOS und CHoCH Detector ist ein Indikator, der entwickelt wurde, um BOS (Break of Structure) und CHoCH (Change of Character) innerhalb der Smart Money Management Strategie zu erkennen. Er hilft Händlern, eine klarere Sicht auf den Markt im Chart zu bekommen und ihre Handelsstrategie zu optimieren. Ein weiterer Vorteil dieses Indikators ist sein Farbsystem: Grün : signalisiert eine hohe Wahrscheinlichkeit für eine Kaufgelegenheit . Rot : signalisiert eine hohe Wahrscheinlichkeit für eine Verkaufsg

Übersicht Market Volume Profile Modes ist ein leistungsstarker MT5-Volumenverteilungsindikator, der mehrere Volumenprofilvarianten integriert. Benutzer können durch eine einfache Menüauswahl zwischen verschiedenen Analysemodi wechseln. Dieser Indikator hilft Händlern, wichtige Kursniveaus, Unterstützungs- und Widerstandszonen sowie die Verteilung des Marktvolumens zu identifizieren.
Kernkonzepte - POC (Point of Control): Das Preisniveau mit der höchsten Volumenkonzentration, das den vom Markt
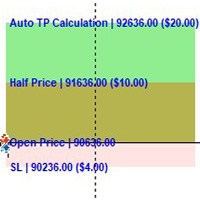
Visueller RR Ratio KS-Rechner Mit dem RR Rat io KS Visual Calculator, einem eleganten, professionellen MetaTrader 5-Indikator, der TP/SL-Berechnungen automatisiert und kristallklare visuelle Setups direkt auf Ihrem Chart anzeigt, sind Sie in der Lage, mühelos Risiko und Ertrag zu meistern. Keine mühsamen manuellen Berechnungen oder Rechenfehler mehr: Er berechnet sofort präzise Dollarbeträge auf der Grundlage Ihrer Losgröße und Positionsrichtung (Kauf/Verkauf) und zeigt interaktive Linien für TP
VOLUMIZED ORDER BLOCKS [Riz] - MT5 Indikator Smart Money Orderblock-Erkennung mit Volumenanalyse
Volumized Order Blocks ist ein fortschrittlicher Smart Money Concepts (SMC) Indikator, der automatisch institutionelle Orderblöcke mit integrierter Volumenanalyse erkennt. Er identifiziert Angebots- und Nachfragezonen mit hoher Wahrscheinlichkeit, in denen Banken und Institu
FREE
Volumized OrderBlocks MTF - Multi-Timeframe Volumetric Order Block Indicator
ÜBERBLICK
Volumized OrderBlocks MTF ist ein fortschrittlicher Multi-Timeframe-Orderblock-Indikator, der automatisch Orderblöcke aus bis zu 3 verschiedenen Zeitrahmen in einem einzigen Chart erkennt, anzeigt und zusammenführt. Dieser Indikator basiert auf der in
FREE
Produktname: Kombinierter KD Enhanced Multi-Signal Stochastik Indikator Hauptvorteile : - **Signale auf einen Blick**: Rote (Kauf) / grüne (Verkauf) Pfeile + Doppelkurven; automatisch markierte 20/80 überkaufte/überverkaufte Zonen - keine komplexe Mathematik erforderlich. - **All-Market Fit**: Standard KD(9,3,3); anpassbare Einstellungen funktionieren für Aktien/Forex/Futures (jeder MT5-Zeitrahmen: M1-MN1). - **Lag-Free Performance**: 20% schneller als die offizielle MT5 Stochastik - reibung

HolyGrail M N/B : Alle unsere Produktkauf kommt mit unserem kostenlosen ''DAILY SCALPER EA'' - bit .ly/4qlFLNh Whatsapp Entwickler für Ihre nach erfolgreichem Kauf
most wanted Edition Übersicht ACHTUNG AN ALLE TRADER!
ENDLICH ENTHÜLLT: Der "HolyGrail MostWanted" Indikator - Ihr All-in-One Institutional Trading Dashboard für MetaTrader 5
SPEZIAL BONUS (GÜLTIG BIS JUNI 2026)- UNSER TÄGLICHER SCALPER EA für BTCUSD und VIX75 -------------------------------------------------------------------
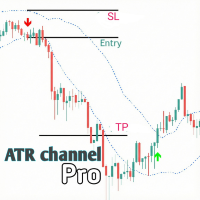
Dies ist ein Indikator namens ATR Channel. Dieser Indikator wird mit ATR und VWMA (Volume Weighted Moving Average) erstellt. Dieser Indikator funktioniert am besten in einem volatilen Markt. Versuchen Sie also, während hochvolatiler Sitzungen und hochvolatiler Paare zu handeln.
Regeln:
- Paare: Bitcoin, Gold, Nasdaq (US100) oder S&P (US500) Handeln Sie keine Forex-Paare, da sie eine geringe Volatilität aufweisen.
Sitzung: Nur US-Sitzung (insbesondere nach Schließung der ersten 15-Minuten-Kerz
Der MT5-Indikator Trenddauerprognose wurde entwickelt, um die wahrscheinliche Dauer eines Aufwärts- oder Abwärtstrends abzuschätzen. Unter Verwendung eines gleitenden Hull-Durchschnitts (HMA) zur Erkennung von Richtungsänderungen verfolgt er die Dauer jedes historischen Trends und berechnet einen Durchschnitt, um vorherzusagen, wie lange der aktuelle Trend statistisch gesehen wahrscheinlich anhalten wird. Dadurch können Händler sowohl die Trendstärke in Echtzeit als auch potenzielle Erschöpfung

Stoppen Sie Margin Calls. Beginnen Sie den Handel mit einer klaren SOP. Erhalten Sie immer wieder Margin Calls?
Haben Sie immer noch keinen Indikator oder keine Technik gefunden, die eine konstante tägliche Performance liefert?
Sind Sie es leid, Geld einzuzahlen und zu hoffen, dass Sie es endlich abheben können? Machen Sie sich keine Sorgen - ich bin ein echter Vollzeit-Trader . Dies ist derselbe Entry-Box-Indikator , den ich persönlich verwende, zusammen mit einer Schritt-für-Schritt-SOP , dam

Dynamische Marktbeobachtung & Zeitrahmen Dashboard (MT5 Indikator ) 1. Produktübersicht Das Dynamic Market Watch & Timeframe Dashboard ist ein professionelles Chart-Navigationsprogramm, das für MetaTrader 5 entwickelt wurde. Es verwandelt die statische "Market Watch"-Liste in ein interaktives Kontrollpanel auf dem Chart. Dieser Indikator ist auf Effizienz ausgelegt und erstellt ein übersichtliches, vertikales Kachelsystem, das es Händlern ermöglicht, mit einem einzigen Mausklick sofort zwischen
FREE
Volumenanzeige-Indikator - Saubere und leistungsfähige Volumenvisualisierung Dieser professionelle MT5-Indikator zeigt das Tick-Volumen als farbkodiertes Histogramm an und fügt automatisch klare Volumenbeschriftungen über jedem Balken für den aktuellen Handelstag hinzu. Steigende Kerzen werden blau, fallende Kerzen rot eingefärbt, so dass Sie einen sofortigen Einblick in die Marktstärke und das Momentum erhalten. Hauptmerkmale: Farbiges Volumen-Histogramm (blau/rot) Automatische Volumenbeschrift
Verwandeln Sie Ihren Chart in ein professionelles Trading-Dashboard, das anzeigt, wohin sich die Kurse bewegen und wann der nächste Schock kommt - ohne ein einziges zusätzliches Fenster zu laden. Dieser Indikator kombiniert ein preisverfolgendes MA-Band mit einem Live-Nachrichtenradar direkt auf dem Chart, so dass Sie auf einen Blick sowohl Trend- als auch Ereignisrisiken erkennen können. Trend Ribbon - Lesen Sie die Markttendenz sofort Ein sanftes, stufenförmiges Band mit gleitendem Durchschnit

Dieser Indikator hilft Händlern, Inside Bars schnell zu erkennen, die in Preisaktionshandelsstrategien häufig als potenzielle Konsolidierungs- oder Fortsetzungsmuster verwendet werden. Bei einer Inside Bar-Formation handelt es sich um eine Kerze, die auf beiden Seiten einem Gegentrend entgegenläuft, da sie das Hoch oder Tief der vorherigen Kerze nicht durchbrochen hat.
Hauptmerkmal: Identifizieren Sie innere Balken in Echtzeit. Einfärbung der inneren Balken unter Beibehaltung der normalen Balk
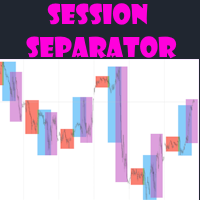
Der Session-Separator-Indikator zeichnet Kästchen für jede Handelssitzung, um dem Trader die Eröffnungs- und Schlussstunden mit ihren Höchst- und Tiefstwerten anzuzeigen.
Hauptmerkmale: Option zur Einstellung von Stunden und Farben für 3 Handelssitzungen. Die Kästchen werden sofort aktualisiert, wenn der Höchst-/Tiefststand überschritten wird. Stundenverschiebung oder automatische Zeitzone. Wählen Sie die Anzahl der Tage, an denen die Boxen gezeichnet werden sollen. Der Indikator funktioniert
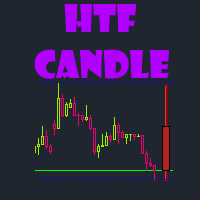
HTF Candle hilft Händlern, indem es ausgewählte Kerzen mit höherem Zeitrahmen auf Ihrem offenen Chart zeichnet.
Auf diese Weise ist es einfacher, Ihren Bias zu verwalten, ohne dass Sie den Zeitrahmen wechseln müssen, was Zeit kostet. Hauptmerkmale: Wählen Sie den höheren Zeitrahmen aus, von dem Daten abgerufen werden sollen. Geben Sie die Anzahl der zu zeichnenden Kerzen ein Personalisieren Sie die Farben der gezeichneten Kerzen Optionale horizontale Linien für Hoch und Tief Funktioniert mit jed
FRAMA Matrix Pro ist ein mehrschichtiges Trend- und Momentum-Intelligence-Panel, das für Trader entwickelt wurde, die Klarheit, Präzision und Bestätigung verlangen, bevor sie in den Markt einsteigen.
Das System kombiniert mehrere fortschrittliche Filter in einem übersichtlichen, informativen Dashboard: FRAMA Trend Engine (schnelle adaptive Trenderkennung) Doppelte EMA-Bias-Struktur (20 & 200) ADX-Stärke-Filter RSI Direktionale Verzerrung Force Index Volumen-Kurs-Power ATR-Kerzenstruktur-Analyse
SuperTrend Pro MT5 - Das ultimative Trendfolgesystem
Schöpfen Sie das volle Potenzial des SuperTrend-Indikators auf MetaTrader 5 aus. Entwickelt für ernsthafte Trader, die Präzision und Leistung benötigen. SuperTrend Pro MT5 ist ein Handelssystem der nächsten Generation, das für den modernen Trader entwickelt wurde. Es kombiniert die bewährte Zuverlässigkeit des klassischen SuperTrend mit fortschrittlicher Multi-Timeframe (MTF)-Analyse und Smart Filtering , um Ihnen die wahrscheinlichsten Setu
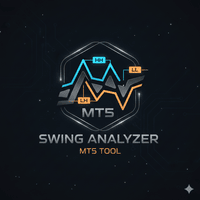
Dies ist SMC Regeln basierte Swing-Struktur-Tool, das Ihnen helfen, die Swing-Punkte zu analysieren und bleiben Sie up-to-date über die Marktstruktur in Echtzeit für Teig Handel Entscheidungen über den Kauf verkaufen seine einfach zu bedienen und große Sache ist, dass Sie nicht brauchen, um jede manuelle Zeichnung für diese wird es automatisch analysiert das Diagramm wichtigsten Swing-Punkte und Druck-Etiketten auf sie zu wissen, die genaue Ebene und über sie mit einem winzigen Punkt seine bulli

Der Indikator zeigt Gleichgewichtskurven auf der Grundlage der magischen Zahl für die Portfolioanalyse. Er ermöglicht eine visuelle Einschätzung der Leistung verschiedener Strategien für ein einzelnes Symbol. Jede der magischen Zahlen kann durch Anklicken des Wertes in der Legende ausgeblendet werden. Parameter: HideAllOnStart - alle magischen Zahlen werden ausgeblendet und können durch Anklicken ihres Wertes aktiviert werden; MAMode - zeigt den durchschnittlichen Gewinn aus den Trades; MAPeriod

Überlagern Sie Kerzen mit höherem Zeitrahmen mit Kerzen mit niedrigerem Zeitrahmen sowohl für den Live-Handel als auch für Backtests, um zu sehen, wie Kerzen mit höherem Zeitrahmen mit Kerzen mit niedrigerem Zeitrahmen gebildet werden. Hilft Händlern, die Multi-Timeframe-Ausrichtung zwischen den Timeframes in jedem Moment zu sehen, um einen verfeinerten Einstieg in die Marktstruktur zu finden. Gibt dem Händler einen vollständigen Überblick über den Preis in allen Zeitrahmen, indem er nur einen Z

Wesentliche Merkmale Visuelle Risiko/Ertrags-Planung Erzeugt interaktive Rechtecke auf dem Chart für Kauf- und Verkaufs-Setups. Rosa Box: Stellt Ihr Risiko dar (Einstieg bis Stop Loss). Grüne Box: Stellt Ihren Gewinn dar (Einstieg bis Take Profit). Die grüne Box passt ihre Größe automatisch an das von Ihnen bevorzugte Reward-Verhältnis an (z. B. 1:2). Auto-Lot-Berechnung Berechnet automatisch die korrekte Losgröße auf der Grundlage Ihres Kontostands und des festgelegten Risikoprozentsatzes. Berü
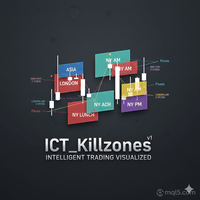
ICT-Killzonen Professional Automatisieren Sie Ihre ICT- und Smart Money-Analyse mit präziser, dynamischer Sitzungsverfolgung und Liquiditätspivots. Produkt-Beschreibung ICT Killzones Professional ist das ultimative Session-Management-Tool, das speziell für Händler entwickelt wurde, die Inner Circle Trader (ICT), Smart Money Concepts (SMC) und liquiditätsbasierte Strategien nutzen. Dieser Indikator hebt automatisch die wichtigsten Handelssitzungen hervor - Asien, London, New York AM, Lunch und PM

Liquidity Channels Pro MT4 HERE ist ein hochentwickeltes Smart Money Concepts (SMC) Tool, das die Identifizierung von Buy Side Liquidity (BSL) und Sell Side Liquidity (SSL) automatisiert . Im Gegensatz zu standardmäßigen Unterstützungs- und Widerstandsindikatoren zeichnet dieses Tool nicht einfach nur Linien, sondern projiziert dynamische, sich ausdehnende Kanäle auf der Grundlage der Volatilität (ATR) von wichtigen Pivot-Punkten. Entscheidend ist, dass es der von institutionellen Händlern verwe
N/B : Alle unsere Produktkäufe kommen mit unserem kostenlosen ''DAILY SCALPER EA'' - bit .ly/4qlFLNh Whatsapp Entwickler für Ihre nach erfolgreichem Kauf
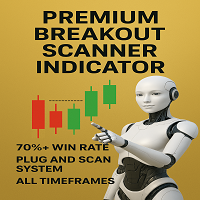
Premium Breakout Scanner Indikator: Ihr institutionelles Breakout-Handelssystem der Spitzenklasse
ENTDECKEN SIE HOCHWAHRSCHEINLICHE AUSBRÜCHE, BEVOR SIE PASSIEREN
DIES IST EINE VIER-KERZEN-BREAKOUT-STRATEGIE/EIN SYSTEM MIT 70%+ GENAUIGKEIT.
Sind Sie es leid, Ausbruchsbewegungen zu verpassen? Zu spät einzusteigen? Durch falsche Ausbrüche au

Order Blocks SMT ist nicht "nur ein weiterer Indikator".
Es ist das Tool, mit dem Sie den institutionellen Auftragsfluss lesen und Entscheidungen mit derselben Logik treffen können, die von Banken und Fonds verwendet wird - direkt im MetaTrader 5 (MT5) . Was dieser MT5 Order Blocks Indikator für Sie tut Mit Order Blocks SMT (ein fortschrittlicher Smart Money / ICT Order Blocks Indikator für MT5) können Sie: Hören Sie auf, Angebot und Nachfrage zu erraten und beginnen Sie mit dem Handel auf klare

Produktübersicht:
Extreme Confirmation ist ein hochentwickelter Oszillator, der Marktgeräusche herausfiltert und eine klare, visuelle Bestätigung der Trendrichtung und potenzieller Umkehrpunkte liefert. Durch die Kombination einer Zwei-Perioden-Momentum-Analyse mit einer dynamischen Signalwolke hilft dieser Indikator Händlern, Einstiegs- und Ausstiegsbereiche mit hoher Wahrscheinlichkeit zu identifizieren. Hauptmerkmale: Dual-Line-Crossover: Verwendet eine Berechnung der schnellen (13) und lang

VWAP WAVE [Riz] - MT5-Indikator Fortgeschrittenes VWAP-Divergenz-Erkennungssystem
VWAP Wave ist ein professioneller volumengewichteter Durchschnittspreisindikator mit integriertem Divergenzerkennungssystem. Er identifiziert hochwahrscheinliche Umkehr- und Fortsetzungssignale durch die Analyse der Preis-VWAP-Beziehungen über mehrere Zeitrahmen.
FREE
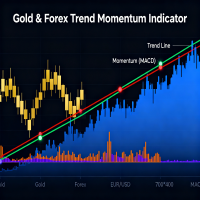
Übersicht QuantumEdge Oscillator ist ein professioneller Handelsindikator, der fortschrittliche Momentum-Analyse mit hochentwickelten Algorithmen zur Trenderkennung kombiniert. Diese 30-tägige Testversion bietet vollen Zugriff auf alle Funktionen und ermöglicht es Ihnen, seine Fähigkeiten unter Live-Marktbedingungen gründlich zu testen, bevor Sie eine Kaufentscheidung treffen. Hauptmerkmale Zwei-Signal-System : Kombiniert den gleitenden RSI-Durchschnitt mit geglätteten ATR-basierten Volatilitäts
FREE

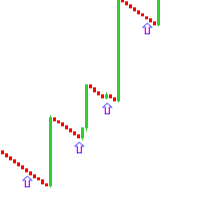
Das Point and Fignure (P&F)-Diagramm stellt den Kurs gegen Richtungsänderungen dar, indem es eine Spalte mit Xs bei steigenden Kursen und eine Spalte mit Os bei fallenden Kursen aufzeichnet.
Merkmale Unterstützung für mehrere Preistypen - Hoch/Tief und Schlusskurs. Übersichtliches und leicht zu lesendes Diagramm. Zeigt die Höchst- und Tiefstkurse der Säulen als Indikatorwerte an. Unterstützung von 4- und 5-stelligen Brokern. Anpassbare Farben.
Vorteile Filtert unbedeutende Kursbewegungen und R

Smash FX System - Inside-Bar Breakouts, Umkehrungen und Fortsetzungen (Indikator) Tagline: Smash the noise, catch the clear moves - hochklare Inside-Bar-Breakout-, Reversal- und Continuation-Pfeile, die für saubere Eingaben und professionelles Journaling entwickelt wurden. Kurz-Promo Smash FX System zeigt hochwahrscheinliche Inside-Bar-Ausbrüche, intelligente Umkehrungen und Fortsetzungs-Setups mit Pfeilen auf dem Chart und exakten Levels an - entwickelt für Trader, die klare, wiederholbare Setu
Session Range Pro - Professionelle Session- und ADR-Analyse für MetaTrader 5 Sehen Sie, was den Markt wirklich bewegt - nach Session, nach Tag, mit Statistiken, die wirklich von Bedeutung sind. Was ist Session Range Pro? Session Range Pro ist ein professioneller MetaTrader 5-Indikator , der das wahre Kursverhalten während der drei wichtigsten Handelssitzungen aufzeigt: Asien London New York Er zeichnet saubere, farbkodierte Session-Ranges direkt auf Ihr Diagramm und versorgt sie mit umfangreiche
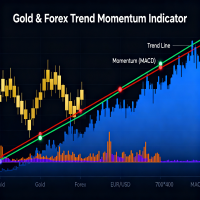
Überblick Der QuantumEdge Oscillator ist das ultimative Momentum- und Trend-Erkennungsinstrument für ernsthafte Trader. Nach umfangreichen Tests und Verfeinerungen liefert dieser professionelle Indikator zuverlässige Signale für alle Marktbedingungen und Zeitrahmen. Er wird von diskretionären Händlern und algorithmischen Systemen weltweit eingesetzt. Fortschrittlicher Algorithmus Der Indikator verwendet einen hochentwickelten zweischichtigen Ansatz: Primäre Engine : Exponentieller gleitender Dur
BITTE KONTAKTIEREN SIE MICH, WENN SIE DAS PRODUKT KAUFEN, SO DASS ICH IHNEN DIE RICHTIGEN PARAMETER GEBEN KANN.
Dieser Handelsindikator arbeitet auf synthetischen Indexpaaren; Boom 1000, Boom 900, Boom 600, Crash 1000, Crash 900, Crash 600 , im Zeitrahmen von M1 und dieser Indikator ist genauer mit Indikator und um es zu bekommen, können Sie mich kontaktieren 0967713191 Ich werde Ihnen zwei Indikatoren für den Kauf dieses Indikators geben. Dieser Indikator wird verwendet, um Spitzen zu jagen u

VISUAL THEME SWITCHER PRO v3.2
Professioneller Chart-Themenwechsler für MetaTrader 5 mit erweiterten Funktionen und mehrsprachiger Unterstützung.
HAUPTMERKMALE: - 9 Professionell gestaltete Themes - Drag & Drop Panel Schnittstelle - Mehrsprachige Unterstützung (5 Sprachen) - 7-Tage-Testversion mit allen Funktionen - Umschalten zwischen Vollbildmodus - Automatisch generierte Themen-Buttons - Professionelles Sicherheitssystem - Wiederherstellung der Position - Ein-Klick-Theme-Anwendung

Schnelle Multi-Timeframe-Pivots - Präzisionslevels von M1 bis W1 - Ultraschnelle Pivot-Erkennung von M1 bis W1
- Saubere, stabile Architektur ohne Repaint
- Perfekt für Breakout-, Trend- und Reversal-Strategien
- Automatische farbkodierte Levels für sofortige Klarheit
- Funktioniert bei allen Assets: Forex, Kryptowährungen, Metalle, Indizes
- Leichtes Design - ideal für den realen und den Prop-Firm-Handel Schnelle Multi-Timeframe Pivots (M1 bis W1) Ein leistungsstarker Pivot-Indikator, der für p

MercariaPattern1-2-3 verfolgt die Kursbewegung, erkennt dreibeinige 1-2-3 Strukturen und hebt den Moment hervor, in dem das Szenario durch einen Ausbruch aus einem wichtigen Niveau bestätigt wird. MercariaPattern1-2-3 verfolgt die Kursbewegung, erkennt dreibeinige 1-2-3-Strukturen und hebt den Moment hervor, in dem das Szenario durch einen Ausbruch aus einem wichtigen Niveau bestätigt wird. Der Indikator kombiniert lokale Ausschläge zu einer kompakten 0-1-2-3 Figur, erkennt dreibeinige 1-2-3 Str

[ Mein Kanal ] , [ Meine Produkte ] Der Lorentzian Distance Classifier ist ein auf maschinellem Lernen basierender Trading-Indikator, der die Lorentz-Distanz als zentrale Metrik innerhalb des Approximate-Nearest-Neighbors-(ANN)-Frameworks verwendet. Anstatt sich auf die traditionelle euklidische Distanz zu stützen, behandelt er die Finanzpreisbewegung so, als würde sie in einem „verzerrten“ Preis-Zeit-Raum stattfinden (ähnlich wie massive Objekte in der Relativitätstheorie die Raumzeit krümmen).

Automatisierte Elliott-Wellen-Theorie 1. Automatische Wellenzählung & Reduzierte Subjektivität Normalerweise beinhaltet das Zählen von Elliott-Wellen viel "Fantasie" oder persönliche Meinung. Dieser Indikator hilft durch: Finden von Impulswellen (1-2-3-4-5): Verwendet strenge Regeln (z.B. Welle 3 darf nicht die kürzeste sein), um die theoretisch korrekte Preisstruktur anzuzeigen. Finden von Korrekturwellen (A-B-C): Hilft, Rücksetzer zu erkennen, um Einstiegsmöglichkeiten im Trend zu finden. 2. A
KLICKEN SIE HIER FÜR ALLE MEINE KOSTENLOSEN PRODUKTE
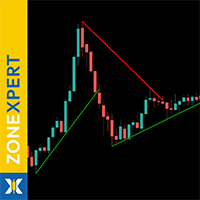
ZoneXpert ist dein visueller Marktanalyst für MetaTrader 5 – entwickelt, um Support- und Resistance-Zonen automatisch zu erkennen , farblich zu markieren und in Echtzeit zu aktualisieren. Der Indikator analysiert Preisstrukturen, Hochs, Tiefs und Volumenbereiche, um dir präzise zu zeigen, wo der Markt reagiert – und wo er durchbricht. Mit ZoneXpert erkennst du auf einen Blick, wo sich Marktkräfte sammeln – und handelst dort, wo echte Entsch
FREE
KLICKEN SIE HIER FÜR ALLE MEINE KOSTENLOSEN PRODUKTE
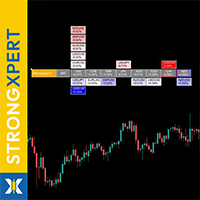
StrongXpert ist dein präziser Echtzeit-Strength-Monitor für den globalen Devisenmarkt. Er wurde entwickelt, um dir zu zeigen, wo Kapital tatsächlich hinfließt – und wo es den Markt verlässt. Der Indikator misst die relative Stärke aller Hauptwährungen (USD, EUR, GBP, JPY, AUD, CAD, CHF, NZD) und verwandelt komplexe Preisbewegungen in ein einfach lesbares, visuelles Dashboard – direkt im Chart. Erkenne die stärkste und schwächste Währung in
FREE

Market Time Watch Uma ferramenta leve, limpa e essencial para todo trader Market Time Watch é um mostrador de tempo profissional no gráfico, projetado para traders que precisam ver com precisão a hora local, a hora do servidor e a contagem regressiva da vela atual. Tudo isso diretamente no gráfico, sem painéis pesados ou elementos desnecessários. Se você faz scalping, day trade, opera notícias ou apenas precisa de uma referência clara de tempo, Market Time Watch oferece tudo de forma minimalista
FREE

Smart Risk Manager Pro – Drag & Trade mit Vertrauen Smart Risk Manager Pro ist ein professionelles On-Chart-Risikomanagement-Tool, das deine Positionsgröße basierend auf deinem Dollar-Risiko berechnet. Einfach auf dem Chart klicken und ziehen , und der Indikator zeigt sofort: Richtung (Buy / Sell) Distanz in Punkten Empfohlene Lotgröße basierend auf deinem RiskUSD-Wert Das Tool ist ultra-leichter, extrem schneller Code und wurde für Trader entwickelt, die einen sauberen Chart und einen präzisen,

King Smart Liquidity MT5 ist ein fortschrittlicher analytischer Indikator, der speziell dazu entwickelt wurde, institutionelle Geldflüsse und Großbanken auf Forex, Gold, Indizes, Bitcoin und anderen Märkten zu verfolgen. Dieser Indikator wurde auf der Grundlage der "Smart Money Concept"-Methodik entwickelt, die auf dem Verständnis von Price Action, Liquiditätszonen und dem Marktverhalten großer Finanzinstitute basiert. Der Indikator zeichnet nicht nur einfach Linien oder Zonen, sondern bietet e
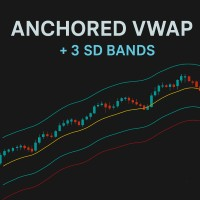
Anchored VWAP (AVWAP) mit Standardabweichungsbändern – MT5 Steigern Sie die Präzision Ihres Tradings mit AVWAP, erweitert durch dynamische Standardabweichungsbänder . Entwickelt für Trader, die Schnelligkeit, Klarheit und umsetzbare Marktinformationen verlangen, bietet dieser Indikator professionelle VWAP-Analyse direkt auf Ihren MT5-Charts und hilft Ihnen, Schlüsselbereiche und hochwahrscheinliche Setups sofort zu erkennen. Hauptfunktionen Mehrere Anker: Fügen Sie beliebig viele AVWAP-Linien hi
FREE
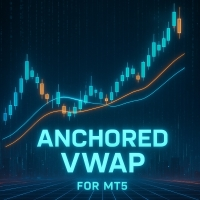
Anchored VWAP (AVWAP) für MT5 Bringen Sie Ihre Chartanalyse mit Anchored VWAP für MT5 auf die nächste Stufe – ein leistungsstarkes und flexibles Tool für Trader, die präzise, schnelle und klare Schlüsselpreislevels benötigen. Dieser Indikator bietet institutionelles VWAP-Analyse-Feeling, ähnlich der Funktionalität auf TradingView, aber vollständig für MT5 optimiert. Hauptfunktionen Mehrere Anker pro Chart: Fügen Sie beliebig viele AVWAP-Linien hinzu, jede mit eigenem Startdatum und -zeit. Anpass
FREE

NeoBull Predictive Ranges ist ein umfassendes technisches Analysesystem für den MetaTrader 5. Der Indikator kombiniert fortschrittliche Volatilitätsberechnungen mit einer volumenbasierten Trendanalyse. Das Ziel dieses Systems ist es, Tradern präzise Informationen über die Marktstruktur und den Orderflow zu liefern, ohne das Chartbild zu überladen. Dieses professionelle Werkzeug wird der Community kostenlos zur Verfügung gestellt. Konzept und Hintergrund Die strategische Grundlage und die Kombina
FREE

Signalindikator für Binäroptionen, der auch auf dem Forex-Markt und anderen Märkten effektiv eingesetzt wird. Er eignet sich für kurzfristiges Grid-Trading auf M1–M5 und enthält Signale zum schrittweisen Positionsaufbau. Der Indikator verwendet eine zweistufige Anpassung: ein grundlegendes Geschwindigkeitsprofil (Einstellung „schnell/gleichmäßig“ von Beginn an) und eine Auto-Adaptation basierend auf den Handelsergebnissen, die die Filter an den aktuellen Markt anpasst und dabei Serien von Gewin
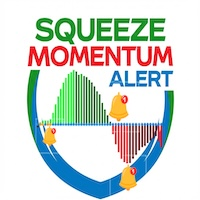
Squeeze Momentum Alert 1. Identifiziert "Explosionspunkte" des Preises (The "Squeeze") Der größte Vorteil ist die Fähigkeit, Phasen der "Konsolidierung" zu erkennen, bevor eine massive Bewegung stattfindet. Warum es gut ist: Der Markt wechselt zwischen Ruhe und Volatilität. Dieses Tool sagt Ihnen: "Der Chart zieht sich zusammen, machen Sie sich bereit für den Ausbruch" , damit Sie den Beginn eines großen Trends nicht verpassen. 2. Unterscheidet die Trendstärke im Detail (Color Coded Momentum) Da
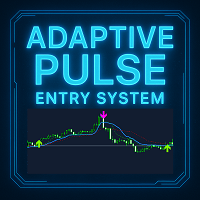
Adaptive Pulse - Professionelles Trading-Signal-System Kurzbeschreibung Adaptive Pulse ist ein professioneller Trading-Signal-Indikator, der auf adaptiver Marktanalyse-Technologie basiert. Der Indikator passt sich automatisch an die Volatilität an und generiert präzise Kauf- und Verkaufssignale mit visuellen Pfeilen auf dem Chart. Er funktioniert auf allen Zeitrahmen und Finanzinstrumenten. Hauptfunktionen Der Indikator bietet ein dreistufiges Analysesystem mit drei unabhängigen adaptiven Linien
Erfahren Sie, wie man einen Handelsroboter im MetaTrader AppStore, dem Shop für Applikationen für die MetaTrader Handelsplattform, kaufen kann.
Das Zahlungssystem der MQL5.community ermöglicht Zahlungen mit PayPal, Kreditkarten und den gängigen Zahlungssystemen. Wir empfehlen Ihnen eindringlich, Handelsroboter vor dem Kauf zu testen, um eine bessere Vorstellung von dem Produkt zu bekommen.
Sie verpassen Handelsmöglichkeiten:
- Freie Handelsapplikationen
- Über 8.000 Signale zum Kopieren
- Wirtschaftsnachrichten für die Lage an den Finanzmärkte
Registrierung
Einloggen
Wenn Sie kein Benutzerkonto haben, registrieren Sie sich
Erlauben Sie die Verwendung von Cookies, um sich auf der Website MQL5.com anzumelden.
Bitte aktivieren Sie die notwendige Einstellung in Ihrem Browser, da Sie sich sonst nicht einloggen können.