 MetaTrader 5
 专家
专家
 指标
指标
 程序库
程序库
 实用工具
实用工具
 窗口小部件
窗口小部件
 规则
规则
适用于MetaTrader 5的新技术指标 - 20
 技术指标的信号外汇和股票市场的开仓交易和平仓交易起着至关重要的作用。指标的本质就是一种交易品种的数学转换,旨在预测未来的价格变化。
测试技术指标可以更有利于预测市场行为并从中获利。
技术指标的信号外汇和股票市场的开仓交易和平仓交易起着至关重要的作用。指标的本质就是一种交易品种的数学转换,旨在预测未来的价格变化。
测试技术指标可以更有利于预测市场行为并从中获利。 
ModGod Scalp Pullback - Precision Trend & Reversion Engine
LAUNCH PROMOTION: Only $49 for the first 10 copies! The official price will be $490. Buy before the price goes up!
The ModGod Scalp Pullback is an advanced, all-in-one indicator designed for professional scalpers and day traders. It combines the extreme smoothness of Triangular Moving Averages (TMA) with Heikin-Ashi trend filtering to provide highly accurate pullback entries and extreme exhaustion reversals. By mapping the natu

Zone Levels MTF
Zone Levels MTF draws support and resistance zones from two timeframes on one chart and shows complete trade levels for each timeframe: Entry, Stop Loss, TP1, TP2 and TP3.
MAIN FEATURES - Two timeframes on one chart (default M5 and M15). Each timeframe can be enabled or disabled. - Reversal zones: zones where the market changed direction. Up to 5 zones per side are kept on the chart until price closes through them. Older zones are shown with lighter colors. - Broken zone: the

Aura Breaker Block – automatic ICT breaker block indicator for MetaTrader 5.
Aura Breaker Block detects bullish and bearish breaker blocks the way Smart Money Concepts (SMC) and ICT traders define them, and draws them as clean neon zones directly on your chart. No more drawing zones by hand – the indicator finds the liquidity sweep, the market structure shift and the breaker candle for you.
WHAT IS A BREAKER BLOCK? A breaker block is a failed order block. Price sweeps liquidity (a lower low o

PRISM Multi-Deviation Bands for MT5 is a chart-analysis indicator for MetaTrader 5 that displays three exact rolling high/low price ranges directly on the active chart. The indicator is designed for traders who want a clear visual reference for recent price structure without adding multiple lagging studies or cluttering the chart. PRISM calculates the highest high and lowest low across three related lookback windows and draws those boundaries as visible chart levels. The default configuration us

HTF 3-Candle System for MetaTrader 5 The HTF 3-Candle System is an advanced multi-timeframe structural analysis indicator for MetaTrader 5. Adapted from institutional price-action methodologies (ICT/SMC), this tool dynamically breaks down higher timeframe price sequences (C1, C2, and C3) to evaluate market structure, identify high-probability setup patterns, and score potential trade setups in real time. Instead of relying on lagging indicators, the HTF 3-Candle System scores market conditions u

Market Path Forecast [BOSWaves] Market Path Forecast [BOSWaves] is an advanced predictive technical analysis indicator that combines market structure detection, statistical swing modeling, and dynamic target projection. It dynamically calculates future price paths and key target levels based on recent historical swing metrics and average true range (ATR) volatility.
MT5 Expert Advisor Collection Explore automated systems built for Gold & Bitcoin , covering breakout, scalping, momentum and multi-

Eazy Divergence is a non-repainting MT5 indicator designed to automatically detect and plot Regular and Hidden divergence signals in real time
Key Features Dual-Window Plotting: Displays divergence trendlines and text badges directly on both the main price chart and the RSI subwindow. 100% Non-Repainting: Uses left/right pivot strength confirmation so signals stay fixed once drawn. Full Multi-Timeframe Support: Adapts instantly to whatever chart timeframe you are viewing. Fully Customizable: Eas

Golden Flow Pro is an indicator for Gold (XAUUSD) on MetaTrader 5. It was built by a Gold trader to answer two questions on every chart: where are the stops sitting, and is there a real setup right now?
What it draws
- Liquidity lines: levels above equal highs and below equal lows, where stop losses and pending orders tend to build up. Price often reaches for these before the real move.
- Breaker zones: drawn from the body of the candle that breaks market structure.
- Fair value gaps: the stan

Session Statistics marks three trading sessions and the day's opening range on an intraday chart, and then measures what actually happened after each of those levels was broken, on the history of the chart you have it on.
What it draws
Three session ranges and the day's opening range, as outlines, for the most recent days. The session hours are yours to set in server time, and a range may cross midnight.
What it measures
For every range, on both sides, over the lookback you choose:
- how m

Z-Score Range Boxes Breakout Z-Score Range Boxes Breakout is a statistical price-action indicator designed to identify potential reversal zones and subsequent breakouts using a smoothed Z-Score of price. The indicator calculates how far the current price has moved from its recent mean relative to its standard deviation. When the smoothed Z-Score reaches statistically extreme levels, the indicator automatically creates a range box around the price action.
MT5 Expert Advisor Collection Explore aut

Lookahead Safe RSI Divergence Detector
Most RSI divergence indicators mark a pivot the moment it looks like a swing high or low, so the last signal on the chart can silently shift or disappear as new bars form. This indicator only confirms a pivot after the number of bars set in Pivot Confirm Lag have genuinely closed, so a confirmed signal never repaints or moves.
What it detects Bearish divergence: price forms a Higher High while RSI forms a Lower High. Bullish divergence: price forms a Low

Fahmi Volume Profile Dashboard combines a session volume profile, value-area signals with stop loss and three targets, a multi-timeframe trend matrix and a built-in statistics lab that measures how the signals performed on your own chart history , so you can judge the edge before you trade it. Volume profile Session volume profile built from M1 tick volume, drawn in two colors (buying / selling volume) POC, VAH and VAL of the developing session, value area highlighted Previous session POC, VAH a

Overlay up to two other symbols on your chart as lines or candles, with a compact mini-window showing range and % change for today and two custom periods.
Symbol Compare Overlay draws up to two other symbols directly on the current chart, so you can see how gold, indices, currencies or any other instrument move against each other without switching windows.
Main features - Up to two compare symbols, each shown as a line or as candles. - Two overlay modes: - Fit to visible range: each symbol

A volume-at-price heatmap with POC, value area, estimated buy/sell pressure, confirmed signals and alerts.
POC Volume Profile Heatmap is a MetaTrader 5 indicator that organizes historical volume across price levels. It identifies the Point of Control, displays the selected value area, and estimates buying and selling pressure at the POC.
The indicator is intended for traders who use volume-at-price structure to study acceptance, rejection and interaction around high-activity price levels. It c
FREE

What Gets Drawn Most level tools mark every swing they can find, and a chart with forty lines answers nothing. This one keeps a level only when price came back to it, and prints the evidence next to the line: the number of touches and the age in days. Lines above current price and lines below it are drawn in different colours, so the map reads at a glance without counting. What Puts A Level On The Chart A swing high is a bar whose high is not lower than its neighbours on both sides, within the n
FREE

TRENDORA — Currency Strength, Trend & Signal Intelligence for MT5 Trendora is a multi-currency, multi-timeframe market analysis and signal indicator for MetaTrader 5. Instead of looking at a single chart in isolation, Trendora analyzes the broader Forex environment through its Currency Strength Engine , evaluates trend conditions across multiple timeframes, monitors the current pair's activity, and combines this information with its signal engine in one clear visual workspace. The objective is s

Three Anchors On One Chart Most volume weighted average lines restart once a day. This one draws three at the same time: one anchored to the current trading session, one to the day, one to the week. Their spread tells you something a single line cannot. When the session line sits far under the weekly one, the week has been trading higher than today is; when all three sit together, the market has spent the week in one place. Why The Session Anchor Is Not Midnight The session line starts where the
FREE

Multi-timeframe trend and reversal indicator with closed-candle arrows, ATR trend bands, EMA, ADX and RSI confirmation, dashboard and alerts.
Overview
MultiTrend Sentinel is a MetaTrader 5 chart indicator for monitoring trend
direction and potential changes in direction. It combines an ATR-based trend
line with optional EMA and ADX filters, then checks two selectable confirmation
timeframes using EMA direction and optional RSI confirmation.
Signal arrows are confirmed on completed candles. Th
FREE

Nick Rypock Pro— Auto Optimization & Trend Analysis Nick Rypock Pro is an advanced trend-analysis indicator designed for traders who use Nick Rypock price analysis and want an adaptive way to evaluate market direction and potential trade levels. Instead of relying on a fixed configuration, the indicator includes a genetic auto-optimization system that searches through different parameter combinations and evaluates their historical performance according to the selected optimization criterion. Th

QCL Clouds is an adaptive market-regime indicator designed to present trend direction, momentum transitions, and dynamic price zones in a clean and easy-to-read format. Instead of displaying multiple overlapping lines, the indicator combines its calculations into one color-changing signal line, crossover dots, and a projected market cloud. HOW TO READ QCL CLOUDS • Blue Signal Line
Indicates that bullish conditions are currently dominant. • Orange Signal Line
Indicates that bearish conditions are

XAUUSD Ultimate Trading Suite
Welcome to the XAUUSD Ultimate Trading Suite, a professional, precision-engineered technical indicator designed exclusively for gold (XAUUSD) traders who want to treat trading as a disciplined professional investment mission rather than guesswork.
Built around clear market structure and absolute trend clarity, this suite provides instant institutional-grade alignment to help you capture high-probability market moves with confidence.
Key Features & Indicat

AureonFX XAUUSD Precision Entry Assistant AureonFX XAUUSD Precision Entry Assistant is a multi-factor MT5 indicator designed specifically for Gold / XAUUSD traders who want a clearer view of market direction, entry quality, volatility, liquidity, and potential trade zones. Instead of relying on a single signal, the indicator combines DXY pressure, multi-timeframe trend analysis, momentum, volatility, structure, liquidity, support/resistance, and entry-zone detection into one easy-to-read dashbo

Breakout Trap Detector is Designed and tested for XAUUSD (gold) on the M1 chart and BTCUSD (bitcoin) on the M15 chart.
Breakout Trap Detector shows two kinds of signals on your chart: a normal breakout signal, and a reversal signal when that breakout fails and the market turns the other way.
How it works
1) The setup The indicator watches the market with several built-in filters. When conditions line up, it marks a reference candle and draws a white line at its high (for a buy) or its low (

SMT Divergence Multi Pair compares the swing highs and swing lows of the chart symbol with up to two correlated symbols and marks where they disagree. This is the Smart Money Technique (SMT) divergence used in ICT and Smart Money Concepts trading: one market sweeps a previous high or low while its correlated market fails to confirm the move. Discount Ends Soon — Next Price: $99 HOW IT WORKS The indicator finds confirmed swing highs and lows on the chart symbol and compares each new swing with th

Full Description Read Gold’s Complete Picture in One Single Panel Stop switching between M5, M15, H1, H4, and D1 charts. XAU Confluence Matrix Free brings multi-timeframe analysis straight to your main chart in a clean, real-time table. Powered by the quantitative XAU_Engine , this indicator scans 5 timeframes simultaneously on closed candles to give you an accurate directional bias before entering any trade. What You See on Your Screen 5 Timeframes at a Glance: Automatically displays your curre
FREE

SignalArrows - Trading Signal Indicator SignalArrows is a MetaTrader 5 indicator designed to identify potential BUY and SELL signal conditions using moving-average crossover logic with additional confirmation filters. The indicator processes a signal through several stages before plotting an arrow on the chart: How It Works 1. Raw MA Cross Detection
The indicator first detects a crossover between the fast and slow moving averages. 2. Gap Confirmation
After a crossover, the indicator checks whe

The advantage most indicators ignore: Intermarket data.
Almost every market indicator does the exact same thing: it takes historical price data from the chart, applies a mathematical formula (a moving average, a momentum calculation, a channel), and displays it in a different color. The problem is that price in isolation tells only half the story.
If you trade Gold (XAUUSD), you know it doesn't move in a vacuum. It moves in a constant dance with the US Dollar. The true institutional edge lies

This indicator marks the candles where price runs through a liquidity level and turns back. It finds and ranks the levels by itself, so there is nothing to draw by hand. It is made for manual trading on any symbol and timeframe. What you see on the chart A buy or sell arrow on the candle that confirms the reversal. Arrows appear only after that candle has closed, and they do not repaint. For every signal: the level that was swept, a stop level and two target levels. A label with the type of leve

MT5 双顶、双底和头肩形态指标,带入场、止损和目标价位 这款 MT5 指标在已收盘的K线上识别 反转图表形态 : 双顶 和 双底 (double top、double bottom,即 M 形和 W 形), 头肩顶 和 头肩底 (head and shoulders、inverse head and shoulders)。每个形态都会变成标注在图表上的三个价格:颈线突破处的入场价、止损价和测量目标价。形态在形成过程中就会显示,在K线收盘时确认,每笔交易从触发它的K线一直保留到触及出场的K线。面板显示当前形态、其价位、最近一笔交易以及形态和交易的历史记录,并在确认时发出提醒。 附带使用指南:在 MQL5 聊天中发消息索取。 图表上显示的内容 ENTRY BUY 或 ENTRY SELL 及其价格,位于颈线上。标签还会显示 WAIT(尚未发生任何事),或在K线收于其外后显示 CONFIRMED。 STOP 和 TARGET ,各自带有价格和所属形态的编号,多个形态永远不会混淆。 交易区域 :从触发交易的K线开始,入场价与止损价之间为红色区域,入场价与目标价之间为绿色区域,绘制在K线后方。

RelicusRoad Signal Line 是适用于 MetaTrader 4 和 MetaTrader 5 的趋势过滤指标,绘制两条移动平均线,并依据所选的策略过滤器,把每根线段染成绿色、鲑鱼色或灰色。 线条本身显示均线所在的位置,颜色则显示所选过滤器对该 K 线的判断。默认情况下,Line 1 是以 momentum 着色的快速 KAMA 9,Line 2 是以 Ichimoku 着色的慢速 Hull 移动平均 200。 工作原理 每条线都根据设定的均线类型与周期,以收盘价计算得出,下方始终绘制着一条灰色底线。在所选过滤器判断为向上的 K 线上,会在其上绘制绿色线段;判断为向下的 K 线上,线段则为浅鲑鱼色。过滤器无法判断时,灰色底线保持可见。每条线都有自己独立的均线设置与过滤器。 Momentum:上一根已收盘 K 线 5 周期 momentum,与两根 K 线之前的数值比较。 Ichimoku:Tenkan 高于 Kijun,且上一根收盘价高于云层两条边界时为绿色,相反情形为鲑鱼色。 MACD:12、26、9 参数下的主线高于或低于其信号线。 ParabolicSAR:K
FREE

RelicusRoad SuperTrend 是适用于 MetaTrader 4 和 MetaTrader 5 的 SuperTrend 指标,在上升趋势中于价格下方、在下降趋势中于价格上方绘制一条基于 ATR 的跟踪线。 这是经典的 SuperTrend 算法,没有附加任何其他内容:上升一条线,下降一条线,没有箭头、标签或面板。 工作原理 对每一根 K 线,指标取中位价,即该 K 线最高价与最低价的中点,并在其上下方各设定若干个平均真实波幅(ATR)单位的通道带。当收盘价高于上一根 K 线的上轨时,趋势转为上升;当收盘价低于上一根 K 线的下轨时,趋势转为下降。在这两个事件之间,趋势方向不会改变。 Uptrend:下轨以上升颜色(默认绿色)绘制在价格下方。 Downtrend:上轨以下降颜色(默认金黄色)绘制在价格上方。 Flip:当前活跃的线结束,留出一根 K 线的空白,另一侧的线随之开始。 No neutral state:每一根被计算的 K 线都属于上升或下降一侧,没有中性状态。 SuperTrend 线只会顺着趋势移动。在上升趋势中,下轨可以上升但不会下降,因此它会在价格后方
FREE

RelicusRoad Daily High Low 是适用于 MetaTrader 4 和 MetaTrader 5 的前一日高低点指标,在日内图表的每根 K 线上标出昨日的最高价、最低价与今日的开盘价。 这三条价位以彩色点状线绘制,在新周期开始时跳转到新数值,并在每个周期末尾带有小小的 High、Low 与 Open 标签。在 H1 至 H4 的图表上,同样的标记改为显示上周的区间与本周的开盘价,在 D1 上则显示对应的月度数值。 工作原理 对图表上的每根 K 线,指标都会找出包含它的参考周期。High 与 Low 标记取自上一个周期的最高价与最低价,Open 标记取自该 K 线所属周期的开盘价。参考周期默认跟随图表周期,除非自行选择。 Below H1:日参考:前一日的最高价、最低价,以及当日开盘价。 H1 to H4:周参考:上周的最高价、最低价,以及本周开盘价。 D1:月参考:上月的最高价、最低价,以及本月开盘价。 W1 与 MN1:这些图表上不绘制任何内容。 周期边界跟随经纪商的服务器时间,与平台自身的日线、周线和月线保持一致,没有时区偏移参数。标记在每根新 K 线开盘时重
FREE

RelicusRoad Daily Pivots 是适用于 MetaTrader 4 和 MetaTrader 5 的日内枢轴价位指标,将前一日区间划分为斐波那契价位,并向上下两侧延伸,范围从负 100% 到正 200%。 指标不采用经典的地板枢轴公式,而是把前一个已完成的区间当作一把刻度尺,最低价为 0%,最高价为 100%。图表右侧以紧凑的彩色标记打印出十九个价位,因此今日行情的大小可以直接读作昨日区间的分数或倍数。 工作原理 指标取前一个已完成参考周期的最高价与最低价,并在该区间的每个比例处放置一个价位:价位 = 最低价 + 比例 x(最高价 − 最低价)。周末的 K 线会被跳过,因此周一的参考是上一个交易日。参考周期由图表周期决定。 Inside set, gray:0%、23.6%、38.2%、50.0%、61.8%、78.6% 与 100%。 Above set, green:+123.6%、+138.2%、+150.0%、+161.8%、+178.6% 与 +200%。 Below set, red:-23.6%、-38.2%、-50.0%、-61.8%、-78.6% 与
FREE

RelicusRoad Fractals 是适用于 MetaTrader 4 和 MetaTrader 5 的分形指标,以两种强度标记摆动高低点:Fast 检验两侧各 7 根 K 线,Slow 检验两侧各 15 根 K 线。 两侧各 7 根 K 线的窗口已经能滤掉许多细小的波动,而 Slow 检验要求的窗口是它的两倍多,因此其较粗的箭头挑出的是在更宽范围内依然成立的摆动。两种强度同时显示,因此次要摆动与更大的摆动可以一眼分辨。 工作原理 当一根 K 线左侧窗口内没有更高的高点、右侧窗口内也没有更高或相等的高点时,这根 K 线即为高点分形。若出现相同价位,标记归属于较新的 K 线。低点分形的判定方式与此相反。检验以两个固定强度进行: Fast:高点或低点须在两侧各 7 根 K 线中脱颖而出。 Slow:高点或低点须在两侧各 15 根 K 线中脱颖而出。 由于检验需要右侧的 K 线存在,箭头只能在这些 K 线出现之后才会显示。最新可能出现的 Fast 箭头在 7 根 K 线之前,最新可能出现的 Slow 箭头在 15 根 K 线之前。每个 Slow 分形也必然通过 Fast 检验,因为 1
FREE

RelicusRoad Support Resistance 是适用于 MetaTrader 4 和 MetaTrader 5 的支撑阻力指标,依据分形摆动构建供需区域,并按强度与近期测试情况为每个区域评级。 指标在价格上下方各自保留一份简要的区域地图,每个区域都标注等级、宽度与近期测试次数。 工作原理 摆动高低点被归纳为价格区域,而不是单一线条。摆动是指其高点或低点在两侧各 7 根 K 线范围内都未被超越的 K 线,其中跨度更大的 15 根 K 线摆动,以及之后出现强烈反应的摆动,权重更高。这些加权摆动沿价格轴累加,密度最高且彼此分开的区域即成为分级区域。每个区域都有一个强度分,每次重复测试都会削弱该分数,区域之间至少保持平均真实波幅(ATR)的 0.75 倍距离,不会重叠。 Verified:在最近 100 根 K 线内被测试过,且仍然强劲。 Weak:在最近 100 根 K 线内被测试过,强度低于 Verified 等级。 Untested:最近 100 根 K 线内没有测试。 Turncoat、Possible 和 Broken:分别为已翻转、未确认和已失效的区域,仅在关闭 U

RelicusRoad Scalping Pivots 是适用于 MetaTrader 4 和 MetaTrader 5 的摆动点与斐波那契价位指标,在 60 根 K 线的回溯窗口内交替标记摆动高点与低点,并为最新摆动标注斐波那契回撤与延伸价位。 名称中的 pivots 指的正是这些摆动点,而不是 PP、R1、S1 这类经典地板枢轴点。在最新摆动旁边,指标会打印一列百分比标签,因此无需手工绘制斐波那契工具即可读取回撤与延伸价位。 工作原理 当某根 K 线的最高价是最近 Range 根 K 线(含自身)中的最高值时,该 K 线被标记为摆动高点。摆动低点以同样方式判定。这项检验只向回看,因此一根 K 线一旦成为目前为止的极值就会被标记。第二遍处理只保留每段上涨行情中最极端的高点,以及每段下跌行情中最极端的低点,因此标记会交替出现。两侧的命名如下: Bull:在配对的摆动低点之后形成的摆动高点,绘制为柠檬绿圆点。 Bear:在配对的摆动高点之后形成的摆动低点,绘制为洋红色圆点。 请注意命名方式:在本指标中,Bull 标记的是摆动高点,Bear 标记的是摆动低点,这与许多交易者习惯的用法相反。

RelicusRoad Dynamic Circles 是适用于 MetaTrader 4 和 MetaTrader 5 的摆动高低点指标,同时以三种回溯长度——9、60 与 156 根 K 线——用圆圈标记转折点。 小转折和大转折出现在同一张图表上,但外观不同。短区间的小圆点表示次要摆动,而较大的中区间与长区间圆环,只会出现在价格创下更长窗口内极值的位置。每个圆圈都可以带上一小段文字标签,例如 HH(60) 或 LL(156)。 工作原理 对每一根 K 线,指标都会检查其最高价是否是最近 N 根 K 线(含自身)中的最高值,如果是,该 K 线就会得到一个高点圆圈。低点的检验方式相同。这项检验只向回看,因此一根 K 线一旦成为目前为止的极值,就会立即被标记。同样的检验会针对三个区间各运行一次: Short range:默认 9 根 K 线,绘制为小圆点。 Medium range:默认 60 根 K 线,绘制为圆环。 Long range:默认 156 根 K 线,绘制为更大的圆环。 标记完成后,会有第二遍处理对结果进行精简。当连续出现多个高点圆圈、之间没有低点圆圈时,只保留其中最高的

Apollo Global Trends FX - 这是一个趋势指标,旨在预测任何货币对以及任何交易工具(包括金属、指数、股票、加密货币和其他交易工具)的市场趋势变动。该指标可用于任何时间范围。该指标适用于长期和短期交易。该指标可以作为主系统或指标的过滤器。该指标完美过滤市场噪音。该指标非常易于使用。你只需要跟随信号 该指示器提供所有类型的通知,包括发送到您的移动设备的通知。指标中没有设置。指标本身会根据您使用的图表进行调整,从而使交易尽可能简单和高效。 购买后,一定要写信给我! 我将与您分享使用该指标进行交易的建议。我还将免费为您提供一个指标,这将使交易更加有利可图和舒适。 感谢您的关注!祝您交易成功并盈利!

An ICT / SMC indicator for MetaTrader 5. It waits for a liquidity sweep of PDH or PDL, then a market structure shift back inside the range, and plots the trade. Full documentation: Complete User Guide Chart Timeframe : 5 MIN
Symbols : EURUSD How the model works The indicator marks the previous day high (PDH) and previous day low (PDL) from the completed daily candle, then waits for a liquidity grab: buy-side liquidity taken above PDH or sell-side liquidity taken below PDL. A stop hunt into the l

Ichimoku Nexus Pro 一目均衡表,将细田悟一的全部三大理论呈现在同一张图表上:五条线、波动论(I、V、N、P、Y、W 波)、价格论(N、V、E、NT 目标)和时间论(基本数值与对等数值的时间计数)。 另外还包含:不重绘的高周期云图、经过测算的迟行带(Chikou Span)、在基准线走平、云层过薄或价格处于云中时暂停交叉信号的震荡过滤器,以及读取"市场报价"中全部品种并按可靠度排序的扫描器。 多数一目均衡表工具只画五条线,再加一个面板和一个提醒。五条线只是一目均衡表的第一部分。细田悟一把这套系统建立在三大理论之上:行情的形态、应走的幅度,以及何时应当发生变化。Ichimoku Nexus Pro 三者全画。 五条线 转换线、基准线、云(先行带 A 与 B)和迟行带均在指标内部计算。策略测试器中的数值与实盘图表完全一致,没有断档,也没有空值。 周期预设: Traditional 9 / 26 / 52 / 26 Crypto 20 / 60 / 120 / 30 Doubled 18 / 52 / 104 / 26 Auto:加密货币品种用 Crypto,其余一律用 Tr
FREE

Order Block Scorecard 在您的图表上标记供给区与需求区,并为每一个区域记录来自您自己历史数据的三项数值:价格进入该区域的次数、其中有多少次被守住,以及此后价格走出的最远距离。 这三个数字描述的是您眼前这个品种与周期上已经发生的事情。它是过去行为的记录,不是预测。 区域规则 只有一条规则,完整写出,您可以在任何一根K线上用肉眼验证: 供给区 - 下跌前的最后一根阳线,且该下跌在允许的K线数量内走完所需距离 需求区 - 上涨前的最后一根阴线,条件相同 区域就是这根K线,取整根或仅取实体,由您选择。没有隐藏过滤,没有平滑处理。 每个区域的记录 从区域生成的那一刻起,指标沿历史向前推演并记录发生了什么: 测试次数 - 价格进入该区域的次数 守住次数 - 其中有多少次之后出现了足够大的离开走势 最佳 - 触及后价格从区域边界走出的最远距离 当一个区域结束时它会变灰:或者因为有K线收盘穿过了它的远端边界,或者因为它已被测试到您允许的次数上限。结束的区域仍留在图表上,因为失效的区域同样是记录的一部分。 大幅走势上的箭头 当一次触及之后出现了超过您设定阈值的走势,会从区域边界画出一
FREE

您的品种里,哪些正运行在买入上一次转折的那批人的平均价格之上,哪些刚刚失去了它。Anchored VWAP Scanner把锚定VWAP跑在多达二十八个品种和四个时间周期上,以偏差为单位发布一个无量纲的距离,让品种之间可以诚实地相互比较,并把图表留在面板下方以便入场。 每售出10份,价格上涨10美元。 Anchored VWAP Scanner是一个文件里的两个产品。第一个是画在您眼前图表上的Anchored VWAP本身:锚定均线、它的偏差带,以及换边处的箭头。 第二个产品是一块面板,它把同一套计算同时跑在一份品种清单和多个时间周期上。面板告诉您哪些品种出了信号、距今多久;下方的图表则显示是什么产生了这个信号,因此您不必再挂第二个指标就能按表格找到的结果行动。 看板 每个品种一行,每个扫描的时间周期一列,最多四列、最多二十八个品种。出厂状态下扫描十五个品种,一个设置即可提到二十八个。品种清单用逗号分隔填写,或者由面板取用市场报价窗口里的清单。经纪商的前缀和后缀会从您所在的图表上识别,也可以手工填写。出厂状态下面板扫描四个时间周期:M15、H1、H4和D1。 一个单元格读作 ^14b:

Currency Strength Anchor —— 会话自适应的相对强度指标,以日开盘、周开盘和月开盘为锚点。无重绘。 大多数强度指标在固定回溯期内比较不同品种。但随着交易日从一个交易时段进入下一个时段,这种比较的意义会发生变化:基于亚洲时段数据的排名在伦敦和纽约开盘后几乎没有参考价值。 Currency Strength Anchor 采用不同的参考方式。它将每个品种与三个固定锚点进行比较——日开盘、周开盘和月开盘——并根据你所处的交易时段自动调整计算范围。 上下文会自动在以下范围之间切换: 仅亚洲时段 亚洲 + 欧洲时段 亚洲 + 欧洲 + 美洲时段 仅美洲时段 所有数值均基于已完成的价格数据计算,不会重绘。 如何阅读 指标为图表上的每个组成部分绘制一条线,因此你始终是在比较两条线。 示例 1 —— 黄金。你会看到两条线,一条代表 XAU,一条代表 USD。如果 XAU 线高于 USD 线,说明黄金强于美元,你应寻找做多 XAUUSD 的机会。 示例 2 —— EURUSD。如果 EUR 线低于 USD 线,说明欧元弱于美元,你应寻找做空 EURUSD 的机会。 规则对所有品

FIBOWAVE
在七个时间周期上同时自动完成艾略特波浪计数,从月线图一直到 M5,并给出运行中调整浪的斐波那契回撤、第3浪、第5浪和C浪的斐波那契目标、计数失效的价位,以及第3浪或第5浪开始时的提醒。 手工数浪速度很慢,而且两位分析师很少能得出相同的计数。FIBOWAVE 按固定规则计数,每次的方式都相同,并把各浪、它们的子浪以及子浪的子浪标注在您的图表上。
计数从哪里开始
您不需要选择起点,也不需要设置任何参数。本指标从月线图开始逐级向下寻找市场最近一次显示出新一轮走势开端的位置,并从该位置开始计数。 在起始阶段,一段走势既可能是新趋势的第1浪,也可能是旧趋势的第2浪,在价格再次运行之前没有人能够确定。FIBOWAVE 会如实说明这一点:标签显示为 "1/2?",状态行会告诉您每种情况分别需要发生什么。一旦价格给出答案,标签就变为第1浪或第2浪,计数由此继续。若某段走势最终被确认为B浪,同样会重新标注。 高时间周期上尚未确定的浪不会中断分析。较低的时间周期会继续对该走势计数,状态行会说明它们采用的是哪一种解读。
从月线图逐级向下
每个时间周期的计数都一直延伸到最后一

Fixed Range VP MT5 固定范围成交量 profile (FRVP) 是一款专为 MetaTrader 5 设计的高性能机构级分析工具。它能够映射特定用户自定义时间段内的交易活动,揭示关键的高成交量和低成交量节点。与合并买卖数据的传统成交量 profile 不同,该指标将总 Tick 成交量拆分为独立的买入和卖出结构。这种划分让您能够直接在主图表窗口中清晰透明地观察订单流。 该指标采用超快速的 MT5 Canvas 库构建,可呈现流畅、无延迟的图形。它通过在后台处理复杂的结构化数据,绕过了标准的 MetaTrader 图表性能瓶颈,完全不会拖慢您的终端运行速度。 核心功能: 买入/卖出成交量拆分:通过独特的颜色编码子直方图,立即识别在特定价格水平上是买方还是卖方占据主导地位。 动态价值区 (VA) 引擎:自动计算并显示自定义百分比的价值区(默认 70%),即交易最密集的区域。 控制点 (POC) 追踪:清晰标记在您所选时间范围内成交量最集中的单一价格水平。 高性能 Canvas 渲染:使用直接画布内存映射绘制像素级完美的自定义形状。这确保 your MT5 工作区始终保
FREE

Crystal Trend Matrix Pro - Non-Repainting Trend Engine with TP1/TP2/TP3, Stop Loss and Multi-Market Scanners Catch the turn on a closed bar. Get the entry, the stop and three targets locked at the next open. See which timeframes and which markets agree, all from one chart. Finding the trend is the easy part. What costs traders money is everything around it: arrows that repaint after the fact, no clear stop, targets guessed by eye, weak signals traded with the same size as strong ones, and entrie

我的支撑位和阻力位——MT5的供需区域 大多数供需指标会让你的图表变得杂乱无章,然后假装这就是“分析”。
而这个指标不会。 我的支撑和阻力区域会自动绘制供需区域,然后根据实际市场行为对其进行排名,而不是根据矩形看起来是否美观。 你将获得什么 弱点 新区域(未经测试) 已确认区域 已验证区域 叛徒/破碎区(可选) 每个区域都有清晰的标签: 已确认卖出区域,回测次数=2;
新买入区域;
疲软卖出区域 无需猜测,无需像拼图一样解码颜色。 它是如何思考的 区域由分形结构和ATR扩展构成。
重叠区域会合并。微弱噪声可以被隐藏。强噪声则保持不变。 随着生长区域的发展,颜色会发生变化: 新 → 已确认 → 已证实 支持绿色家庭 抗性保持在红色/紫色家族 如果价格持续守住某个水平,指标就会显示出来。
如果价格不再守住,该区域就会被降级或失效。就这么简单。 专为真正关注图表的交易者而设计 适用于任何交易品种。
适用于任何时间周期。
包括XAUUSD——是的,也包括黄金。 如果你想在同一张图表上同时显示 M1 噪声和 H4 结构,你可以堆叠多个具有不同前缀的实例。这是你的问题所在。指标本身
FREE

终极 SMC 指标 (The Ultimate SMC Indicator) 终极 SMC 指标是一款专为 MetaTrader 5 开发的机构级交易系统。旨在消除图表杂乱和主观绘图,自动实时绘制市场结构,识别银行流动性区域,追踪订单流失衡,并在所有金融工具中为您提示高概率的交易机会。 核心技术特性与架构: 自动市场结构映射: 使用动态枢轴检测 ( InpSwingLength = 50 ) 实时追踪波段高点 ( HH ) 和低点 ( HL )。自动绘制并标记结构突破 (BOS,代表趋势延续) 和特征改变 (CHoCH,代表趋势反转)。 动态订单块 (OB): 精确定位机构爆发性发力前的基准 K 线。这些需求和供应区域会在图表上自动向前延伸,直到价格测试(消除)它们,届时内存数组会自动清理,保持图表清晰。 突破公允价值缺口 (FVG): 检测 3 根 K 线构成的价格失衡区(激进的市价单在此留下了未填充的流动性)。实时追踪活跃的 FVG,直到价格返回重新平衡缺口。 动态拒绝信号与箭头: 使用主动监控引擎 ( UpdateDynamicZones ) 评估 OB 和 FVG 核心区域内的

MQL5 博客 = https://www.mql5.com/en/blogs/post/775942 MT4 版本 = https://www.mql5.com/en/market/product/196315 MT5 版本 = https://www.mql5.com/en/market/product/196316
“反转概率”(Reversal Probability)是一款先进的市场分析指标,旨在识别历史上反转点(转折点)集中的价格区域。
该指标不依赖于单一的支撑或阻力位,而是利用已确认的市场转折点构建动态的“反转概率”,并将其整理为具有实际意义的价格区间。这使交易者能够直观地看到历史上哪些区域的反转活动最为密集,以及当前价格相对于这些区域的位置。
该指标将转折点分析、价格密度分布、动态支撑与阻力、聚类可视化以及专业的多品种仪表板整合在一个交易工作区中。
主要功能 反转概率 可视化展示不同价格水平上已确认历史转折点的密集程度。 最大反转区 / POC 自动识别包含历史转折点最密集分布的价格区间。 动态支撑与阻力 利用已确认的转折低点识别支撑区域,利用已确认的转折高点

ContextAxis Supply Demand Trade Planner ContextAxis Supply Demand Trade Planner 是一款交易决策辅助指标,帮助交易者以结构化方式读取供需区域,而不是仅仅因为图表上出现了区域就立即进场。 该指标将高周期供需区域、多周期市场背景、区域形成评分、收盘K线反应确认、技术目标、风险回报比过滤以及仓位规模规划整合在一个工作流程中。 主要功能 供需区域 — 从更高时间周期识别技术性 Buy Area 和 Sell Area。 多周期背景 — 使用更高周期构建区域,并使用更高一级周期提供市场背景。 FORM A / B / C / D — 显示区域形成时存在的技术证据数量。FORM 不是胜率评分,也不保证盈利。 生命周期状态 — WATCH、ARMED / IN ZONE、WEAK、MODERATE、STRONG 和 INVALID 用于说明价格在区域附近的行为。 收盘K线确认 — 只根据已经完成的K线进行确认,而不是根据尚未收盘的实时K线。 交易计划 — 在有效反应后,可显示 Entry、Technical SL、TP1

MTF OPEN LINE PRO MT5 概述 MTF Open Line Pro MT5是一款只读型MetaTrader 5指标,用于在同一张图表上整理多个时间周期的参考开盘价和基于已完成K线确认的形态事件。面板、输入参数和消息均使用英语。 级别与配置 可使用Scalping M5、Day M15、Day H1和Custom四种配置。最多8个级别槽可组合当前周期开盘价、前一周期开盘价、年度开盘价、经纪商交易时段开盘价、自定义日期时间锚点,以及Opening Range的高点、低点或中点。面板还显示距最近有效级别的点数、百分比和ATR距离,以及相邻级别的重合度。 已完成K线形态 PB用于观察级别附近的回调和拒绝,BR用于观察突破后的回测,FR用于观察假突破后的重新站回。各模式可单独或同时启用。事件只在K线完成后确认;当前未完成K线不会用于最终确认。同一根K线上出现相反方向候选时会抑制信号。 Entry箭头标记检测到的形态事件。Exit箭头根据失效、虚拟目标、反向事件或时间规则结束内部虚拟形态。这些只是图表分析记录,不是真实交易、订单、持仓或业绩声明。 面板、通知与CSV 面板可切换配

RelicusRoad Multi Timeframe Trendbar 是适用于 MetaTrader 4 和 MetaTrader 5 的多周期趋势指标,在图表角落以一行彩色圆点显示 M1 至 MN1 共九个周期的 Uptrend、Neutral 或 Downtrend 状态。 每个周期在图表右下角都有一个圆点,其名称显示在上方。颜色表示该周期的状态,因此无需切换图表即可看出哪些周期方向一致。 工作原理 对每个周期,指标都会在该周期当前 K 线上比较两个标准工具:步长 0.02、最大值 0.2 的 Parabolic SAR,以及周期为 14 的 ADX 中 +DI 与 -DI 两条线。只有二者一致时才会显示方向: Uptrend:Parabolic SAR 位于收盘价下方,且 +DI 高于 -DI,默认柠檬绿。 Downtrend:Parabolic SAR 位于收盘价上方,且 -DI 高于 +DI,默认红色。 Neutral:其他所有情况,包括 SAR 与 DI 意见不一致,默认黄色。 ADX 主线未被使用,因此这一行只显示方向,不显示趋势强度。ADX 与 SAR 的设置是固定
FREE

SingleArrow MTF — Market Description — zh SingleArrow MTF — 独立ZigZag + Williams %R 背离信号 一个文件。一个箭头。一个决策。 SingleArrow MTF 是面向 MetaTrader 5 的专业级自包含背离信号指标。它将专用线性时间 ZigZag 引擎、带腿部分离的 Williams %R 背离过滤器、可选枢轴保护层、多时间框架一致性面板与自动支撑/阻力集成于一体——全部编译为单个文件,无需外部指标、库或 DLL。 适用人群 主观交易者 :希望获得干净、基于规则的背离箭头,而非原始振荡器读数。 EA 开发者 :需要机器可读、重绘透明的信号源(缓冲 + GlobalVariable 通道)。 回测与策略研究者 :需要已确认、历史稳定的信号流(Confirm 模式)。 一张图看架构 结构层: 内置 ZigZag 引擎从价格中提取枢轴。 分析层: Williams %R 背离过滤器以腿部分离校验每个枢轴对。 呈现层: 箭头、MTF 面板、S/R 级别、警报与透明计数器。 1)内置 ZigZag 引擎(为何不

一条在决定守哪一侧之前先问资金流向何处的跟踪止损线。Alpha Trend MTF用ATR搭起跟踪线,把方向交给资金流来判断,然后从这条线与它自己两根K线之前的副本相交处取得信号。正是这一构造,让它在能把普通跟踪止损甩出去的锯齿行情里依然安静。上位时间周期的信号可以画在任何图表上,而读取的只有已收盘的上位K线。它是免费的:没有试用期,没有锁定功能,没有升级页面。 以ATR为距离,从最低价和最高价各搭出一个跟踪水平。由资金流决定守住哪一个:只要资金流指数在五十或以上,市场就被视为被买入,守住下方水平;低于五十则守住上方水平。没有成交量时,同样的判断由收盘价的RSI做出,这是原作自带的开关,此处默认关闭。 接着,这条线与它自己两根K线之前的副本相比较。产生阴影和箭头的正是这一比较,而不是与价格的比较,这与原作完全一致。在MetaTrader 5上,资金流背后的成交量是逐笔成交量,本平台上所有基于成交量的研究都建立在它之上。 图表上有什么 在价格窗口里绘制:按所守一侧上色、跨越转折而不断开的跟踪线;延迟两根K线的副本,画成细线;两者之间的两处阴影;以及该线与延迟副本相交那根K线上的BUY和S
FREE

IRONFRAME SMC GOLD MT5 Smart Money Concepts、市场结构、流动性映射与确定性每日流动性吸引 产品概览 Ironframe SMC Gold MT5 是 MetaTrader 5 的多层自定义指标,主要面向 XAUUSD 和以黄金为重点的日内分析。它结合了 Smart Money Concepts、订单块、供需、溢价/折价位置、流动性扫荡、背离、衰竭、吸收、突破确认、更高时间框架背景、K线形态识别、市场状态过滤器以及确定性每日流动性目标。 该指标将市场位置、设置条件、触发质量、背景证据和目标选择分离。它显示 BUY/SELL 箭头、结构和区域对象、流动性水平、可选仪表盘、拐点和形态标记、斐波那契参考、诊断信息以及面向兼容 Expert Advisors 的隐藏数据缓冲区。该指标不打开或管理交易;执行、仓位规模和账户风险仍由交易者或单独的 EA 负责。 默认配置为 Active Range Breakout,使用 Balanced Breakout 预设。也可使用 Range-Bound Reversal 和 Conservative 模式。依赖数据

Combined Fibonacci & Dashboards MT5 Combined Fibonacci and Dashboards 是一款专为 MetaTrader 5 设计的多周期分析工具套件。它结合了基于波动率的动态斐波那契回调层级、自动价格拒绝信号检测以及交互式图表管理面板。 该指标无需手动绘制和频繁调整斐波那契网格,而是通过在两个周期上同时使用移动中线和波动率通道,动态计算斐波那契趋势延续区域。结合内置的多周期趋势监控和一键切换品种功能,为裸K多周期分析提供了统一的操作中心。 核心功能详解 双引擎动态斐波那契层级 基础周期引擎: 根据当前图表的真实波动范围,实时绘制动态中线及斐波那契扩展/回调位( $0.236, 0.382, 0.500, 0.618, 0.786$ )。 多周期(MTF)引擎: 叠加更高周期(例如在 M5 图表上显示 H1 层级)的斐波那契线,帮助识别高低周期重合的关键支撑与阻力共振区。 层级自定义: 可根据个人交易策略,自由开启或关闭指定的斐波那契比例( $23.6\%, 38.2\%, 50.0\%, 61.8\%, 78.6\%$ )。 算法拒
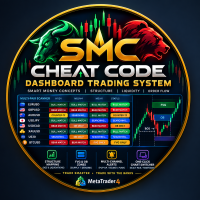
SMC Cheat Code Dashboard Trading System SMC Cheat Code Dashboard Trading System 是一款为 MetaTrader 4 打造的专业级机构市场结构指标。专为 Smart Money Concepts(SMC)和 ICT 交易者设计,该工具能够自动识别高概率结构突破、关键流动性区域以及多时间框架之间的动态订单流一致性,从而减少图表杂乱和主观分析。 无论您采用剥头皮交易、日内交易还是波段交易策略, SMC Cheat Code 都可以作为实时多品种扫描器,过滤低概率市场噪音,并实时突出显示关键市场结构的汇合区域。 核心功能与运行机制 1. 多品种 SMC Dashboard — 实时扫描器 实时跨品种扫描: 在单一图表窗口中监控您关注的交易品种(EURUSD、GBPUSD、AUDUSD、USDJPY、USDCAD 等)的市场结构一致性。 高时间框架(HTF)与低时间框架(LTF)矩阵: 自动评估关键 SMC 共振条件: H1 vs. D1 — 高时间框架趋势一致性。 M15 vs. H4 — 日内交易结构一致性。 M

Genaro RSI 是一款适用于 MetaTrader 5 的技术指标,可识别价格与 RSI 之间的背离,自动更改振荡器线条的颜色,方便实时读取图表。
当检测到看涨背离(价格形成更低的低点,RSI 形成更高的低点)时,RSI 线变为绿色。当检测到看跌背离(价格形成更高的高点,RSI 形成更低的高点)时,线条变为粉色。正常情况下,线条保持蓝色。
该指标在初始化时执行完整的历史扫描,识别自图表开始以来的所有背离,并在每个新柱上继续监控新的背离。
背离用连接对应枢轴的线条标记,箭头指示信号的准确位置。信息面板显示 RSI 的当前状态(看涨、看跌、超买、超卖、看涨背离、看跌背离),颜色动态变化。声音警报、弹出窗口和推送通知可同时用于背离和 70/30 水平的交叉。
该指标适用于 MetaTrader 5 中的任何资产和时间周期。
如何使用
将 Genaro RSI 附加到所需资产的图表上。RSI 线将根据检测到的背离自动更改颜色。绿线连接低点(看涨背离,买入信号)。粉线连接高点(看跌背离,卖出信号)。黄色箭头标记最近背离的信号点。左上角的面板显示当前状态。在图表上按 R 键可清除
FREE

RelicusRoad Signal Cloud 是适用于 MetaTrader 4 和 MetaTrader 5 的云状指标,向前 21 根 K 线投射一条价格区间,其宽度由 12 与 26 周期 EMA 之间的差距决定。 该区间以收盘价的 3 周期 EMA 为中心,并经过平滑处理,使其边界逐渐变化。由于向前偏移,云的一部分始终位于最后一根 K 线的右侧,价格随后会到达此前已经绘制好的那一段。 工作原理 对每一根 K 线,指标测量收盘价 12 与 26 周期指数移动平均之间的绝对差距,即 MACD 线所显示的同一个距离。该差距成为区间的半宽:加到收盘价 3 周期 EMA 上得到上边界,减去则得到下边界。两条边界随后都用 9 周期简单移动平均平滑,并向右绘制 21 根 K 线。 Width:EMA 12 与 EMA 26 之间的距离。 Center:收盘价的 3 周期 EMA,本版本中固定。 Smoothing:对两条边界应用的 9 周期简单移动平均。 Forward shift:默认向右偏移 21 根 K 线。 Daily wait:一个可选的闸门,在每个交易日开始时暂停计算。 Da
FREE

A lot of pivot indicators quietly redraw the levels you already traded. They build today's central pivot range from a bar that's still open, so the "support" you bought at 9am has moved by lunch and the screenshot you saved doesn't match the chart any more. CPR Trend Zones takes the range from the last closed day or week, and once a period has started its lines don't move. It also reads that range for you. At the start of each period it notes which side of the CPR price opened on, draws one leve

3-IN-1 BUNDLE CANDLE TRADING SYSTEM & STRATEGIES
Stop Guessing. Stop Chasing. Start Trading With a Clearer Plan!
PLEASE NOTE THIS, IT'S VERY IMPORTANT!
The Custom Indicators and Utility Expert Advisor That Come With This System Package Are Programmed To Work Only On MT5 Meta-Trader For Now But The Strategies Involved (Clearly Illustrated in the e-book and the videos) Can Be Implemented On MT4, MT5 & Other Trading Platforms.
Are you tired of entering a trade only to watch the market move agai

RelicusRoad Multi Timeframe Levels 是适用于 MetaTrader 4 和 MetaTrader 5 的多周期支撑阻力指标,把 H1、H4、D1、W1 与 MN1 的最新摆动高点与低点,以水平线的形式绘制在你正在交易的图表上。 这五个周期各自贡献一条阻力线与一条支撑线,因此一张日内图表最多可以承载十条线。每条线都按其来源周期着色,因此无需切换图表即可持续看到更高周期的摆动。 工作原理 对固定集合中的每个周期,指标都会从最近的 K 线向前搜索最新的五根 K 线分形:某根 K 线的最高价未被其两侧各两根 K 线超越。该最高价即成为该周期的阻力线,对最低价进行同样的检验则得到支撑线。只有当某个周期等于或高于图表周期时才会被使用,因此你看到的组合取决于当前图表: M1, M5, M15 and M30 charts:全部五个来源周期,从 H1 到 MN1。 H1 chart:H1、H4、D1、W1 与 MN1,因为图表自身的周期也会包含在内。 H4 chart:H4、D1、W1 与 MN1,H1 的线会被隐藏。 D1 chart:D1、W1 与 MN1。 W1
FREE

RelicusRoad Trading Sessions 是适用于 MetaTrader 4 和 MetaTrader 5 的交易时段指标,在 M1、M5 与 M15 图表上以垂直点线标出东京、伦敦与纽约时段的开盘时间。 每个时段的开盘都以一条线、一个旋转显示的小名称标签,以及一个事件标记来呈现,颜色为该时段自己的颜色,覆盖当前交易日与此前的若干工作日。将鼠标悬停在其上会显示时段名称与开盘时间。本指标只标记开盘:不会填充时段区间、重叠或收盘时间。 工作原理 指标加载时会读取经纪商服务器时间与 UTC 之间的差值,四舍五入到整小时,再减去一小时。随后它会把东京开盘设在 UTC 23:00、伦敦开盘设在 UTC 07:00、纽约开盘设在 UTC 12:00,换算为服务器时间,并从当前 UTC 日期向前逐个工作日标出。周六与周日会被跳过。 Tokyo:默认橙色,位于 UTC 23:00,即东京时间 08:00。 London:默认绿色,位于 UTC 07:00,即夏令时下的伦敦开盘时间。 New York:默认红色,位于 UTC 12:00,即夏令时下的纽约开盘时间。 指标不做夏令时调整。这
FREE

在上一次转折之后进场的所有人的平均价格,不需要您自己去放锚点就能画出来。Anchored VWAP MTF自己找到上一个已确认的摆动点,从那里牵出成交量加权平均价格,并在周围加上偏差带,于是回踩测试与真正的离场得以区分。它内部完全没有日历,因此在任何品种、任何经纪商的交易时段下表现都一样。它是免费的:没有试用期,没有锁定功能,没有升级页面。 成交量加权平均价格不是从图表开头累积,而是从一个锚点开始:典型价格乘以成交量的总和,除以成交量的总和,两者都从锚定的那根K线算起。带子是同一份加权样本的偏差,因此它们是VWAP自身的带子,而不是叠在上面的布林带。 提供两个锚点,且两者都刻意不使用日历。第一个是上一个已确认的摆动枢轴,这正是该方法被发明出来的那个锚点,也是出厂时选中的那一个。第二个是固定根数的滚动窗口。日初或周初这类锚点是有意缺席的:引擎不读取任何一个时间戳,因此在经纪商自定交易时段的品种上同样可用。 图表上有什么 在价格窗口里绘制:按价格处在哪一侧上色、跨越换边而不断开的锚定VWAP;两条偏差带,画成细线;两者之间的两处阴影;以及价格换边那根K线上的箭头。带子可以单独关闭。 面板
FREE

概述
使用 Anchored Volume Profile 体验专业级的订单流分析。这是一款专为 MetaTrader 5 设计的超轻量、高性能交易量分布指标。该指标完全基于底层内存画布(Canvas)机制构建,彻底消除了传统矩形对象属性(rectangle-object profiles)常见的 CPU 延迟、界面闪烁和图表卡顿问题。
通过将终端的原生跳动量(Tick Volume)处理为方向性矩阵,该工具提供了视觉效果极佳、像素级完美的市场拍卖结构布局,让您能够以绝对的精度精准锁定机构支撑位、阻力位和关键流动性池。 核心专业功能: 画布引擎(Canvas Engine): 将整个分布图阵列直接绘制在平面的屏幕空间内存位图上。布局在出现新 Tick 时的单个线程周期内立即更新,完全消除了屏幕延迟。 方向性多空 Tick 分离: 动态扫描日内订单数据,将总 Tick 交易量分为买入(Up-Bar)和卖出(Down-Bar)组件,深入洞察历史平衡与控制权。 无缝左右布局切换: 瞬间将指标位置从左侧切换到右侧。数学算法动态处理像素边距,确保在宽屏显示器和多图表网格上实现完美的几何对称。
FREE

一次读完二十八个品种上深度平滑的趋势线。Cascade WMA Trend Scanner把六级级联跑在每个品种的四个时间周期上,按最近转向的先后排列面板,并用一列告诉您有多少个时间周期一致,下方的图表已经为入场做好准备。 每售出10份,价格上涨10美元。 Cascade WMA Trend Scanner是一个文件里的两个产品。第一个是画在您眼前图表上的Cascade WMA Trend本身:串联而成的线,以及它转向处的箭头。 第二个产品是一块面板,它把同一套计算同时跑在一份品种清单和多个时间周期上。面板告诉您哪些品种出了信号、距今多久;下方的图表则显示是什么产生了这个信号,因此您不必再挂第二个指标就能按表格找到的结果行动。 看板 每个品种一行,每个扫描的时间周期一列,最多四列、最多二十八个品种。出厂状态下扫描十五个品种,一个设置即可提到二十八个。品种清单用逗号分隔填写,或者由面板取用市场报价窗口里的清单。经纪商的前缀和后缀会从您所在的图表上识别,也可以手工填写。出厂状态下面板扫描四个时间周期:M15、H1、H4和D1。 一个单元格读作 ^14b:信号在哪一侧,以及多少根K线之前触发

适用于 MT5 的外汇指标“整数位”。 ........................................ - 对于考虑支撑位/阻力位的交易者来说,“整数位”指标是必备的辅助指标。 - 价格非常依赖整数位——价格经常从整数位反弹。 - 对于 4 小时和 1 天的时间框架,步长为 1000 点。 - 对于 1 小时及更短的时间框架(用于日内交易),步长为 500 点。 - 整数位也非常适合配置止盈(位于整数位之前)和止损(位于整数位之后)。 - 这些水平线非常强劲,尤其是在价格横盘整理和平盘期间。 .................................................... Click here to see high quality Trading Robots and Indicators! 这是仅在 MQL5 网站上提供的原创产品

SMC Ultimate 面向 MetaTrader 5 的机构级 Smart Money Concepts (SMC) / ICT 决策引擎。分析市场结构、流动性、Order Block 与 Fair Value Gap,并转换为评分、编码状态以及已确认的 Buy/Sell 信号。 可完全独立运行(图表面板、绘图与提醒),也可通过稳定的 4 缓冲区合约与固定的 88 个输入参数,可靠地与 iCustom 集成,供 EA 调用。 首个公开版本(version 1.0)上线价。价格可能在早期更新与评价之后上调。 主要功能 HTF 与 LTF 市场结构:摆动点、BOS 与 CHoCH 流动性地图:equal high/low 与扫损(sweep)检测 Order Block 与 Fair Value Gap(含触达/失效状态) Premium / Discount 上下文评分 可配置权重的多因子决策分,带迟滞锁定 Anti-Repaint:确认信号锁定在已收盘 K 线(shift 1) 图表仪表盘:趋势、区域、分数、信号与缓冲区读数 提醒:弹窗、声音、推送(冷却与每根K线一次) EA Mo

RelicusRoad Action Levels 是适用于 MetaTrader 4 和 MetaTrader 5 的支撑阻力价位指标,依据品种自身的波动率与历史反应拟合一套主要与次要价位网格,并为每个价位标注触碰次数。 这套网格既不是固定点差,也不是简单的整数网格。其间距与偏移是从已收盘的 K 线中选取的,每个价位都会根据价格在其周围的表现获得评分,图表上只绘制当前价格附近最强的价位。 工作原理 在默认的 Formula 模式下,指标读取所选周期最多 1200 根已收盘 K 线,收集其中的反应:摆动高低点,以及带有长上下影线的 K 线。随后它会尝试一系列间距方案,分别基于典型 K 线波幅、反应点之间的距离,以及两者的组合,每种方案再配合多个偏移量。最终保留线条与这些反应及历史支撑/阻力拟合得最贴切的那套网格。 Touches:只有当价格明显远离该价位之后,再次触及才会重新计数。 Holds:价格触及该价位后,向有利方向的运行距离大于向不利方向。 Breaks and retests:价格收盘穿越该价位,并在 16 根 K 线内回到该价位。 Recency and stability

RelicusRoad Order Blocks 是适用于 MetaTrader 4 和 MetaTrader 5 的订单块指标,寻找位移 K 线,把每一波行情起始的那根 K 线标记为看涨或看跌订单块,并跟踪价格回补进入该区域的深度。 本指标为使用 smart money concepts(SMC)方法的交易者而设计。 工作原理 位移 K 线是指实体至少达到最近 14 根 K 线平均真实波幅(ATR)1.5 倍、且实体占自身最高最低价区间至少 55% 的 K 线。随后指标向前最多回溯三根 K 线,寻找最后一根相反颜色的 K 线,其最高价与最低价即构成该订单块。如果位移 K 线的收盘价还超出了此前 20 根 K 线的最高点或最低点,该订单块会获得更高评分,但结构突破并非必要条件。只使用已收盘的 K 线,因此正在形成的 K 线永远不会创建或改变订单块。每个订单块都有一个角色和一个状态: Bull OB:看涨位移行情的起始位置。 Bear OB:看跌位移行情的起始位置。 Bull Breaker 与 Bear Breaker:价格收盘突破并守住的看跌订单块,或收盘跌破并守住的看涨订单块,依据
学习如何在MetaTrader AppStore上购买EA交易,MetaTrader平台的应用程序商店。
MQL5.community支付系统支持通过PayPay、银行卡和热门付款系统进行交易。为更好的客户体验我们强烈建议您在购买前测试EA交易。
