Introducción a MQL5 (Parte 17): Creación de asesores expertos para reversiones de tendencias

Introducción
¡Bienvenidos nuevamente a la Parte 17 de la serie Introducción a MQL5! Esta parte continúa desarrollando todo lo que hemos explorado hasta ahora, utilizando nuestro enfoque característico basado en proyectos para ayudarte a perfeccionar tus habilidades de MQL5 mediante ejemplos reales. En la Parte 16, nos centramos en el patrón de Cabeza y Hombros, creando un Asesor Experto que pudiera detectarlo automáticamente, operar e incluso visualizarlo en el gráfico. Fue una excelente manera de aprender a trabajar con patrones de gráficos en MQL5.
Para este artículo, originalmente tenía la intención de utilizar un solo patrón de continuación o reversión, como la bandera, la cuña descendente o la cuña ascendente. Sin embargo, cuando investigué más, descubrí algo crucial: muchos de estos patrones tienen una estructura similar y con frecuencia dependen de rupturas o reversiones de las líneas de tendencia. Por lo tanto, esta sección se concentrará en el desarrollo de un Asesor Experto que pueda identificar y negociar situaciones de ruptura y reversión de líneas de tendencia, en lugar de restringirnos a un solo patrón. Con unos pocos ajustes, puedes aplicar estas ideas fundamentales a varios patrones de gráficos una vez que los hayas dominado.
En este artículo aprenderás:
- Cómo recuperar el valor del precio exacto de una línea de tendencia en el momento de cualquier vela determinada utilizando ObjectGetValueByTime().
- Identifique posibles señales de ruptura y reversión basándose en la estructura de las velas alrededor de las líneas de tendencia.
- La diferencia entre líneas de tendencia ascendentes y descendentes y cómo interpretar su interacción con la acción del precio.
- Acerca de la importancia de verificar el comportamiento reciente de las velas (como mechas y cierres) para confirmar el rechazo o la ruptura del precio.
- El uso práctico de comparaciones basadas en el tiempo para evitar ejecutar operaciones con señales obsoletas o irrelevantes.
- Cómo construir un Asesor Experto (EA) básico pero flexible que opere automáticamente en función de las interacciones con las líneas de tendencia.
1. Comprensión de las líneas de tendencia
Una línea recta que cruza dos o más puntos de precio en un gráfico se llama línea de tendencia. Cuando se posiciona correctamente, le ayuda a reconocer la tendencia actual y las posibles oportunidades comerciales. Las líneas de tendencia están sesgadas y siguen la dirección natural del mercado, que puede ser lateral, ascendente o descendente, a diferencia de los niveles de soporte y resistencia horizontales establecidos.
Dado que muchos patrones de gráficos están enmarcados o creados alrededor de líneas de tendencia, las líneas de tendencia son particularmente cruciales para identificar ciertos patrones. Por ejemplo, el precio se comprime entre dos líneas de tendencia convergentes hasta que se produce una ruptura en una cuña descendente o ascendente. La zona de consolidación antes del movimiento de continuación está definida por líneas de tendencia en patrones de bandera y banderín.
1.1. Tipos de líneas de tendencia
1.1.1. Línea de tendencia ascendente
En una tendencia alcista, una línea de tendencia ascendente sirve como nivel de soporte uniéndose a mínimos más altos. Le ayuda a identificar posibles oportunidades de venta cuando el precio cae por debajo de él, lo que indica una posible reversión de la tendencia o una caída más profunda, y oportunidades de compra durante los retrocesos.

1.1.2. Línea de tendencia descendente
Una línea de tendencia descendente indica un impulso bajista, mientras que una línea de tendencia ascendente tiene pendiente hacia arriba. En un mercado descendente, se crea mediante la unión de dos o más máximos más bajos. Como nivel de resistencia, esta línea con pendiente descendente indica que el mercado se está moviendo en una dirección general bajista.
Durante breves aumentos de precios, las líneas de tendencia descendentes brindan oportunidades de venta, ya que predicen una reversión del precio a la baja una vez que el precio toca la línea. Sin embargo, una ruptura es importante, como es el caso de las líneas de tendencia ascendentes. El precio puede indicar un probable cambio de una tendencia bajista a una alcista y presentar una posible oportunidad de compra si supera la línea de tendencia descendente.

Una línea de tendencia descendente indica un impulso bajista, mientras que una línea de tendencia ascendente tiene pendiente ascendente. En un mercado descendente, se crea mediante la unión de dos o más máximos más bajos. Como nivel de resistencia, esta línea con pendiente descendente indica que el mercado se está moviendo en una dirección general bajista.
Al enfatizar rupturas significativas que frecuentemente indican cambios en el impulso del mercado, las líneas de tendencia brindan claridad visual y entradas comerciales tácticas. Comprender el comportamiento de la línea de tendencia, en lugar de aprender patrones específicos de memoria, ofrece una base versátil para el reconocimiento de patrones y es particularmente útil al desarrollar técnicas automatizadas como los Asesores Expertos en MQL5.
2. Configuración del proyecto
2.1. Cómo funciona el EA
En este proyecto, crearemos un Asesor Experto que utiliza las líneas de tendencia del gráfico para realizar operaciones automáticamente. Dependiendo del estado del mercado, el EA crea líneas de tendencia ascendentes o descendentes legítimas analizando máximos y mínimos recientes.
El EA rastrea cómo el precio interactúa con las líneas de tendencia una vez que se establecen. En dos escenarios principales, será necesario realizar operaciones. El EA operará primero en la dirección de la tendencia, anticipando una reversión, cuando el precio alcance la línea de tendencia y se revierta. En segundo lugar, el EA identificará un patrón de ruptura-nueva prueba y colocará una operación en la dirección de ruptura cuando el precio cruce una línea de tendencia y luego la vuelva a probar desde el lado opuesto. Debido a esta lógica, el EA se puede utilizar con varios patrones de gráficos, incluidas cuñas, banderas, triángulos y canales, todos los cuales dependen principalmente de la dinámica de las líneas de tendencia.
2.1.1. Línea de tendencia ascendente
2.1.1.1. Lógica para comprar
- El EA detectará dos mínimos oscilantes y dibujará una línea de tendencia ascendente a través de ellos.
- El EA observa continuamente el movimiento de precios que vuelve a tocar o se acerca a la línea de tendencia sin romperla.
- Cuando el precio toca la línea de tendencia e inmediatamente forma una vela alcista, el EA lo considera un rebote válido.
- Tras la confirmación de un rebote alcista desde la línea de tendencia ascendente, el EA coloca una orden de compra.
- El usuario puede especificar el número de puntos por debajo del precio de entrada o el mínimo de la vela de rebote como SL.
- El usuario puede especificar el TP en puntos encima del precio de entrada.

2.1.1.2. Lógica para vender
- El EA detectará dos mínimos oscilantes y dibujará una línea de tendencia ascendente a través de ellos.
- Monitorea continuamente para detectar una ruptura bajista por debajo de esta línea de tendencia ascendente.
- Una vez que el precio cae por debajo de la línea de tendencia, el EA espera una nueva prueba, donde el precio vuelve a tocar la línea de tendencia desde abajo.
- Si se forma una vela bajista inmediatamente después de la nueva prueba y el precio bajo está por debajo de la línea de tendencia, el EA considera que esto es una ruptura y confirmación válida.
- Tras la confirmación de la nueva prueba bajista, el EA coloca una orden de venta.
- El usuario puede especificar el número de puntos por encima del precio de entrada o por encima del máximo de la vela de nueva prueba como SL.
- El usuario también puede especificar el TP en puntos debajo del precio de entrada.

2.1.2. Línea de tendencia descendente
2.1.2.1. Lógica para comprar
- El EA detectará dos máximos oscilantes y dibujará una línea de tendencia descendente a través de ellos.
- Monitorea continuamente para detectar una ruptura alcista por encima de la línea de tendencia descendente.
- Una vez que el precio supera la línea de tendencia, el EA espera una nueva prueba, donde el precio vuelve a tocar o acercarse a la línea de tendencia rota desde arriba.
- Si se forma una vela alcista inmediatamente después de la nueva prueba y el precio máximo está por encima de la línea de tendencia, el EA considera que esto es una ruptura y confirmación válida.
- Tras la confirmación de la nueva prueba alcista, el EA coloca una orden de compra.
- El usuario puede especificar el número de puntos por debajo del precio de entrada o por debajo del mínimo de la vela de nueva prueba como Stop Loss (SL).
- El usuario también puede especificar el Take Profit (TP) en puntos por encima del precio de entrada.

2.1.2.2. Lógica para vender
- El EA detectará dos máximos oscilantes y dibujará una línea de tendencia descendente a través de ellos.
- Monitorea continuamente el movimiento de precios que toca la línea de tendencia descendente.
- Cuando el precio toca la línea de tendencia e inmediatamente forma una vela bajista, el EA lo considera una reversión válida.
- Tras la confirmación de un rebote bajista desde la línea de tendencia descendente, el EA coloca una orden de venta.
- El usuario puede especificar el número de puntos por encima del precio de entrada o el máximo de la vela de rebote como Stop Loss (SL).
- El usuario también puede especificar el Take Profit (TP) en puntos por debajo del precio de entrada.

Nota: Desarrollar sus conocimientos sobre las ideas de programación de MQL5, en particular cómo trabajar con patrones de gráficos y crear asesores expertos útiles, es el objetivo principal de la estrategia de trading que se explorará en este proyecto. No está destinado a ser utilizado con dinero real ni para operaciones bursátiles en tiempo real. Antes de implementar cualquier técnica en un mercado real, realice siempre una prueba retrospectiva exhaustiva y solicite asesoramiento a un experto financiero.
3. Identificación de líneas de tendencia ascendentes y descendentes
Podemos comenzar a poner las cosas en práctica programáticamente ahora que hemos discutido en profundidad la idea de cómo funcionará el Asesor Experto. Permitir que el EA reconozca y dibuje líneas de tendencia automáticamente es el primer paso. El EA primero localizará dos puntos de oscilación significativos en el gráfico antes de dibujar una línea de tendencia. Buscará los dos mínimos más altos más recientes (mínimos oscilantes), que indican un impulso ascendente, para formar una línea de tendencia ascendente.
Buscará los dos máximos inferiores más recientes (máximos oscilantes), que significan presión a la baja, para formar una línea de tendencia descendente. Después de identificar estas ubicaciones de oscilación, el EA las conectará con una línea de tendencia. Luego, esta línea sirve como punto de referencia para identificar posibles posibilidades de ruptura o reversión.
3.1. Recuperación de datos de velas
El componente clave de cualquier proyecto que involucre patrones gráficos son los datos de velas. Sin ella, es imposible evaluar la estructura de precios o identificar máximos y mínimos. Por este motivo, extraer datos históricos de velas del gráfico es la primera etapa en la creación de nuestro EA. En estos datos se incluyen detalles de precios importantes, como la apertura, el máximo, el mínimo y el cierre de cada vela. Con el uso de estos datos, podremos reconocer líneas de tendencia, detectar la estructura del mercado y utilizar señales de reversión o ruptura para descubrir posibles entradas comerciales.
Ejemplo:// Timeframe to use for retrieving candlestick data (default is the current chart timeframe) input ENUM_TIMEFRAMES time_frame = PERIOD_CURRENT; // Number of past bars (candlesticks) to check int bars_check = 500; // Arrays to store candlestick data double close_price[]; // Stores close prices double open_price[]; // Stores open prices double low_price[]; // Stores low prices double high_price[]; // Stores high prices datetime time_price[]; // Stores time data for each candle //+------------------------------------------------------------------+ //| Expert initialization function | //+------------------------------------------------------------------+ int OnInit() { // Set arrays as series so the newest bar is index 0 ( start from the latest bar) ArraySetAsSeries(close_price, true); ArraySetAsSeries(open_price, true); ArraySetAsSeries(low_price, true); ArraySetAsSeries(high_price, true); ArraySetAsSeries(time_price, true); return(INIT_SUCCEEDED); // Signal that the EA initialized successfully } //+------------------------------------------------------------------+ //| Expert deinitialization function | //+------------------------------------------------------------------+ void OnDeinit(const int reason) { } //+------------------------------------------------------------------+ //| Expert tick function | //+------------------------------------------------------------------+ void OnTick() { // Copy the latest candlestick data into the arrays CopyOpen(_Symbol, time_frame, 1, bars_check, open_price); // Open prices CopyClose(_Symbol, time_frame, 1, bars_check, close_price); // Close prices CopyLow(_Symbol, time_frame, 1, bars_check, low_price); // Low prices CopyHigh(_Symbol, time_frame, 1, bars_check, high_price); // High prices CopyTime(_Symbol, time_frame, 1, bars_check, time_price); // Candle times }
Explicación:
Para crear un EA que reaccione a los patrones de gráficos, se deben recopilar datos históricos de velas. El código almacena esta información en cinco matrices: apertura, cierre, máximo, mínimo y hora. Estas matrices sirven como base para el trazado de líneas de tendencia y la detección de puntos de oscilación. Con PERIOD_CURRENT como valor predeterminado, el EA utiliza el marco temporal del gráfico actual. Los usuarios pueden seleccionar el período de tiempo en el que debe operar el EA (por ejemplo, M1, H1, D1) utilizando la variable de entrada time_frame. La variable bars_check, que en esta instancia está establecida en 500, determina cuántas velas anteriores se deben examinar. Por lo tanto, ignorando la vela que se está formando ahora, el EA recuperará y examinará las últimas 500 velas completadas.
Cada una de estas matrices se configura utilizando ArraySetAsSeries(..., true); dentro de la función OnInit(). Debido a que invierte el orden de la matriz, este paso es crucial porque hace que el índice 0 se relacione con la vela terminada más reciente, el índice 1 con la vela anterior, y así sucesivamente. Comenzando con la actividad de precios más reciente y trabajando hacia atrás, este método de indexación está en línea con la forma en que los traders examinan los gráficos de manera intuitiva.
El método OnTick() es donde se lleva a cabo la mayor parte de la recuperación de datos. Esta función se activa en cada tick, o siempre que cambia el precio del mercado. Dentro de él, el EA extrae datos de velas en las matrices apropiadas usando CopyOpen, CopyClose, CopyHigh, CopyLow y CopyTime. Si bien la primera opción garantiza que el EA evite la vela en desarrollo actual (porque puede cambiar rápidamente y no es confiable para el descubrimiento de patrones), el segundo argumento es el marco de tiempo elegido. La información obtenida se remonta a las velas bars_check.
3.2. Identificación de la línea de tendencia ascendente
El siguiente paso es encontrar los puntos de oscilación en el movimiento de precios una vez que se hayan recuperado los datos de las velas. Encontrar una línea de tendencia ascendente, que suele aparecer cuando el mercado está formando mínimos más altos, será nuestro primer objetivo. Esto implica que primero hay que encontrar dos mínimos legítimos. Para ayudar al EA a identificar posibles configuraciones alcistas como rebotes o rupturas a lo largo de este soporte ascendente, estos mínimos oscilantes actuarán como puntos de anclaje para dibujar la línea de tendencia ascendente.
Ejemplo:
// Timeframe to use for retrieving candlestick data (default is the current chart timeframe)
input ENUM_TIMEFRAMES time_frame = PERIOD_CURRENT;
// Input to enable or disable drawing of the ascending trend line (true = allow drawing)
input bool allow_uptrend = true;
// Number of candles to look back when identifying swing lows for drawing the trend line
input int LookbackBars = 5;

// Number of past bars (candlesticks) to check
int bars_check = 500;

// Arrays to store candlestick data
double close_price[];   // Stores close prices
double open_price[];    // Stores open prices
double low_price[];     // Stores low prices
double high_price[];    // Stores high prices
datetime time_price[];  // Stores time data for each candle

double first_low;           // Price value of the first identified swing low
datetime first_low_time;    // Time when the first swing low occurred

double second_low;          // Price value of the second identified swing low
datetime second_low_time;   // Time when the second swing low occurred

string up_trend = "Up Trend";  // Label used to name the ascending trend line object on the chart

long chart_id = ChartID();     // Stores the current chart ID for referencing during object creation or manipulation

//+------------------------------------------------------------------+
//| Expert initialization function                                   |
//+------------------------------------------------------------------+
int OnInit()
  {
// Set arrays as series so the newest bar is index 0 ( start from the latest bar)
   ArraySetAsSeries(close_price, true);
   ArraySetAsSeries(open_price, true);
   ArraySetAsSeries(low_price, true);
   ArraySetAsSeries(high_price, true);
   ArraySetAsSeries(time_price, true);

   return(INIT_SUCCEEDED);  // Signal that the EA initialized successfully
  }

//+------------------------------------------------------------------+
//| Expert deinitialization function                                 |
//+------------------------------------------------------------------+
void OnDeinit(const int reason)
  {

   ObjectsDeleteAll(chart_id);

  }

//+------------------------------------------------------------------+
//| Expert tick function                                             |
//+------------------------------------------------------------------+
void OnTick()
  {
// Copy the latest candlestick data into the arrays
   CopyOpen(_Symbol, time_frame, 1, bars_check, open_price);     // Open prices
   CopyClose(_Symbol, time_frame, 1, bars_check, close_price);   // Close prices
   CopyLow(_Symbol, time_frame, 1, bars_check, low_price);       // Low prices
   CopyHigh(_Symbol, time_frame, 1, bars_check, high_price);     // High prices
   CopyTime(_Symbol, time_frame, 1, bars_check, time_price);     // Candle times

// If the user allows drawing of ascending trend line
   if(allow_uptrend)
     {
      // First loop: Find the most recent swing low (first low)
      for(int i = LookbackBars; i < bars_check - LookbackBars; i++)
        {
         // Check if current point is a swing low
         if(IsSwingLow(low_price, i, LookbackBars))
           {
            // Store price and time of the first (latest) swing low
            first_low = low_price[i];
            first_low_time = time_price[i];
            break;  // Exit loop after finding the first swing low
           }
        }

      // Second loop: Find an earlier swing low that is lower than the first low
      for(int i = LookbackBars; i < bars_check - LookbackBars; i++)
        {
         // Check for earlier swing low that is lower and occurs before the first low
         if(IsSwingLow(low_price, i, LookbackBars) && low_price[i] < first_low && time_price[i] < first_low_time)
           {
            // Store price and time of the second (older) swing low
            second_low = low_price[i];
            second_low_time = time_price[i];
            break;  // Exit loop after finding the second swing low
           }
        }

      // Create an ascending trend line from the second low to the first low
      ObjectCreate(chart_id, up_trend, OBJ_TREND, 0, second_low_time, second_low, first_low_time, first_low);
      ObjectSetInteger(chart_id, up_trend, OBJPROP_TIMEFRAMES, OBJ_NO_PERIODS);  // Temporarily hide line on all timeframes

      // If the swing structure is valid (i.e., second low is lower than first)
      if(first_low > second_low && second_low > 0)
        {
         // Extend the trend line to the right
         ObjectSetInteger(chart_id, up_trend, OBJPROP_RAY_RIGHT, true);

         // Show the trend line on all timeframes
         ObjectSetInteger(chart_id, up_trend, OBJPROP_TIMEFRAMES, OBJ_ALL_PERIODS);

         // Set visual properties: color and thickness
         ObjectSetInteger(chart_id, up_trend, OBJPROP_COLOR, clrBlue);
         ObjectSetInteger(chart_id, up_trend, OBJPROP_WIDTH, 3);
        }
     }

  }

//+------------------------------------------------------------------+
//| FUNCTION FOR LOWS                                                |
//+------------------------------------------------------------------+
bool IsSwingLow(const double &low[], int index, int lookback)
  {

   for(int i = 1; i <= lookback; i++)
     {

      if(low[index] > low[index - i] || low[index] > low[index + i])
         return false;
     }
   return true;
  }
Resultado:

Explicación:
El propósito de la función IsSwingLow es encontrar mínimos de oscilación en una serie de precios. Una matriz de precios bajos (low[]), un cierto índice dentro de esa matriz (index) y un número retrospectivo que especifica cuántas barras a la izquierda y a la derecha deben comprobarse son los tres argumentos que requiere. El bucle for dentro del método itera desde 1 hasta mirar hacia atrás. Compara el mínimo del índice actual con los mínimos del índice + i (derecha) y del índice - i (izquierda) para cada iteración.
La función devuelve falso, lo que indica que el punto no es un mínimo oscilante si el mínimo actual es mayor que cualquiera de los mínimos cercanos. La función devuelve verdadero, lo que indica el descubrimiento de un mínimo oscilante, si el mínimo actual es inferior a todos los mínimos cercanos dentro del rango de retrospección. En esencia, garantiza que el mínimo del índice designado sea un mínimo local. Es decir, el punto más bajo del área que lo rodea.
La lógica de la línea de tendencia está controlada por dos entradas esenciales. El primero, allow_uptrend, es un valor booleano que permite a los usuarios elegir si dibujar la línea de tendencia en orden ascendente. El código intentará localizar dos mínimos oscilantes y crear una línea de tendencia que los conecte si se establece como verdadero. LookbackBars, la segunda entrada, especifica cuántas velas se deben examinar a la izquierda y a la derecha de un punto para establecer si se trata de un mínimo oscilante. La función IsSwingLow utiliza el mismo valor retrospectivo. El requisito de oscilación baja se vuelve más sensible con un valor más bajo y más estricto con un valor más alto (requiriendo una caída más severa).
Los valores de precios de los dos mínimos más recientes encontrados en los datos de velas se almacenan en las variables first_low y second_low. Los valores de tiempo en los que se produjeron dichos mínimos oscilantes se almacenan correspondientemente en first_low_time y second_low_time. La línea de tendencia ascendente se dibujará a partir de entonces utilizando estos pares de tiempo-precio. El ID del gráfico actual se almacena en chart_id, y el nombre del objeto de línea de tendencia (una etiqueta simple: "Up Trend") se almacena en la variable up_trend. Al generar o alterar objetos gráficos, como líneas de tendencia, se requiere el ID del gráfico para determinar el contexto del gráfico apropiado.
El EA comienza buscando dos mínimos legítimos cuando allow_uptrend es verdadero. Para evitar el acceso a elementos de la matriz fuera de los límites, el primer bucle «for» recorre los datos de precios desde LookbackBars hasta bars_check - LookbackBars. Para determinar si cada punto es un mínimo, se utiliza la función IsSwingLow. Después de determinar el mínimo legítimo más reciente, registra su precio y hora en first_low y first_low_time antes de finalizar el bucle.
Después de la identificación del primer mínimo, el segundo bucle for utiliza IsSwingLow para continuar el escaneo en la misma dirección, pero esta vez agrega dos requisitos: el segundo mínimo debe ser más bajo que el primero y debe haber ocurrido antes que el primer mínimo. Después de localizar dicho punto, rompe el bucle después de almacenar el precio y el tiempo en second_low y second_low_time. Para crear una línea de tendencia ascendente, el EA primero debe descubrir un mínimo anterior y más bajo y luego un mínimo más nuevo y más alto, lo cual se asegura mediante esta búsqueda de dos pasos.
Luego, el código utiliza ObjectCreate para construir la línea de tendencia ascendente después de identificar ambos mínimos. Utilizando sus respectivas marcas de tiempo, esta función vincula el second_low y el first_low del gráfico. Para evitar dibujar la línea demasiado pronto, primero se oculta para siempre mediante OBJ_NO_PERIODS. Después de confirmar que la estructura es correcta (first_low > second_low y second_low > 0), se utiliza OBJPROP_RAY_RIGHT para extender la línea hacia la derecha, lo que hace que se proyecte hacia adelante en el tiempo. OBJ_ALL_PERIODS también se utiliza para que sea visible en todos los períodos de tiempo.
El color de la línea de tendencia se cambia a azul (clrBlue) y su ancho se establece en tres píxeles para aumentar su claridad visual. Estas mejoras ayudan a que la línea de tendencia se destaque de otros elementos del gráfico y hacen que sea fácil de identificar en el gráfico.
3.3. Identificación de la línea de tendencia descendente
El siguiente paso es duplicar un procedimiento similar para localizar y dibujar una línea de tendencia descendente, ahora que hemos utilizado con éxito la teoría para crear una línea de tendencia ascendente utilizando mínimos oscilantes. Esta vez, sin embargo, nos concentraremos en los máximos y no en los mínimos. Un máximo local es un swing que ocurre cuando un precio es mayor que un número predeterminado de barras circundantes a la izquierda y a la derecha.
Desarrollaremos una función para identificar máximos oscilantes, recorreremos velas históricas para identificar dos máximos legítimos (donde el segundo máximo es más bajo que el primero) y luego dibujaremos una línea de tendencia descendente que conecte estos dos puntos, tal como lo hicimos con la línea de tendencia ascendente. Con su pendiente descendente, esta línea indicará una tendencia bajista y servirá como un posible nivel de resistencia donde los operadores pueden querer vender o anticipar el rechazo del precio.
Ejemplo:// Timeframe to use for retrieving candlestick data (default is the current chart timeframe) input ENUM_TIMEFRAMES time_frame = PERIOD_CURRENT; // Input to enable or disable drawing of the ascending trend line (true = allow drawing) input bool allow_uptrend = true; // Number of candles to look back when identifying swing lows for drawing the trend line input int LookbackBars = 5; // Input to enable or disable drawing of the descebding trend line (true = allow drawing) input bool allow_downtrend = true; // Number of past bars (candlesticks) to check int bars_check = 500; // Arrays to store candlestick data double close_price[]; // Stores close prices double open_price[]; // Stores open prices double low_price[]; // Stores low prices double high_price[]; // Stores high prices datetime time_price[]; // Stores time data for each candle double first_low; // Price value of the first identified swing low datetime first_low_time; // Time when the first swing low occurred double second_low; // Price value of the second identified swing low datetime second_low_time; // Time when the second swing low occurred string up_trend = "Up Trend"; // Label used to name the ascending trend line object on the chart long chart_id = ChartID(); // Stores the current chart ID for referencing during object creation or manipulation double first_high; // Price value of the first identified swing high (latest high) datetime first_high_time; // Time when the first swing high occurred double second_high; // Price value of the second identified swing high (older high) datetime second_high_time; // Time when the second swing high occurred string down_trend = "Down Trend"; // Label used to name the descending trend line object on the chart //+------------------------------------------------------------------+ //| Expert initialization function | //+------------------------------------------------------------------+ int OnInit() { // Set arrays as series so the newest bar is index 0 ( start from the latest bar) ArraySetAsSeries(close_price, true); ArraySetAsSeries(open_price, true); ArraySetAsSeries(low_price, true); ArraySetAsSeries(high_price, true); ArraySetAsSeries(time_price, true); return(INIT_SUCCEEDED); // Signal that the EA initialized successfully } //+------------------------------------------------------------------+ //| Expert deinitialization function | //+------------------------------------------------------------------+ void OnDeinit(const int reason) { ObjectsDeleteAll(chart_id); } //+------------------------------------------------------------------+ //| Expert tick function | //+------------------------------------------------------------------+ void OnTick() { // Copy the latest candlestick data into the arrays CopyOpen(_Symbol, time_frame, 1, bars_check, open_price); // Open prices CopyClose(_Symbol, time_frame, 1, bars_check, close_price); // Close prices CopyLow(_Symbol, time_frame, 1, bars_check, low_price); // Low prices CopyHigh(_Symbol, time_frame, 1, bars_check, high_price); // High prices CopyTime(_Symbol, time_frame, 1, bars_check, time_price); // Candle times // If the user allows drawing of ascending trend line if(allow_uptrend) { // First loop: Find the most recent swing low (first low) for(int i = LookbackBars; i < bars_check - LookbackBars; i++) { // Check if current point is a swing low if(IsSwingLow(low_price, i, LookbackBars)) { // Store price and time of the first (latest) swing low first_low = low_price[i]; first_low_time = time_price[i]; break; // Exit loop after finding the first swing low } } // Second loop: Find an earlier swing low that is lower than the first low for(int i = LookbackBars; i < bars_check - LookbackBars; i++) { // Check for earlier swing low that is lower and occurs before the first low if(IsSwingLow(low_price, i, LookbackBars) && low_price[i] < first_low && time_price[i] < first_low_time) { // Store price and time of the second (older) swing low second_low = low_price[i]; second_low_time = time_price[i]; break; // Exit loop after finding the second swing low } } // Create an ascending trend line from the second low to the first low ObjectCreate(chart_id, up_trend, OBJ_TREND, 0, second_low_time, second_low, first_low_time, first_low); ObjectSetInteger(chart_id, up_trend, OBJPROP_TIMEFRAMES, OBJ_NO_PERIODS); // Temporarily hide line on all timeframes // If the swing structure is valid (i.e., second low is lower than first) if(first_low > second_low && second_low > 0) { // Extend the trend line to the right ObjectSetInteger(chart_id, up_trend, OBJPROP_RAY_RIGHT, true); // Show the trend line on all timeframes ObjectSetInteger(chart_id, up_trend, OBJPROP_TIMEFRAMES, OBJ_ALL_PERIODS); // Set visual properties: color and thickness ObjectSetInteger(chart_id, up_trend, OBJPROP_COLOR, clrBlue); ObjectSetInteger(chart_id, up_trend, OBJPROP_WIDTH, 3); } } // // Only proceed if drawing descending trend lines is enabled if(allow_downtrend) { // First loop: Find the most recent swing high (first high) for(int i = LookbackBars; i < bars_check - LookbackBars; i++) { // Check if the current bar is a swing high if(IsSwingHigh(high_price, i, LookbackBars)) { // Store the price and time of this latest swing high first_high = high_price[i]; first_high_time = time_price[i]; break; // Exit loop once the first swing high is found } } // Second loop: Find an earlier swing high that is higher than the first high and occurred before it for(int i = LookbackBars; i < bars_check - LookbackBars; i++) { // Check for earlier swing high that is higher and happened before the first one if(IsSwingHigh(high_price, i, LookbackBars) && high_price[i] > first_high && time_price[i] < first_high_time) { // Store the price and time of this older swing high second_high = high_price[i]; second_high_time = time_price[i]; break; // Exit loop once the second swing high is found } } // Create a trend line object from the second swing high to the first swing high ObjectCreate(chart_id, down_trend, OBJ_TREND, 0, second_high_time, second_high, first_high_time, first_high); // Initially hide the trend line across all timeframes to avoid partial drawing ObjectSetInteger(chart_id, down_trend, OBJPROP_TIMEFRAMES, OBJ_NO_PERIODS); // Validate the swing structure: // The older swing high should be higher than the later swing high to confirm a descending trend line if(first_high < second_high && second_high > 0) { // Extend the trend line indefinitely to the right for better visual guidance ObjectSetInteger(chart_id, down_trend, OBJPROP_RAY_RIGHT, true); // Make the trend line visible on all chart timeframes ObjectSetInteger(chart_id, down_trend, OBJPROP_TIMEFRAMES, OBJ_ALL_PERIODS); // Set the trend line color to dark green for clear distinction ObjectSetInteger(chart_id, down_trend, OBJPROP_COLOR, clrDarkGreen); // Set the thickness of the trend line to 3 pixels for better visibility ObjectSetInteger(chart_id, down_trend, OBJPROP_WIDTH, 3); } } } //+------------------------------------------------------------------+ //| FUNCTION FOR LOWS | //+------------------------------------------------------------------+ bool IsSwingLow(const double &low[], int index, int lookback) { for(int i = 1; i <= lookback; i++) { if(low[index] > low[index - i] || low[index] > low[index + i]) return false; } return true; } //+------------------------------------------------------------------+ //| FUNCTION FOR HIGHS | //+------------------------------------------------------------------+ bool IsSwingHigh(const double &high[], int index, int lookback) { for(int i = 1; i <= lookback; i++) { if(high[index] < high[index - i] || high[index] < high[index + i]) return false; } return true; }
Resultado:

Explicación:
Al comparar el precio alto de una barra con los máximos de las barras cercanas durante un período de retrospección predeterminado, la función IsSwingHigh determina si una barra determinada es un máximo oscilante. La barra devuelve verdadero, lo que confirma un pico local, si su altura es mayor que la de cualquiera de estos vecinos; si no, devuelve falso. La línea de tendencia descendente en el gráfico se puede dibujar o deshabilitar utilizando la variable de entrada allow_downtrend.
El código busca inicialmente el máximo más reciente, o first_high, y registra su precio y hora para determinar la línea de tendencia descendente. Luego busca un máximo anterior (second_high) que precedió al primero y fue más alto. La línea de tendencia que conecta estos dos puntos se denomina, por lo tanto, "Tendencia Bajista". Una línea de tendencia bajista se hace evidente cuando un máximo reciente es inferior a uno anterior, lo que confirma una tendencia bajista. Conecta máximos más bajos, está diseñado para ser visible y se extiende hacia adelante en el gráfico. Esta lógica es esencialmente la opuesta a una línea de tendencia ascendente, que vincula mínimos más altos para mostrar una tendencia alcista.
4. Ejecución de operaciones basadas en rupturas y reversiones de líneas de tendencia
En el último capítulo analizamos cómo utilizar los puntos de oscilación importantes del gráfico de precios para construir programáticamente líneas de tendencia ascendentes y descendentes. Sobre esa base, en este capítulo analizaremos cómo ejecutar operaciones basadas en rupturas y reversiones de líneas de tendencia. Veremos específicamente cómo reconocer cuándo el precio cruza ciertas líneas de tendencia o revierte su curso, así como también cómo utilizar estos indicadores para ingresar o salir de operaciones de manera eficiente.
4.1. Líneas de tendencia ascendentes
Hasta ahora sólo nos hemos concentrado en identificar el primer y el segundo mínimo para construir la línea de tendencia ascendente. Sin embargo, ¿cómo podemos determinar cuándo el mercado rompe y podría volver a probar la línea de tendencia, o cuándo la toca y se revierte? Para basar las decisiones comerciales en cómo interactúa el precio con la línea de tendencia, esta etapa es esencial. Afortunadamente, gracias a las funciones integradas que nos permiten obtener el nivel de precios de una línea de tendencia en un momento determinado o un índice de barras, MQL5 ha hecho que este proceso sea más sencillo.
Para tomar decisiones comerciales más informadas, en esta sección repasaremos cómo reconocer cuándo el precio se acerca o cruza una línea de tendencia ascendente. Analizaremos las herramientas que ofrece MQL5, ya sea que estés intentando capturar un rebote en el soporte o una entrada de ruptura y nueva prueba. Nos concentraremos en examinar las últimas cuatro barras del gráfico porque las rupturas y las reversiones generalmente ocurren dentro de las velas más recientes. En la mayoría de los casos, estas barras recientes mostrarán indicaciones de que una línea de tendencia se está rompiendo o respetando.
En consecuencia, examinaremos cuidadosamente si las cuatro barras más recientes satisfacen los requisitos para una ruptura o una reversión, en lugar de revisar el historial completo del gráfico. Podemos responder a nuevos movimientos del mercado y tomar decisiones comerciales informadas con esta estrategia. Utilizaremos MQL5 para implementar programáticamente este razonamiento en las partes que siguen.
Ejemplo:double t_line_value; // Ascending trend line price level at the time of the most recent bar (not the ticking bar) double t1_line_value; // Ascending trend line price level at the time of the second most recent bar double t2_line_value; // Ascending trend line price level at the time of the third most recent bar double t3_line_value; // Ascending trend line price level at the time of the fourth most recent bar
if(allow_uptrend)
  {
// First loop: Find the most recent swing low (first low)
   for(int i = LookbackBars; i < bars_check - LookbackBars; i++)
     {
      // Check if current point is a swing low
      if(IsSwingLow(low_price, i, LookbackBars))
        {
         // Store price and time of the first (latest) swing low
         first_low = low_price[i];
         first_low_time = time_price[i];
         break;  // Exit loop after finding the first swing low
        }
     }

// Second loop: Find an earlier swing low that is lower than the first low
   for(int i = LookbackBars; i < bars_check - LookbackBars; i++)
     {
      // Check for earlier swing low that is lower and occurs before the first low
      if(IsSwingLow(low_price, i, LookbackBars) && low_price[i] < first_low && time_price[i] < first_low_time)
        {
         // Store price and time of the second (older) swing low
         second_low = low_price[i];
         second_low_time = time_price[i];
         break;  // Exit loop after finding the second swing low
        }
     }

// Create an ascending trend line from the second low to the first low
   ObjectCreate(chart_id, up_trend, OBJ_TREND, 0, second_low_time, second_low, first_low_time, first_low);
   ObjectSetInteger(chart_id, up_trend, OBJPROP_TIMEFRAMES, OBJ_NO_PERIODS);  // Temporarily hide line on all timeframes

// If the swing structure is valid (i.e., second low is lower than first)
   if(first_low > second_low && second_low > 0)
     {
      // Extend the trend line to the right
      ObjectSetInteger(chart_id, up_trend, OBJPROP_RAY_RIGHT, true);

      // Show the trend line on all timeframes
      ObjectSetInteger(chart_id, up_trend, OBJPROP_TIMEFRAMES, OBJ_ALL_PERIODS);

      // Set visual properties: color and thickness
      ObjectSetInteger(chart_id, up_trend, OBJPROP_COLOR, clrBlue);
      ObjectSetInteger(chart_id, up_trend, OBJPROP_WIDTH, 3);


      // Get the price values of the trend line at the corresponding times of the four most recent bars
      t_line_value = ObjectGetValueByTime(chart_id, up_trend, time_price[0], 0);   // Current bar
      t1_line_value = ObjectGetValueByTime(chart_id, up_trend, time_price[1], 0);  // One bar ago
      t2_line_value = ObjectGetValueByTime(chart_id, up_trend, time_price[2], 0);  // Two bars ago
      t3_line_value = ObjectGetValueByTime(chart_id, up_trend, time_price[3], 0);  // Three bars ago

      Comment("Ascending trend tine value for the last 4 Bars",
              "\nBar 0: ",  DoubleToString(t_line_value, _Digits),
              "\nBar 1: ", DoubleToString(t1_line_value, _Digits),
              "\nBar 2: ",  DoubleToString(t2_line_value, _Digits),
              "\nBar 3: ",  DoubleToString(t3_line_value, _Digits));

     }
  }
Resultado:

Explicación:
La función ObjectGetValueByTime(), que produce el nivel de precio del objeto gráfico designado (en este caso, la línea de tendencia) en un momento específico, se utiliza para obtener el valor de la línea de tendencia. Esto nos permite determinar la ubicación de la línea de tendencia al cierre de cada una de las barras más recientes.
Para ello utilizamos cuatro variables distintas. El valor de la línea de tendencia en la barra 0, que es la barra completada más reciente en lugar de la que se está construyendo activamente (comúnmente conocida como la "barra de ticking"), se almacena en la variable t_line_value. El nivel de la línea de tendencia en la barra 1, o la barra inmediatamente anterior a la más reciente, se almacena en la variable t1_line_value. Los valores de la línea de tendencia de las barras 2 y 3, que reflejan barras que cerraron hace dos y tres períodos, respectivamente, se almacenan de manera similar en t2_line_value y t3_line_value.
Cabe señalar que, aunque llamamos a time_price[0] "barra 0", en realidad aparece en el gráfico como la segunda barra desde la derecha. Esto se debe a que no utilizamos la barra final, la que está más a la derecha, en nuestro análisis porque todavía está creciendo y no se ha cerrado. La forma en que utilizamos la función CopyTime() anteriormente en el código, donde la copia comenzaba en el índice 1 y omitía la barra actual (sin cerrar) para obtener datos más fiables, también es coherente con este patrón. Para facilitar la revisión o la depuración, el código imprime estos valores de la línea de tendencia directamente en el gráfico mediante la función Comment(). Esta salida le permite observar cómo actúa la línea de tendencia en relación con las barras más recientes y se muestra en el área superior izquierda de la ventana del gráfico. Es especialmente útil para determinar si la línea de tendencia es el sitio de una ruptura o de una reversión.
4.1.1. Ejecución de operaciones con línea de tendencia ascendente
El siguiente paso es proporcionar la lógica que decide cuándo ejecutar una operación, ya sea una ruptura o una reversión, ahora que sabemos cómo extraer con precisión los valores de la línea de tendencia en el momento de las barras cerradas más recientes. Ahora podemos determinar qué está sucediendo en la línea de tendencia comparando los valores de la línea de tendencia de las barras más recientes con el movimiento de precios real, como los cierres de velas o los mínimos/máximos.
4.1.1.1. Reversión
Ahora nos toca a nosotros especificar la lógica para realizar operaciones basadas en señales de reversión, ya que ahora sabemos cómo obtener los valores de precios de la línea de tendencia en varios tiempos de barra. Para determinar si el mercado ha respetado la línea de tendencia y se está revirtiendo, se comparan los precios actuales de las barras con los valores correspondientes de la línea de tendencia. Busque un rebote desde la línea de tendencia, aunque este concepto parezca obvio. Implementarlo con precisión puede ser un poco más difícil. Las reversiones pueden tener muchas estructuras y frecuentemente son sutiles. A veces, todo el cuerpo de la vela puede descansar sobre la línea de tendencia, mientras que en otras ocasiones, la vela puede simplemente penetrar en la línea y cerrar por encima de ella. A veces, el precio incluso cae por debajo de cierto nivel y luego retrocede violentamente, un fenómeno llamado ruptura falsa.
Los parámetros necesarios para identificar con precisión una reversión real pueden complicarse como resultado de estas variaciones. Además de la posición de la vela actual, también se debe considerar la forma en que varias velas interactúan con la línea de tendencia. Esto podría implicar verificar con indicadores de apoyo como patrones de velas alcistas, asegurarse de que no haya un cierre significativo por debajo de la línea de tendencia y ver si los mínimos de las velas recientes están tocando o rebotando en la línea. Para minimizar las señales falsas, estas condiciones en capas requieren una lógica de programación cuidadosa y hacen que la detección de reversiones con líneas de tendencia sea más compleja.
A continuación se presentan algunas condiciones de reversión válidas:
Rechazo de mecha y reversión alcista en la línea de tendencia ascendente: 
Como puedes ver, la vela se revirtió instantáneamente hacia arriba después de que solo la mecha tocó la línea de tendencia ascendente. Esto demuestra que el precio fue rápidamente rechazado cuando desafió la línea de tendencia como soporte. La reversión se ve respaldada además por el hecho de que la misma barra cerró más tarde como una vela alcista. Debido a que muestra una fuerte reacción de los compradores en un nivel de soporte crucial, este tipo de acción del precio donde la mecha interactúa con la línea de tendencia, pero el cuerpo cierra bruscamente en la otra dirección es un requisito legítimo para realizar una operación de compra.
Toque de mecha de vela bajista seguido de confirmación alcista:

La mecha de una vela bajista tocó la línea de tendencia ascendente en el gráfico anterior y la vela cerró por encima de la línea. Sin embargo, la vela no satisface instantáneamente la necesidad de una entrada de reversión porque es bajista. La vela alcista inmediatamente siguiente proporciona confirmación. Esta vela alcista es una condición legítima para ejecutar una operación de compra, ya que indica que los compradores han intervenido siguiendo el contacto de la línea de tendencia. Para validar la reversión, debe estar presente una barra alcista.
Múltiples cierres bajistas antes de la confirmación de una reversión alcista:

Una vela bajista cerró por encima de la línea de tendencia ascendente cuando su mecha la tocó. A pesar de ser bajista también, la siguiente vela cerró por encima de la línea de tendencia. Una vela alcista que satisfacía los requisitos para una entrada de reversión no se formó hasta la tercera vela. El mercado obedeció la línea de tendencia, pero fueron necesarias algunas velas para que los alcistas tomaran el control, como demuestra esta configuración. Una posible operación de compra se confirma con la última vela alcista.
Falsa ruptura de reversión con confirmación alcista inmediata: 
Un avance potencial podría estar indicado por el hecho de que la primera vela que tocó la línea de tendencia ascendente cerró por debajo de ella. La vela que siguió, sin embargo, fue una poderosa vela alcista que cerró por encima de la línea de tendencia. Esta reacción rápida es crucial, ya que la vela alcista que se desarrolló justo después del toque respalda la reversión. El mercado todavía considera la línea de tendencia como soporte, como lo demuestra la reacción alcista instantánea, a pesar de un breve cierre por debajo de ella. Por lo tanto, se trata de una configuración legítima para una operación de compra.
Existen condiciones particulares que hacen que una reversión en la línea de tendencia sea inválida, así como existen muchas condiciones que la justifican. Podemos evitar malas operaciones y alertas erróneas gracias a estas circunstancias incorrectas. También son esenciales para evitar la ejecución de varias operaciones en un breve período de tiempo que sean provocadas por señales similares o repetidas. Esto mantiene nuestro enfoque disciplinado y evita el exceso de operaciones.
Reversión no válida después de una ruptura confirmada:

La línea de tendencia ascendente ya ha sido cruzada por dos velas bajistas. Una vela alcista ya no califica como un indicador de reversión legítimo, incluso si finalmente termina por encima de la línea de tendencia. La ruptura se considera confirmada porque la estructura ya ha sido violada. Cualquier actividad alcista adicional se considera ruido o una posible nueva prueba y no se considera una entrada legítima.
Cómo prevenir señales comerciales repetitivas en múltiples reversiones:

Cada una de las tres velas alcistas en la imagen anterior tiene una mecha que toca la línea de tendencia ascendente antes de revertirse hacia arriba. El algoritmo podría ejecutar varias operaciones por cada toque si no se dan las condiciones adecuadas para filtrar dichos patrones, incluso si todos son parte del mismo movimiento de reversión amplio. En estas situaciones, es fundamental crear una lógica que restrinja la ejecución comercial a la primera señal válida.
Su lógica debe ser examinada y considerada a fondo para esta y una serie de otras situaciones comparables. Pueden dar lugar a entradas retrasadas, operaciones repetidas o señales falsas si se manejan de forma inadecuada. Se deben implementar requisitos de validación estrictos para evitar ejecuciones comerciales innecesarias o duplicadas durante señales densamente cargadas, además de verificar situaciones de reversión legítimas.
Ejemplo:
#include <Trade/Trade.mqh>
CTrade trade;
int MagicNumber = 532127;


// Timeframe to use for retrieving candlestick data (default is the current chart timeframe)
input ENUM_TIMEFRAMES time_frame = PERIOD_CURRENT;
// Input to enable or disable drawing of the ascending trend line (true = allow drawing)
input bool allow_uptrend = true;
// Number of candles to look back when identifying swing lows for drawing the trend line
input int LookbackBars = 5;

// Input to enable or disable drawing of the descebding trend line (true = allow drawing)
input bool allow_downtrend = true;
input bool allow_break_out = true;    // Enable or disable trade execution on trend line breakout (true = allow)
input bool allow_reversal = true;     // Enable or disable trade execution on trend line reversal (true = allow)
input double lot_size = 0.6;          // Lot size for each trade
input double sl_points = 10;          // Stop Loss in points from entry price
input double tp_points = 50;          // Take Profit in points from entry price

// Number of past bars (candlesticks) to check
int bars_check = 500;

// Arrays to store candlestick data
double close_price[];   // Stores close prices
double open_price[];    // Stores open prices
double low_price[];     // Stores low prices
double high_price[];    // Stores high prices
datetime time_price[];  // Stores time data for each candle

double first_low;           // Price value of the first identified swing low
datetime first_low_time;    // Time when the first swing low occurred

double second_low;          // Price value of the second identified swing low
datetime second_low_time;   // Time when the second swing low occurred
string up_trend = "Up Trend";  // Label used to name the ascending trend line object on the chart
long chart_id = ChartID();     // Stores the current chart ID for referencing during object creation or manipulation
double first_high;          // Price value of the first identified swing high (latest high)
datetime first_high_time;   // Time when the first swing high occurred
double second_high;         // Price value of the second identified swing high (older high)
datetime second_high_time;  // Time when the second swing high occurred
string down_trend = "Down Trend";  // Label used to name the descending trend line object on the chart
double t_line_value;   // Ascending trend line price level at the time of the most recent bar (not the ticking bar)
double t1_line_value;  // Ascending trend line price level at the time of the second most recent bar
double t2_line_value;  // Ascending trend line price level at the time of the third most recent bar
double t3_line_value;  // Ascending trend line price level at the time of the fourth most recent bar

// Time boundary used to limit lookback for valid reversal setups
datetime lookbackf_time;

datetime lastTradeBarTime = 0;

//+------------------------------------------------------------------+
//| Expert initialization function                                   |
//+------------------------------------------------------------------+
int OnInit()
  {
// Set arrays as series so the newest bar is index 0 ( start from the latest bar)
   ArraySetAsSeries(close_price, true);
   ArraySetAsSeries(open_price, true);
   ArraySetAsSeries(low_price, true);
   ArraySetAsSeries(high_price, true);
   ArraySetAsSeries(time_price, true);

   trade.SetExpertMagicNumber(MagicNumber);

   return(INIT_SUCCEEDED);  // Signal that the EA initialized successfully
  }

//+------------------------------------------------------------------+
//| Expert deinitialization function                                 |
//+------------------------------------------------------------------+
void OnDeinit(const int reason)
  {

   ObjectsDeleteAll(chart_id);

  }

//+------------------------------------------------------------------+
//| Expert tick function                                             |
//+------------------------------------------------------------------+
void OnTick()
  {
// Copy the latest candlestick data into the arrays
   CopyOpen(_Symbol, time_frame, 1, bars_check, open_price);     // Open prices
   CopyClose(_Symbol, time_frame, 1, bars_check, close_price);   // Close prices
   CopyLow(_Symbol, time_frame, 1, bars_check, low_price);       // Low prices
   CopyHigh(_Symbol, time_frame, 1, bars_check, high_price);     // High prices
   CopyTime(_Symbol, time_frame, 1, bars_check, time_price);     // Candle times

   double ask_price = SymbolInfoDouble(_Symbol,SYMBOL_ASK);
   datetime currentBarTime = iTime(_Symbol, time_frame, 0);

// If the user allows drawing of ascending trend line
   if(allow_uptrend)
     {
      // First loop: Find the most recent swing low (first low)
      for(int i = LookbackBars; i < bars_check - LookbackBars; i++)
        {
         // Check if current point is a swing low
         if(IsSwingLow(low_price, i, LookbackBars))
           {
            // Store price and time of the first (latest) swing low
            first_low = low_price[i];
            first_low_time = time_price[i];
            lookbackf_time = time_price[i - 3];

            break;  // Exit loop after finding the first swing low
           }
        }

      // Second loop: Find an earlier swing low that is lower than the first low
      for(int i = LookbackBars; i < bars_check - LookbackBars; i++)
        {
         // Check for earlier swing low that is lower and occurs before the first low
         if(IsSwingLow(low_price, i, LookbackBars) && low_price[i] < first_low && time_price[i] < first_low_time)
           {
            // Store price and time of the second (older) swing low
            second_low = low_price[i];
            second_low_time = time_price[i];
            break;  // Exit loop after finding the second swing low
           }
        }

      // Create an ascending trend line from the second low to the first low
      ObjectCreate(chart_id, up_trend, OBJ_TREND, 0, second_low_time, second_low, first_low_time, first_low);
      ObjectSetInteger(chart_id, up_trend, OBJPROP_TIMEFRAMES, OBJ_NO_PERIODS);  // Temporarily hide line on all timeframes

      // If the swing structure is valid (i.e., second low is lower than first)
      if(first_low > second_low && second_low > 0)
        {
         // Extend the trend line to the right
         ObjectSetInteger(chart_id, up_trend, OBJPROP_RAY_RIGHT, true);

         // Show the trend line on all timeframes
         ObjectSetInteger(chart_id, up_trend, OBJPROP_TIMEFRAMES, OBJ_ALL_PERIODS);

         // Set visual properties: color and thickness
         ObjectSetInteger(chart_id, up_trend, OBJPROP_COLOR, clrBlue);
         ObjectSetInteger(chart_id, up_trend, OBJPROP_WIDTH, 3);

         // Get the price values of the trend line at the corresponding times of the four most recent bars
         t_line_value = ObjectGetValueByTime(chart_id, up_trend, time_price[0], 0);   // Current bar
         t1_line_value = ObjectGetValueByTime(chart_id, up_trend, time_price[1], 0);  // One bar ago
         t2_line_value = ObjectGetValueByTime(chart_id, up_trend, time_price[2], 0);  // Two bars ago
         t3_line_value = ObjectGetValueByTime(chart_id, up_trend, time_price[3], 0);  // Three bars ago

         // Number of bars between the valid bullish confirmation candle and current time
         int no_bars = 0;

         // Loop through the last 4 bars to check for reversal wick touch on the trend line
         for(int i = 0; i <= 3; i++)
           {
            // Condition: Wick of the candle touches below the trend line but opens above it (indicating a potential reversal zone)
            if(low_price[i] < ObjectGetValueByTime(chart_id, up_trend, time_price[i], 0) &&
               open_price[i] > ObjectGetValueByTime(chart_id, up_trend, time_price[i], 0))
              {
               // Check if there's a bullish confirmation candle after the wick touch (within or immediately after)
               for(int j = i; j >= 0; j--)
                 {
                  // Bullish candle that closed above the trend line
                  if(close_price[j] > open_price[j] &&
                     close_price[j] > ObjectGetValueByTime(chart_id, up_trend, time_price[j], 0))
                    {
                     // Count how many bars ago this confirmation occurred
                     no_bars = Bars(_Symbol, time_frame, time_price[j], TimeCurrent());
                     break;
                    }
                 }
               break; // Exit after first valid reversal zone is found
              }
           }

         // Check whether a similar wick touch (reversal) happened recently to avoid repeated signals
         bool prev_touch = false;

         if((low_price[1] < t1_line_value && close_price[1] > open_price[1]) ||  // Bar 1 had reversal wick and bullish body
            (low_price[2] < t2_line_value && close_price[2] > open_price[2]))    // Bar 2 had reversal wick and bullish body
           {
            prev_touch = true;  // Flag that a recent touch already occurred
           }

         // Final condition for executing a BUY trade on a reversal setup
         if(
            // One of the recent 4 bars touched and rejected the trend line (wick below, open above), AND
            ((low_price[0] < t_line_value && open_price[0] > t_line_value) ||
             (low_price[1] < t1_line_value && open_price[1] > t1_line_value) ||
             (low_price[2] < t2_line_value && open_price[2] > t2_line_value) ||
             (low_price[3] < t3_line_value && open_price[3] > t3_line_value))
            &&
            // Current candle must be bullish and close above the trend line
            (close_price[0] > open_price[0]) && close_price[0] > t_line_value
            &&
            // The bullish confirmation must occur within 3 bars
            (no_bars < 3)
            &&
            // No recent wick reversal signal already processed
            prev_touch == false
            &&
            // The signal must be more recent than the lookback time threshold
            (time_price[3] > lookbackf_time)
            &&
            // Reversal signals are allowed and this signal is not duplicated from the same bar
            (allow_reversal == true && currentBarTime != lastTradeBarTime)
         )
           {
            // Execute BUY trade with defined lot size, SL and TP
            trade.Buy(lot_size, _Symbol, ask_price, ask_price - sl_points, ask_price + tp_points);
            lastTradeBarTime = currentBarTime; // Update last trade bar time to avoid duplicate signals
           }
        }
     }

//
// Only proceed if drawing descending trend lines is enabled
   if(allow_downtrend)
     {
      // First loop: Find the most recent swing high (first high)
      for(int i = LookbackBars; i < bars_check - LookbackBars; i++)
        {
         // Check if the current bar is a swing high
         if(IsSwingHigh(high_price, i, LookbackBars))
           {
            // Store the price and time of this latest swing high
            first_high = high_price[i];
            first_high_time = time_price[i];

            break;  // Exit loop once the first swing high is found
           }
        }

      // Second loop: Find an earlier swing high that is higher than the first high and occurred before it
      for(int i = LookbackBars; i < bars_check - LookbackBars; i++)
        {
         // Check for earlier swing high that is higher and happened before the first one
         if(IsSwingHigh(high_price, i, LookbackBars) && high_price[i] > first_high && time_price[i] < first_high_time)
           {
            // Store the price and time of this older swing high
            second_high = high_price[i];
            second_high_time = time_price[i];

            break;  // Exit loop once the second swing high is found
           }
        }

      // Create a trend line object from the second swing high to the first swing high
      ObjectCreate(chart_id, down_trend, OBJ_TREND, 0, second_high_time, second_high, first_high_time, first_high);

      // Initially hide the trend line across all timeframes to avoid partial drawing
      ObjectSetInteger(chart_id, down_trend, OBJPROP_TIMEFRAMES, OBJ_NO_PERIODS);

      // Validate the swing structure:
      // The older swing high should be higher than the later swing high to confirm a descending trend line
      if(first_high < second_high && second_high > 0)
        {
         // Extend the trend line indefinitely to the right for better visual guidance
         ObjectSetInteger(chart_id, down_trend, OBJPROP_RAY_RIGHT, true);

         // Make the trend line visible on all chart timeframes
         ObjectSetInteger(chart_id, down_trend, OBJPROP_TIMEFRAMES, OBJ_ALL_PERIODS);

         // Set the trend line color to dark green for clear distinction
         ObjectSetInteger(chart_id, down_trend, OBJPROP_COLOR, clrDarkGreen);

         // Set the thickness of the trend line to 3 pixels for better visibility
         ObjectSetInteger(chart_id, down_trend, OBJPROP_WIDTH, 3);

        }
     }
  }

//+------------------------------------------------------------------+
//| FUNCTION FOR LOWS                                                |
//+------------------------------------------------------------------+
bool IsSwingLow(const double &low[], int index, int lookback)
  {

   for(int i = 1; i <= lookback; i++)
     {

      if(low[index] > low[index - i] || low[index] > low[index + i])
         return false;
     }
   return true;
  }

//+------------------------------------------------------------------+
//| FUNCTION FOR HIGHS                                               |
//+------------------------------------------------------------------+
bool IsSwingHigh(const double &high[], int index, int lookback)
  {

   for(int i = 1; i <= lookback; i++)
     {
      if(high[index] < high[index - i] || high[index] < high[index + i])
         return false;
     }
   return true;
  }
Resultado:


Explicación:
Para acceder a la clase CTrade, que se utiliza para realizar y administrar transacciones en MQL5, el código primero incluye la biblioteca de transacciones Trade.mqh. Así como Buy() y Sell() realizan operaciones comerciales, se construye un objeto CTrade llamado comercio. Para diferenciar las transacciones ejecutadas por este Asesor Experto específico de otras, el ordenador asigna al EA un número mágico único. SetExpertMagicNumber() se utiliza para establecer este valor.
A continuación se especifican una serie de parámetros de entrada. Estos permiten al usuario alterar el comportamiento del EA sin cambiar el código principal. Para regular si se deben permitir operaciones en situaciones de tendencia bajista, en patrones de ruptura o en configuraciones de reversión, por ejemplo, se utilizan los interruptores de encendido/apagado allow_downtrend, allow_break_out y allow_reversal. Mientras que sl_points y tp_points especifican la distancia en puntos entre el stop loss y el take profit del precio de entrada, el parámetro lot_size establece el tamaño de cada posición.
Para el control de tiempo, se utilizan dos variables: lookbackf_time y lastTradeBarTime. Hasta qué punto en el tiempo debe el software buscar configuraciones de inversión legítimas está determinado por lookbackf_time. En este punto, no se tienen en cuenta ninguna configuración anterior. Para ayudar a eliminar señales redundantes o duplicadas, se utiliza la variable lastTradeBarTime para evitar realizar múltiples operaciones en la misma vela.
int no_bars = 0;
for(int i = 0; i <= 3; i++)
  {
   if(low_price[i] < ObjectGetValueByTime(chart_id, up_trend, time_price[i], 0) &&
      open_price[i] > ObjectGetValueByTime(chart_id, up_trend, time_price[i], 0))
     {
      for(int j = i; j >= 0; j--)
        {
         if(close_price[j] > open_price[j] &&
            close_price[j] > ObjectGetValueByTime(chart_id, up_trend, time_price[j], 0))
           {
            no_bars = Bars(_Symbol, time_frame, time_price[j], TimeCurrent());
            break;
           }
        }
      break;
     }
  }
En esta parte se escanean las últimas cuatro velas (barras 0 a 3) para ver si alguna de ellas mostró un comportamiento de mecha que indicaría una señal de reversión: el mínimo se rompió por debajo de la línea de tendencia, pero la apertura se mantuvo por encima de ella. Esto implica que la línea de tendencia ha sido rechazada. Una vez identificada dicha vela, el bucle interno busca una vela de confirmación alcista, que es aquella que cerró por encima tanto de la línea de apertura como de la de tendencia. Si se encuentra, utiliza Bars() para determinar cuántas barras atrás ocurrió esa confirmación y guarda el resultado en no_bars.
bool prev_touch = false;
if((low_price[1] < t1_line_value && close_price[1] > open_price[1]) ||
   (low_price[2] < t2_line_value && close_price[2] > open_price[2])) {
    prev_touch = true;
}
Este bloque determina si las velas 1 o 2 ya han tocado la línea de tendencia y han cerrado alcista, para evitar advertencias repetidas o prematuras. Prev_touch se establece como verdadero si cualquiera de las dos condiciones es verdadera, lo que sugiere que es posible que se haya producido una reversión recientemente y que se debe ignorar otra señal en la barra actual.
if(
   ((low_price[0] < t_line_value && open_price[0] > t_line_value) ||
    (low_price[1] < t1_line_value && open_price[1] > t1_line_value) ||
    (low_price[2] < t2_line_value && open_price[2] > t2_line_value) ||
    (low_price[3] < t3_line_value && open_price[3] > t3_line_value))
   &&
   (close_price[0] > open_price[0]) && close_price[0] > t_line_value
   &&
   (no_bars < 3)
   &&
   prev_touch == false
   &&
   (time_price[3] > lookbackf_time)
   &&
   (allow_reversal == true && currentBarTime != lastTradeBarTime)
)
  {
   trade.Buy(lot_size, _Symbol, ask_price, ask_price - sl_points, ask_price + tp_points);
   lastTradeBarTime = currentBarTime;
  }
Primero verifica que al menos una de las últimas cuatro velas mostró un comportamiento de mecha, que es cuando el precio tocó la línea de tendencia pero abrió por encima de ella, lo que sugiere una posible zona de rechazo; luego requiere que la vela actual sea alcista y haya cerrado por encima de la línea de tendencia, fortaleciendo la señal; y finalmente, requiere que la vela de confirmación alcista que se identificó previamente haya ocurrido dentro de las últimas tres barras para garantizar que la configuración siga siendo válida. Este bloque condicional verifica si se debe ejecutar una operación de compra revertida verificando una serie de criterios importantes.
El algoritmo verifica que no se haya detectado recientemente ninguna señal táctil basada en mecha comparable, por lo tanto, prev_touch debe ser falso para evitar entradas repetidas. Además, se asegura de que la configuración sea más reciente que el lookbackf_time que se proporciona, lo que restringe el rango de señales que el programa acepta como legítimas.
Por último, al verificar que currentBarTime no sea igual a lastTradeBarTime, se evita la duplicación y se verifica que se permitan transacciones de reversión (allow_reversal es verdadero) y que no se haya realizado ninguna operación en la misma vela. Se ejecuta una orden de compra con el tamaño de lote designado, los valores de stop loss y take profit si se cumplen todos estos requisitos. Para evitar que se realicen más operaciones en la misma vela, lastTradeBarTime se actualiza a la hora de la barra actual.
4.1.1.2. Ruptura y nueva prueba
Las configuraciones de ruptura y nueva prueba alrededor de una línea de tendencia ascendente siguen criterios de colocación de órdenes similares a los de las reversiones. El precio podría retroceder para volver a probar el soporte roto, que ahora sirve como resistencia, después de romper por debajo de la línea de tendencia. Una vela con mucho cuerpo o simplemente una mecha que golpea la línea de tendencia puede desencadenar esta nueva prueba. La ruptura se puede confirmar colocando una orden de venta si la nueva prueba es exitosa y el precio es rechazado.

Ejemplo:
// If the user allows drawing of ascending trend line
if(allow_uptrend)
  {
// First loop: Find the most recent swing low (first low)
   for(int i = LookbackBars; i < bars_check - LookbackBars; i++)
     {
      // Check if current point is a swing low
      if(IsSwingLow(low_price, i, LookbackBars))
        {
         // Store price and time of the first (latest) swing low
         first_low = low_price[i];
         first_low_time = time_price[i];
         lookbackf_time = time_price[i - 3];

         break;  // Exit loop after finding the first swing low
        }
     }

// Second loop: Find an earlier swing low that is lower than the first low
   for(int i = LookbackBars; i < bars_check - LookbackBars; i++)
     {
      // Check for earlier swing low that is lower and occurs before the first low
      if(IsSwingLow(low_price, i, LookbackBars) && low_price[i] < first_low && time_price[i] < first_low_time)
        {
         // Store price and time of the second (older) swing low
         second_low = low_price[i];
         second_low_time = time_price[i];
         break;  // Exit loop after finding the second swing low
        }
     }

// Create an ascending trend line from the second low to the first low
   ObjectCreate(chart_id, up_trend, OBJ_TREND, 0, second_low_time, second_low, first_low_time, first_low);
   ObjectSetInteger(chart_id, up_trend, OBJPROP_TIMEFRAMES, OBJ_NO_PERIODS);  // Temporarily hide line on all timeframes

// If the swing structure is valid (i.e., second low is lower than first)
   if(first_low > second_low && second_low > 0)
     {
      // Extend the trend line to the right
      ObjectSetInteger(chart_id, up_trend, OBJPROP_RAY_RIGHT, true);

      // Show the trend line on all timeframes
      ObjectSetInteger(chart_id, up_trend, OBJPROP_TIMEFRAMES, OBJ_ALL_PERIODS);

      // Set visual properties: color and thickness
      ObjectSetInteger(chart_id, up_trend, OBJPROP_COLOR, clrBlue);
      ObjectSetInteger(chart_id, up_trend, OBJPROP_WIDTH, 3);


      // Get the price values of the trend line at the corresponding times of the four most recent bars
      t_line_value = ObjectGetValueByTime(chart_id, up_trend, time_price[0], 0);   // Current bar
      t1_line_value = ObjectGetValueByTime(chart_id, up_trend, time_price[1], 0);  // One bar ago
      t2_line_value = ObjectGetValueByTime(chart_id, up_trend, time_price[2], 0);  // Two bars ago
      t3_line_value = ObjectGetValueByTime(chart_id, up_trend, time_price[3], 0);  // Three bars ago

      // Number of bars between the valid bullish confirmation candle and current time
      int no_bars = 0;

      // Loop through the last 4 bars to check for reversal wick touch on the trend line
      for(int i = 0; i <= 3; i++)
        {
         // Condition: Wick of the candle touches below the trend line but opens above it (indicating a potential reversal zone)
         if(low_price[i] < ObjectGetValueByTime(chart_id, up_trend, time_price[i], 0) &&
            open_price[i] > ObjectGetValueByTime(chart_id, up_trend, time_price[i], 0))
           {
            // Check if there's a bullish confirmation candle after the wick touch (within or immediately after)
            for(int j = i; j >= 0; j--)
              {
               // Bullish candle that closed above the trend line
               if(close_price[j] > open_price[j] &&
                  close_price[j] > ObjectGetValueByTime(chart_id, up_trend, time_price[j], 0))
                 {
                  // Count how many bars ago this confirmation occurred
                  no_bars = Bars(_Symbol, time_frame, time_price[j], TimeCurrent());
                  break;
                 }
              }
            break; // Exit after first valid reversal zone is found
           }
        }

      // Check whether a similar wick touch (reversal) happened recently to avoid repeated signals
      bool prev_touch = false;

      if((low_price[1] < t1_line_value && close_price[1] > open_price[1]) ||  // Bar 1 had reversal wick and bullish body
         (low_price[2] < t2_line_value && close_price[2] > open_price[2]))    // Bar 2 had reversal wick and bullish body
        {
         prev_touch = true;  // Flag that a recent touch already occurred
        }

      // Final condition for executing a BUY trade on a reversal setup
      if(
         // One of the recent 4 bars touched and rejected the trend line (wick below, open above), AND
         ((low_price[0] < t_line_value && open_price[0] > t_line_value) ||
          (low_price[1] < t1_line_value && open_price[1] > t1_line_value) ||
          (low_price[2] < t2_line_value && open_price[2] > t2_line_value) ||
          (low_price[3] < t3_line_value && open_price[3] > t3_line_value))
         &&
         // Current candle must be bullish and close above the trend line
         (close_price[0] > open_price[0]) && close_price[0] > t_line_value
         &&
         // The bullish confirmation must occur within 3 bars
         (no_bars < 3)
         &&
         // No recent wick reversal signal already processed
         prev_touch == false
         &&
         // The signal must be more recent than the lookback time threshold
         (time_price[3] > lookbackf_time)
         &&
         // Reversal signals are allowed and this signal is not duplicated from the same bar
         (allow_reversal == true && currentBarTime != lastTradeBarTime)
      )
        {
         // Execute BUY trade with defined lot size, SL and TP
         trade.Buy(lot_size, _Symbol, ask_price, ask_price - sl_points, ask_price + tp_points);
         lastTradeBarTime = currentBarTime; // Update last trade bar time to avoid duplicate signals
        }

      //BREAKOUT AND RETEST

      // Flag to track whether a recent bearish wick rejection (touch) already occurred
      bool prev_touch2 = false;

      // Check the last 2 bars to see if a candle had its high wick above the trend line,
      // but closed bearishly below the open - indicating a possible rejection
      if((high_price[1] > t1_line_value && close_price[1] < open_price[1]) ||
         (high_price[2] > t2_line_value && close_price[2] < open_price[2] && open_price[2] < t2_line_value))
        {
         prev_touch2 = true; // Set flag to avoid duplicate signals
        }

      // Variable to store how many bars ago the bearish confirmation candle appeared
      int no_bars2 = 0;

      // Loop through the last 4 candles to detect a wick rejection of the trend line (retest)
      for(int i = 0; i <= 3; i++)
        {
         // Condition: Candle wick (high) goes above the trend line, but the open is below it
         if(high_price[i] > ObjectGetValueByTime(chart_id, up_trend, time_price[i], 0) &&
            open_price[i] < ObjectGetValueByTime(chart_id, up_trend, time_price[i], 0))
           {
            // Search backward from that bar for a bearish confirmation candle
            for(int j = i; j >= 0; j--)
              {
               // Bearish candle that also closed below the trend line
               if(close_price[j] < open_price[j] &&
                  close_price[j] < ObjectGetValueByTime(chart_id, up_trend, time_price[j], 0))
                 {
                  // Count bars between that confirmation and now
                  no_bars2 = Bars(_Symbol, time_frame, time_price[j], TimeCurrent());
                  break; // Exit inner loop
                 }
              }
            break; // Exit outer loop after first valid retest
           }
        }

      // Final conditions to confirm a breakout and retest sell setup:
      // 1. One of the last 4 candles had a wick above the trend line but opened below it
      // 2. Current candle is bearish and closed below the trend line
      // 3. There was no recent similar signal (prev_touch2 == false)
      // 4. The bearish confirmation occurred within the last 3 bars
      // 5. Breakout trades are allowed and this signal is not from the same bar as the last trade
      if(((high_price[1] >= t1_line_value && open_price[1] < t1_line_value) ||
          (high_price[2] >= t2_line_value && open_price[2] < t2_line_value) ||
          (high_price[3] >= t3_line_value && open_price[3] < t3_line_value) ||
          (high_price[0] >= t_line_value)) &&
         (close_price[0] < t_line_value && close_price[0] < open_price[0] && open_price[1] < t1_line_value) &&
         prev_touch2 == false &&
         (no_bars2 < 3) &&
         (allow_break_out == true && currentBarTime != lastTradeBarTime))
        {
         // All conditions met - place SELL trade with defined SL and TP
         trade.Sell(lot_size, _Symbol, ask_price, ask_price + sl_points, ask_price - tp_points);

         // Update timestamp to prevent duplicate signals from the same bar
         lastTradeBarTime = currentBarTime;
        }
     }
  }
Resultados:


Explicación:
El código comienza declarando una variable booleana llamada prev_touch2, que sirve como indicador para detectar si ya se ha producido recientemente un rechazo de la mecha bajista (una ruptura falsa). El propósito de esta bandera es evitar que el algoritmo active múltiples señales comerciales a partir de una configuración similar que ya se haya manejado. Esto ayuda a reducir señales falsas y garantiza que el Asesor Experto solo reaccione a configuraciones nuevas y válidas.
Luego, el algoritmo busca indicaciones de rechazo bajista en la línea de tendencia analizando las dos velas anteriores (high_price[1] y high_price[2]). Se examina específicamente si el máximo de la vela finalmente cerró por debajo de su apertura, lo que indica presión bajista y una incapacidad para sostener la ruptura, o si rompió brevemente por encima de la línea de tendencia, lo que sugiere un posible intento de ruptura. Para validar el rechazo, agrega una condición para la segunda barra ([2]) para asegurarse de que el precio de apertura también esté por debajo de la línea de tendencia. Prev_touch2 se establece como verdadero si se cumple alguno de estos criterios.
Después de que una mecha toca la línea de tendencia, se inicializa la variable no_bars2 para indicar cuántas barras atrás apareció una vela de confirmación bajista. Estos datos son cruciales para confirmar que la señal sigue siendo genuina y que la nueva prueba se realizó recientemente.
Después de eso, el código entra en un bucle que repite las cuatro velas anteriores. Encontrar una vela cuya mecha (el máximo) cruzó la línea de tendencia pero se abrió por debajo de ella es su objetivo; esto indica que el precio intentó la línea de tendencia pero no logró salir limpiamente. Después de localizar dicha vela, un bucle anidado busca hacia atrás desde ella en busca de una confirmación bajista, que es una vela que cerró por debajo de la línea de apertura y de la línea de tendencia en ese momento. Si se descubre esta confirmación, se utiliza el método Bars() para determinar cuántas barras atrás ocurrió esa vela y el resultado se almacena en no_bars2. Para ahorrar cálculos, los bucles finalizan antes una vez que se detectan señales válidas.
Finalmente, el código evalúa un conjunto de condiciones combinadas para determinar si se debe realizar una operación de venta. Estas condiciones verifican que:
- Una de las últimas cuatro velas tenía una mecha que se disparó por encima de la línea de tendencia pero se abrió por debajo de ella.
- La vela actual es bajista y ha cerrado por debajo tanto de la línea de tendencia como de su propia apertura.
- No había ninguna señal similar marcada previamente (prev_touch2 == false).
- La vela de confirmación bajista se produjo recientemente (dentro de las últimas 3 barras).
- El comercio está permitido (allow_break_out == true) y no se está duplicando desde la misma barra (currentBarTime != lastTradeBarTime).
Se ejecuta una operación de venta con el tamaño de lote, stop loss y valores de take profit especificados si se cumplen todos estos requisitos. Para evitar realizar otra operación a partir de la misma señal, la hora de la barra actual se guarda en lastTradeBarTime.
4.1.2. Ejecución de operaciones con línea de tendencia descendente
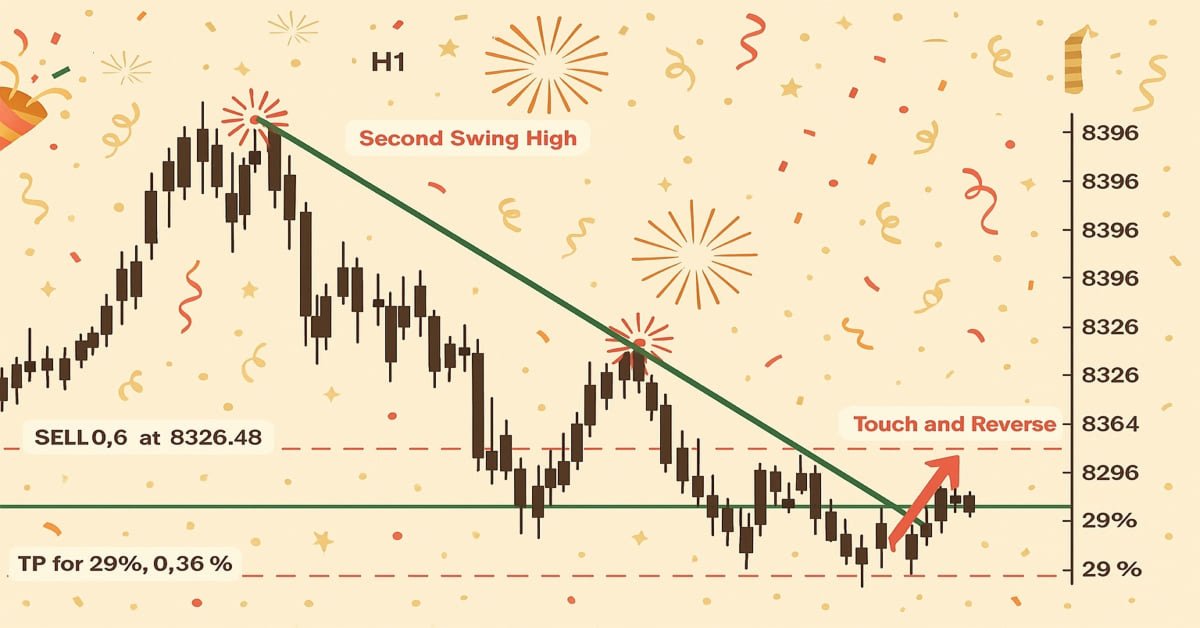
Buscaremos posibilidades de ruptura y reversión en una línea de tendencia descendente en esta sección. El razonamiento es exactamente el inverso de lo que hicimos para la línea de tendencia que estaba subiendo. Para evitar duplicaciones innecesarias, no entraremos en demasiados detalles aquí porque la metodología y la estructura son bastante idénticas. Nuestra atención se centrará en las configuraciones bajistas durante las reversiones y en las configuraciones alcistas durante las rupturas y las nuevas pruebas, ya que la línea de tendencia descendente sirve como resistencia. Ésta es la distinción principal.
Ejemplo:
// Only proceed if drawing descending trend lines is enabled
if(allow_downtrend)
  {
// First loop: Find the most recent swing high (first high)
   for(int i = LookbackBars; i < bars_check - LookbackBars; i++)
     {
      // Check if the current bar is a swing high
      if(IsSwingHigh(high_price, i, LookbackBars))
        {
         // Store the price and time of this latest swing high
         first_high = high_price[i];
         first_high_time = time_price[i];

         break;  // Exit loop once the first swing high is found
        }
     }

// Second loop: Find an earlier swing high that is higher than the first high and occurred before it
   for(int i = LookbackBars; i < bars_check - LookbackBars; i++)
     {
      // Check for earlier swing high that is higher and happened before the first one
      if(IsSwingHigh(high_price, i, LookbackBars) && high_price[i] > first_high && time_price[i] < first_high_time)
        {
         // Store the price and time of this older swing high
         second_high = high_price[i];
         second_high_time = time_price[i];

         break;  // Exit loop once the second swing high is found
        }
     }

// Create a trend line object from the second swing high to the first swing high
   ObjectCreate(chart_id, down_trend, OBJ_TREND, 0, second_high_time, second_high, first_high_time, first_high);

// Initially hide the trend line across all timeframes to avoid partial drawing
   ObjectSetInteger(chart_id, down_trend, OBJPROP_TIMEFRAMES, OBJ_NO_PERIODS);

// Validate the swing structure:
// The older swing high should be higher than the later swing high to confirm a descending trend line
   if(first_high < second_high && second_high > 0)
     {
      // Extend the trend line indefinitely to the right for better visual guidance
      ObjectSetInteger(chart_id, down_trend, OBJPROP_RAY_RIGHT, true);

      // Make the trend line visible on all chart timeframes
      ObjectSetInteger(chart_id, down_trend, OBJPROP_TIMEFRAMES, OBJ_ALL_PERIODS);

      // Set the trend line color to dark green for clear distinction
      ObjectSetInteger(chart_id, down_trend, OBJPROP_COLOR, clrDarkGreen);

      // Set the thickness of the trend line to 3 pixels for better visibility
      ObjectSetInteger(chart_id, down_trend, OBJPROP_WIDTH, 3);

      //REVERSAL

      td_line_value = ObjectGetValueByTime(chart_id,down_trend,time_price[0],0);
      td1_line_value = ObjectGetValueByTime(chart_id,down_trend,time_price[1],0);
      td2_line_value = ObjectGetValueByTime(chart_id,down_trend,time_price[2],0);
      td3_line_value = ObjectGetValueByTime(chart_id,down_trend,time_price[3],0);

      int no_bars = 0;

      for(int i = 0; i <= 3; i++)
        {

         if(high_price[i] > ObjectGetValueByTime(chart_id,down_trend,time_price[i],0) && open_price[i] < ObjectGetValueByTime(chart_id,down_trend,time_price[i],0)
           )
           {

            for(int j = i; j >= 0; j--)
              {

               if(close_price[j] < open_price[j] && close_price[j] < ObjectGetValueByTime(chart_id,down_trend,time_price[j],0))
                 {

                  no_bars = Bars(_Symbol,time_frame,time_price[j],TimeCurrent());

                  break;

                 }

              }
            break;

           }

        }

      bool prev_touch = false;

      if((high_price[1] > td1_line_value && close_price[1] < open_price[1])
         ||
         (high_price[2] > td2_line_value && close_price[2] < open_price[2])
        )
        {

         prev_touch = true;

        }

      if(((high_price[1] >= td1_line_value && open_price[1] < td1_line_value) || (high_price[2] >= td2_line_value && open_price[2] < td2_line_value)
          || (high_price[3] >= td3_line_value && open_price[3] < td3_line_value) || (high_price[0] >= td_line_value))
         && (close_price[0] < td_line_value && close_price[0] < open_price[0] && open_price[1] < td1_line_value)
         && (no_bars < 3)
         && prev_touch == false
         && (allow_reversal == true  && currentBarTime != lastTradeBarTime)
        )
        {

         trade.Sell(lot_size,_Symbol,ask_price,ask_price + sl_points, ask_price - tp_points);
         lastTradeBarTime = currentBarTime;

        }

      //BREAKOUT AMD RETEST

      // Flag to track whether a recent bullish wick rejection (touch) already occurred
      bool prev_touch2 = false;

      // Check the last 2 candles for bullish rejection from below the descending trend line
      // A bullish rejection occurs when the low goes below the trend line but closes above the open (bullish candle)
      if((low_price[1] < td1_line_value && close_price[1] > open_price[1]) ||
         (low_price[2] < td2_line_value && close_price[2] > open_price[2] && open_price[2] > td2_line_value))
        {
         prev_touch2 = true; // Set flag to prevent duplicate signals from the same type of setup
        }

      // Variable to hold how many bars ago a bullish confirmation candle occurred after wick rejection
      int no_bars2 = 0;

      // Loop through the last 4 candles to detect a wick rejection of the descending trend line
      for(int i = 0; i <= 3; i++)
        {
         // Condition: Candle wick (low) goes below the trend line, but the open is above it
         if(low_price[i] < ObjectGetValueByTime(chart_id, down_trend, time_price[i], 0) &&
            open_price[i] > ObjectGetValueByTime(chart_id, down_trend, time_price[i], 0))
           {
            // Look backward for a bullish confirmation candle that closes above the trend line
            for(int j = i; j >= 0; j--)
              {
               if(close_price[j] > open_price[j] &&
                  close_price[j] > ObjectGetValueByTime(chart_id, down_trend, time_price[j], 0))
                 {
                  // Count how many bars ago that bullish confirmation happened
                  no_bars2 = Bars(_Symbol, time_frame, time_price[j], TimeCurrent());
                  break; // Exit inner loop once confirmation is found
                 }
              }
            break; // Exit outer loop after the first valid retest is processed
           }
        }

      // Final conditions to confirm a breakout or retest for a BUY setup on descending trend line:
      // 1. One of the last 4 candles had a wick below the trend line but opened above it
      // 2. Current candle is bullish and closed above the trend line
      // 3. A valid bullish confirmation occurred within the last 3 bars
      // 4. No recent similar touch detected (prev_touch2 == false)
      // 5. Candle timestamps are valid (not too far back)
      // 6. Breakout trading is allowed, and this bar is not the same as the last trade bar
      if(
         ((low_price[0] < td_line_value && open_price[0] > td_line_value) ||
          (low_price[1] < td1_line_value && open_price[1] > td1_line_value) ||
          (low_price[2] < td2_line_value && open_price[2] > td2_line_value) ||
          (low_price[3] < td3_line_value && open_price[3] > td3_line_value)) &&
         (close_price[0] > open_price[0]) && close_price[0] > td_line_value &&
         (no_bars2 < 3) &&
         prev_touch2 == false &&
         (time_price[3] > lookbackfd_time) &&
         (allow_break_out == true && currentBarTime != lastTradeBarTime)
      )
        {
         // All conditions met - place a BUY trade with defined SL and TP
         trade.Buy(lot_size, _Symbol, ask_price, ask_price - sl_points, ask_price + tp_points);

         // Update the last trade time to avoid repeated trades from the same bar
         lastTradeBarTime = currentBarTime;
        }
     }
  }
Resultados:


Explicación:
En esta sección se implementa la lógica para ejecutar operaciones de COMPRA basadas en la ruptura o el rechazo de una línea de tendencia descendente. Para determinar si ya se ha producido un rechazo reciente de la mecha alcista, primero construimos una variable booleana llamada prev_touch2. Al hacer esto, puede evitar realizar operaciones duplicadas utilizando la misma señal. A continuación, observamos las dos últimas velas para determinar si alguna de ellas tenía mechas que terminaron cerrando alcistas (es decir, más altas que la apertura) a pesar de perforar por debajo de la línea de tendencia descendente. Establecemos prev_touch2 como verdadero si se descubre tal escenario.
El número de velas desde la aparición de una vela de confirmación alcista legítima se almacena en una variable llamada no_bars2. Para determinar si es probable que se produzca una nueva prueba, analizamos las últimas cuatro velas y vemos si alguna de ellas tuvo mechas que cayeron por debajo de la línea de tendencia descendente mientras abrían por encima de ella. A continuación, retrocedemos desde esa vela para encontrar una vela de confirmación alcista, una que cerró por encima de la línea de tendencia descendente y su precio de apertura, si se descubre un rechazo de mecha de este tipo. Una vez ubicada, guardamos la vela de confirmación en no_bars2 y determinamos hace cuántas barras apareció.
Para verificar una configuración de COMPRA legítima, finalmente integramos múltiples condiciones. Observamos si alguna de las cuatro velas anteriores se abrió por encima de la línea de tendencia pero tenía mechas debajo de ella. Además, validamos que la vela actual haya cerrado por encima de la línea de tendencia, sea alcista (el cierre esté por encima de la apertura) y que la confirmación alcista se produjo dentro de las tres barras anteriores.
Asimismo, también nos aseguramos de que el marco temporal sea legítimo, se permitan operaciones de ruptura, la señal no provenga de la misma vela que la operación anterior y no se hayan registrado previamente rechazos recientes (prev_touch2). El EA utiliza el tamaño de lote especificado, los valores de stop loss y take profit para ejecutar una transacción de COMPRA si se cumplen todos estos criterios. También modifica lastTradeBarTime para evitar realizar operaciones duplicadas de la misma vela.
Conclusión
Con todo lo que hemos cubierto en este artículo, ahora tienes el conocimiento fundamental para trabajar con cualquier patrón de gráfico que involucre líneas de tendencia. Desde canales hasta líneas de tendencia ascendentes y descendentes, aprendió a recuperar valores de líneas de tendencia y compararlos con la acción del precio, y ejecutar operaciones en función de condiciones claras de ruptura o reversión. Aplicamos este conocimiento de manera práctica al usarlo para construir un Asesor Experto (EA) que puede detectar y responder automáticamente a las interacciones de las líneas de tendencia en tiempo real. Esta lógica es altamente adaptable, lo que significa que puedes aplicarla a otros patrones de gráficos como triángulos, cuñas e incluso techos o suelos dobles.
Traducción del inglés realizada por MetaQuotes Ltd.
Artículo original: https://www.mql5.com/en/articles/18259
Advertencia: todos los derechos de estos materiales pertenecen a MetaQuotes Ltd. Queda totalmente prohibido el copiado total o parcial.
Este artículo ha sido escrito por un usuario del sitio web y refleja su punto de vista personal. MetaQuotes Ltd. no se responsabiliza de la exactitud de la información ofrecida, ni de las posibles consecuencias del uso de las soluciones, estrategias o recomendaciones descritas.

- Aplicaciones de trading gratuitas
- 8 000+ señales para copiar
- Noticias económicas para analizar los mercados financieros
Usted acepta la política del sitio web y las condiciones de uso
Hola Bro
¿Puede su Ea trabajará en Deriv sobre la volatilidad?
Gracias por este artículo, es muy instructivo. Que Dios le bendiga.
De nada, gracias por sus amables palabras.