Custom Indicator Buffer Analyzer MT5
- Utilities
-
Duc Hoan Nguyen
 I develop practical trading tools for MetaTrader 4/5, with a focus on indicator integration, Multi-Timeframe analysis, market scanning, and automated trading solutions.
My work mainly includes:
• Indicator-to-EA Solutions - Version: 1.0
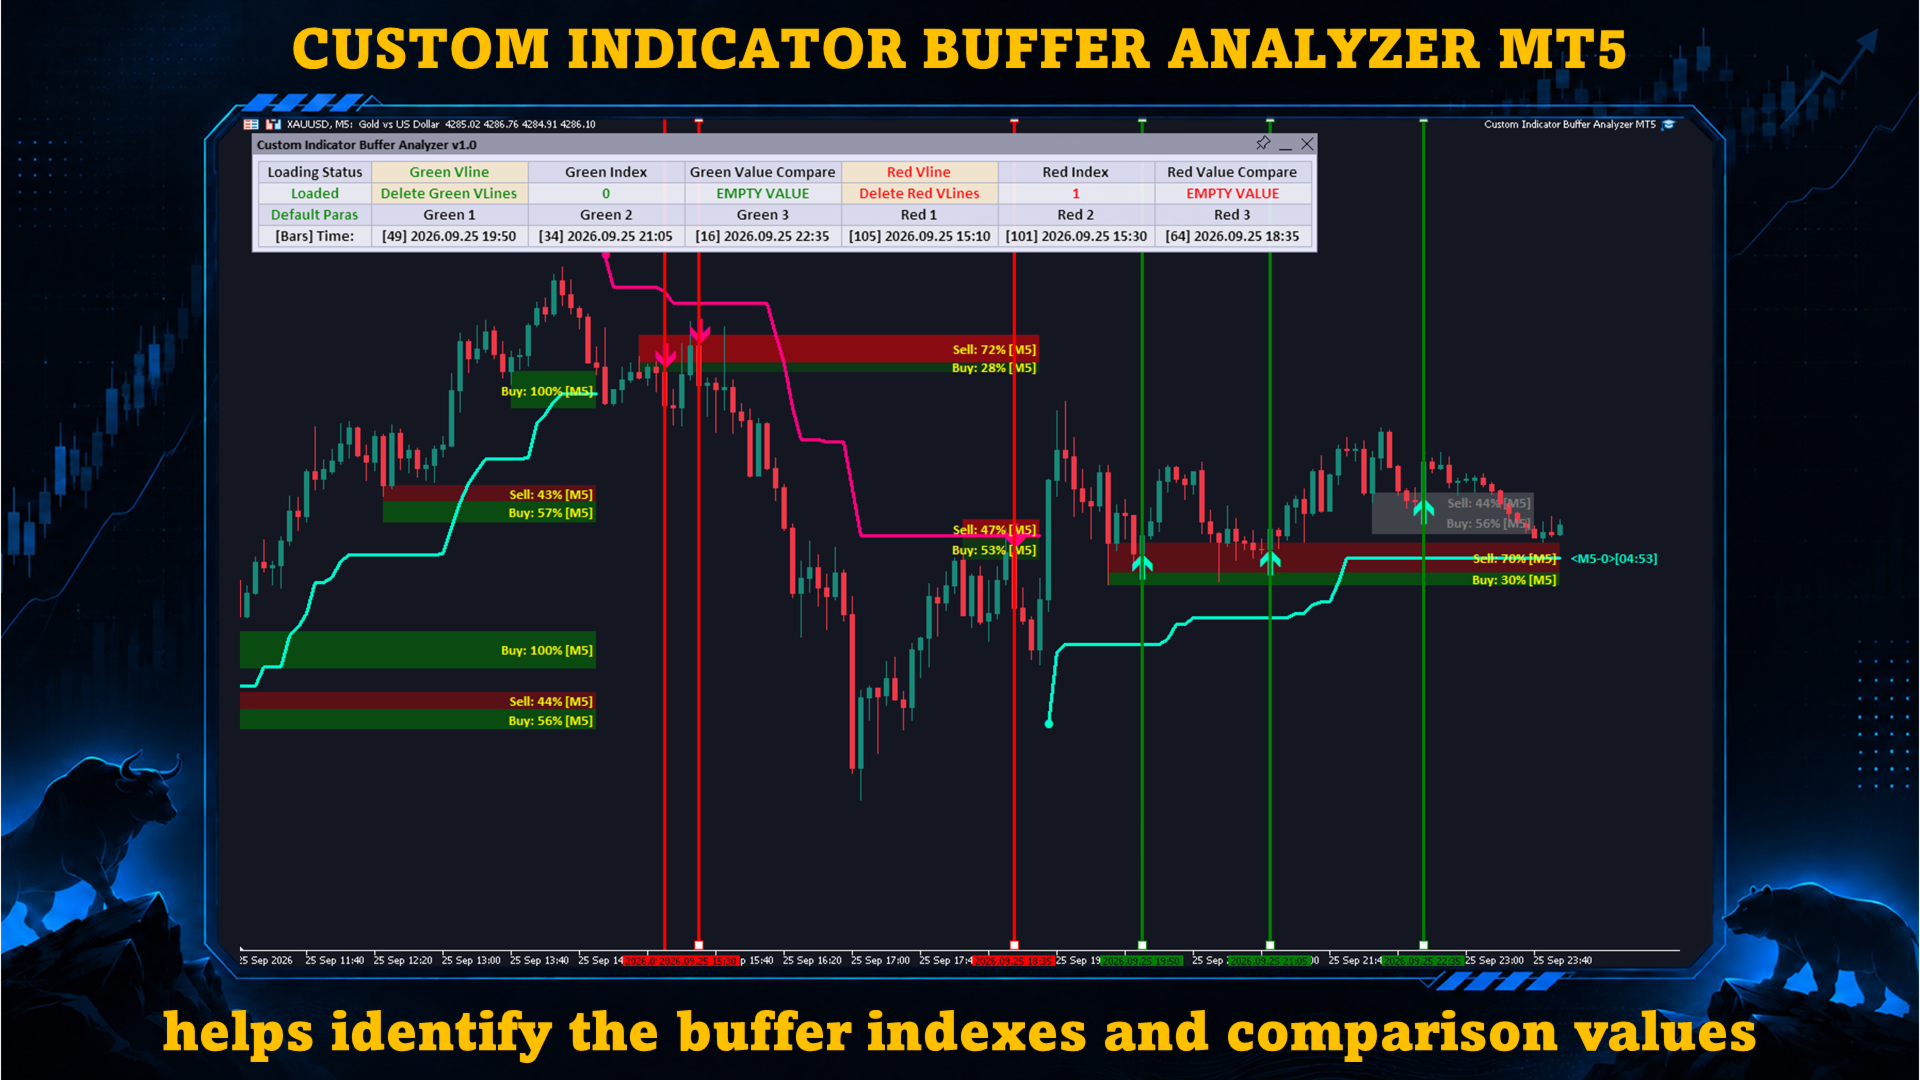
Custom Indicator Buffer Analyzer helps identify the buffer indexes and comparison values used by a Custom Indicator in MetaTrader 5.
It is useful when you want to use an external indicator as a signal source for an EA but do not know:
- Which buffer contains the Buy signal.
- Which buffer contains the Sell signal.
- Which value should be used to determine whether a signal exists.
- Whether the indicator uses EMPTY_VALUE, 0, or another value for the no-signal state.
1. Prepare the Custom Indicator
Install the indicator to be analyzed in:
MQL5\Indicators\
The required data must be available through indicator buffers. If the indicator only displays signals using chart objects such as arrows, labels, text, rectangles, or trend lines without providing the same data through buffers, the tool cannot identify those signals by buffer index.
2. Select the Custom Indicator
Enter the path of the indicator you want to analyze. The path is relative to:
MQL5\Indicators\
If the indicator is stored in a subfolder, enter the full relative path.
If the indicator cannot be loaded, check:
- The indicator name.
- The indicator path.
- Whether the EX5 file exists.
- Whether the indicator works correctly when attached directly to a chart.
3. Load an Indicator SET File
If the indicator uses settings different from its default inputs, load the corresponding SET file.
The SET file allows Custom Indicator Buffer Analyzer to load the indicator with the same configuration that you intend to use with your EA.
Make sure that:
- The SET file was created for the correct indicator.
- The SET file path is correct.
- The saved inputs are compatible with the current indicator version.
If the indicator uses its default settings, a SET file may not be required.
4. Set the Buffer Index Range
Use Buffer Index Start and Buffer Index End to define the range of buffers that will be analyzed.
Start with a reasonable range so the results remain easy to read and unnecessary buffers are not processed. If the required signal buffer is not found, increase Buffer Index End and analyze again.
5. Buffer Values
The tool can read and compare the values returned by each buffer at the marked signal candles.
A buffer may contain:
- Price values.
- Indicator line values.
- Signal values.
- Status values.
- 0, 1, or -1.
- EMPTY_VALUE.
- Other values defined by the indicator.
Not every buffer contains a price. The important point is to identify the data pattern that corresponds to the Buy or Sell signal.
6. Mark Buy Signals
To mark Buy signals:
- Click Green Vline on the panel.
- Click the corresponding Buy signal candle on the chart.
- Repeat the same process for the next Buy signals.
The Green Vlines tell the analyzer which candles must be treated as Buy signal positions.
7. Mark Sell Signals
To mark Sell signals:
- Click Red Vline on the panel.
- Click the corresponding Sell signal candle on the chart.
- Repeat the same process for the next Sell signals.
The Red Vlines tell the analyzer which candles must be treated as Sell signal positions.
8. Important Signal-Marking Rules
The signals must be marked from the current candle backward into the past.
Do not skip an unmarked signal of the same direction between two marked signals.
For Buy signals, there must not be another Buy signal between two marked Buy positions that has not also been marked.
The same rule applies to Sell signals.
This requirement is important because the analyzer uses the marked signal sequence and the buffer values between those signals to determine how the indicator represents its signals.
If signals are skipped, the analysis result may be incorrect.
9. Delete Incorrect Vlines
If a signal was marked incorrectly, or if you need to restart the analysis, click the corresponding Delete button on the panel.
Use the appropriate Delete button for the Green Vlines or Red Vlines, then mark the signals again in the correct order.
If you discover that a signal of the same direction was skipped between two marked signals, delete the affected lines and mark the sequence again correctly.
10. Use Multiple Signals
Do not rely on only one signal position.
Mark multiple Buy and Sell signals whenever possible. This helps distinguish the actual signal buffers from:
- Calculation buffers.
- Trend buffers.
- Indicator line buffers.
- Color buffers.
- Other internal data buffers.
A correct signal buffer should show a consistent relationship with the marked signals.
11. How the Analyzer Compares the Data
After the signals are marked, the tool reads the selected buffer range at the corresponding candles and compares the returned values.
The analysis helps determine:
- Which buffer changes at Buy signal candles.
- Which buffer changes at Sell signal candles.
- Which value represents the no-signal state.
- Which condition can be used by an EA to detect a signal.
The goal is not only to find the correct Buffer Index, but also the correct Comparison Value.
12. Determine the Comparison Value
After the signal buffer has been identified, you must determine how its value should be checked.
A very common signal condition is:
Buffer Value != EMPTY_VALUE
In this case:
- EMPTY_VALUE means no signal.
- A value different from EMPTY_VALUE means a signal exists.
However, not every indicator works this way. Some indicators may use 0, 1, -1, a price value, or another special value.
Always use the comparison result reported by the analyzer instead of assuming that every indicator uses EMPTY_VALUE.
13. Signal Buffers and Data Buffers
A Custom Indicator may contain many different types of buffers, including:
- Buy Signal Buffer.
- Sell Signal Buffer.
- Trend Buffer.
- Main Line Buffer.
- Signal Line Buffer.
- Price Buffer.
- Stop Loss Buffer.
- Take Profit Buffer.
- Color Buffer.
- Calculation Buffer.
A buffer should not be selected only because it contains data. Its behavior must match the actual signal positions on the chart.
14. EMPTY_VALUE
EMPTY_VALUE is commonly used by indicators to represent a candle where no drawable value or signal exists.
A typical signal buffer may behave like this:
- Signal candle: the buffer contains a value.
- No-signal candle: the buffer returns EMPTY_VALUE.
When this pattern is confirmed, the EA can normally detect the signal using:
Buffer Value != EMPTY_VALUE
Other indicators may use a different pattern, so the analyzer result should always be followed.
15. Current Candle and Repainting
Some indicators can change their current-candle data while the candle is still forming.
A signal may appear, disappear, or change before the candle closes. For more stable analysis, it is recommended to use confirmed signals on closed candles whenever possible.
16. Verify the Result
After a possible Buy or Sell buffer has been identified, verify it with another group of signals.
- Delete the current Vlines if necessary.
- Select another chart area.
- Mark the signals again from the current side toward older candles.
- Do not skip any same-direction signal between marked positions.
- Run the analysis again.
A correct buffer should follow the same behavior across different groups of signals.
17. Important Results
At the end of the analysis, the most important information is:
1. Signal Buffer Index
This identifies which indicator buffer contains the signal, such as the Buy Buffer Index or Sell Buffer Index.
2. Comparison Value
This identifies the value that must be checked to determine whether a signal exists.
In many indicators the condition is based on EMPTY_VALUE, but another value may be used depending on the indicator.
Both pieces of information are required:
Signal Buffer Index + Comparison Value
These values can then be used in the Custom Indicator settings of an EA.
18. Other Buffers
Custom Indicator Buffer Analyzer can also help inspect other data provided through indicator buffers, depending on the indicator structure, such as:
- Stop Loss.
- Take Profit.
- Entry Price.
- Trend.
- Support or Resistance.
- Upper or Lower Band.
- Main Line.
- Signal Line.
19. Reanalyze After Changes
Run the analysis again if you change:
- The Custom Indicator.
- The indicator version.
- The SET file.
- The Symbol.
- The Timeframe.
- Important indicator inputs.
- The Buffer Index range.
A newer version of an indicator may use a different buffer structure even if its visible signals look the same.
20. If No Suitable Buffer Is Found
If no suitable signal buffer can be found, check the following:
- The signal may be created only with chart objects.
- The Buffer Index range may be too small.
- The wrong SET file may be loaded.
- The indicator may not have loaded correctly.
- The signal may depend on multiple buffers.
- The marked signals may be in the wrong order.
- A same-direction signal may have been skipped between two marked positions.
Important Notes
- Mark the exact candle where the signal appears.
- Use Green Vline for Buy signals.
- Use Red Vline for Sell signals.
- Mark signals from the current candle backward into the past.
- Do not skip a same-direction signal between two marked positions.
- Use the corresponding Delete button to remove incorrect Vlines.
- Verify the result with multiple signals before using it in an EA.
The final information required for EA integration is:
Signal Buffer Index + Comparison Value
Support
If you need help using Custom Indicator Buffer Analyzer, identifying a signal buffer, or understanding the analysis result, please contact me.
When requesting support, please provide as much relevant information as possible, such as:
- The name of the Custom Indicator.
- The indicator version, if available.
- The Symbol and Timeframe being analyzed.
- A screenshot showing the Buy/Sell signals and the marked Vlines.
- A screenshot of the analyzer result.
- A description of the issue or the buffer information you are trying to identify.
I will help you check the setup and explain how to use the analysis result correctly.