
Strategy Ledger Pro
- Utilities
-
Abdullah Uygar Tuna
 IT professional focused on algorithmic trading, quantitative analysis, and practical MetaTrader 5 tools.
Creator of Strategy Ledger and Strategy Ledger Pro: popular, read-only MT5 analytics dashboards that turn complex trading history into clear performance insights and equity analysis. - Version: 4.43
- Updated: 13 October 2026
- Activations: 10
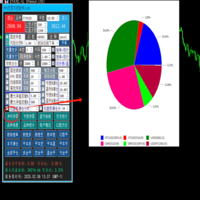
Strategy Ledger Pro is a read-only account analysis panel for MetaTrader 5. It separates account results by Expert Advisor, strategy, symbol, and magic number, so you can see what each one really contributes.
The panel is available in 11 languages: English, Français, Deutsch, Español, Italiano, Português, Русский, Türkçe, 中文, 日本語 and 한국어.
Before you download the demo. The Market runs the demo of any paid product in the Strategy Tester only. This panel analyses the trades on your own account, and a Strategy Tester run has no account history to read, so the demo opens on an empty panel and says so. That is how the demo mechanism works, not a limitation of the product.
The video in this description walks through the panel on a live account.
A detailed manual explains every feature, and the AureusAI Trading Suite group is open for discussion and announcements.
MetaTrader shows one balance for the whole account. When several Expert Advisors trade together, that balance does not show what each one contributed. Strategy Ledger Pro reads the account history, rebuilds closed positions, assigns them to strategies, and presents the results in one panel.
The product does not place, modify, or close orders. It contains no trading strategy, creates no indicators, and does not read chart prices.
Main functions
- Results by Expert Advisor, individual strategy, symbol, or magic number.
- Preset periods, a custom date range, and a session lens for Asia, London, or New York.
- Realised and floating results, open exposure, trade statistics, pips, drawdown, and equity curves.
- Commission, swap, cost drag, and estimated entry and exit slippage with a combined total.
- Performance grades, written summaries, and status marks based on fixed rules.
- Setups: positions opened together, or closed together as a basket, count as one decision for the confidence figures.
- Live equity drawdown tracking for the account and each row.
- Interactive naming, grouping, moving, hiding, restoring, expanding, and sorting.
- Identity: declare a magic number as one strategy or many, and take magic numbers or lot sizes off the board with what they were worth reported.
- Fixed-lot mode: every trade replayed at one lot size, clearly marked as a what-if.
- Results by session and by hour of the day, for every strategy.
- Prop-firm limits: daily loss, maximum drawdown, and profit target, with the room left to each.
- Execution report: what your fills cost, whether they land in your favour as often as against you, how quickly they fill, and what you pay per lot and per lot-day.
- Day change marks showing what each row has done since the trading day began.
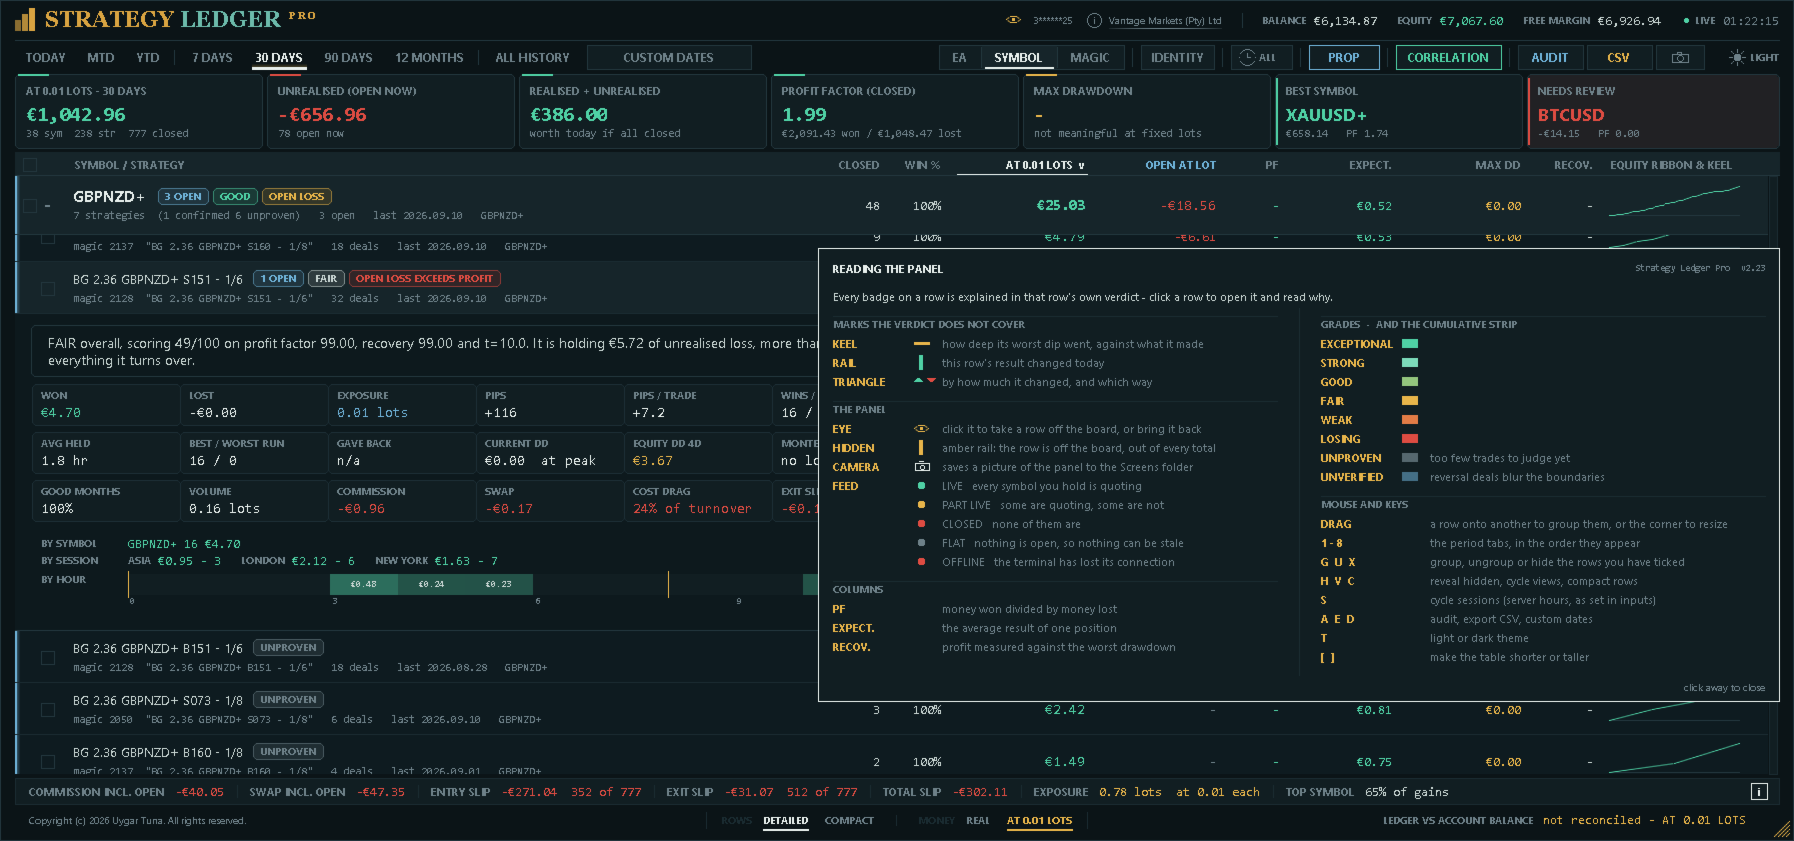
- In-panel guide describing every mark, column, and keyboard shortcut.
- Correlation between Expert Advisors, strategies, or symbols, from daily closed results.
- Grade history: each row's grade month by month, reconstructed from the trade record.
- Strategy Tester reports: one or more HTML reports from the tester, read on the same board, marked as simulated and never mixed with the account.
- Share Cards: one click saves a clean picture of an Expert Advisor's results, with no account number or broker on it.
- An interface in 11 languages, chosen once in the settings.
- Detailed measures and audit exports in CSV format, and panel screenshots in PNG format.
How account data is built
Strategy Ledger Pro counts completed positions rather than individual deals. MetaTrader may open or close one position through several deals. The panel groups those deals by position identifier and records one trade when the closing volume matches the opening volume. Partial closes remain part of the same position.
Profit, commission, fees, and swap are included in each result. Deposits, withdrawals, credits, corrections, bonuses, charges, interest, dividends, and taxes are included in the account reconciliation where the broker reports them in the account history. Each position also carries its result in pips, the average exit against the average entry, which does not depend on lot size.
A strategy is normally identified by its magic number and the cleaned comment on its opening deal. This supports Expert Advisors that use one magic number for several internal strategies. Trades copied from an MQL5 signal are kept together as one strategy named after the signal. Manual and mobile trades with magic number zero can also be included.
Not every position is a separate decision. An Expert Advisor that opens four positions on one signal made one decision, and a grid that closes a basket at once produced one outcome. Positions of one magic number and symbol opened within a short window, or closed together as a ladder — one direction, entry prices stepping in one order — are therefore counted as one setup. Money figures always count positions; the confidence figures — statistical confidence, the minimum sample, the grade, the score, and the Monte Carlo drawdown — use setups, so that a basket opened as one decision is not treated as forty independent results.
The footer compares the reconstructed realised result and account balance operations with the balance and credit reported by MetaTrader. Any difference is displayed. Netting reversal deals can make exact trade boundaries uncertain, so affected rows are marked Unverified and are not graded.
Views, periods, and organisation
The Expert Advisor view groups strategies under their assigned Expert Advisor. The symbol view groups the same data by instrument. The magic view groups it by the number each Expert Advisor sent, with its comments as the strategies underneath, and is the place to look when an Expert Advisor's comments are doing something unexpected. Several rows can remain expanded at the same time.
Available periods are today, month to date, year to date, 7 days, 30 days, 90 days, 12 months, all history, and a custom date range. A position can be assigned to a period by its closing time or opening time.
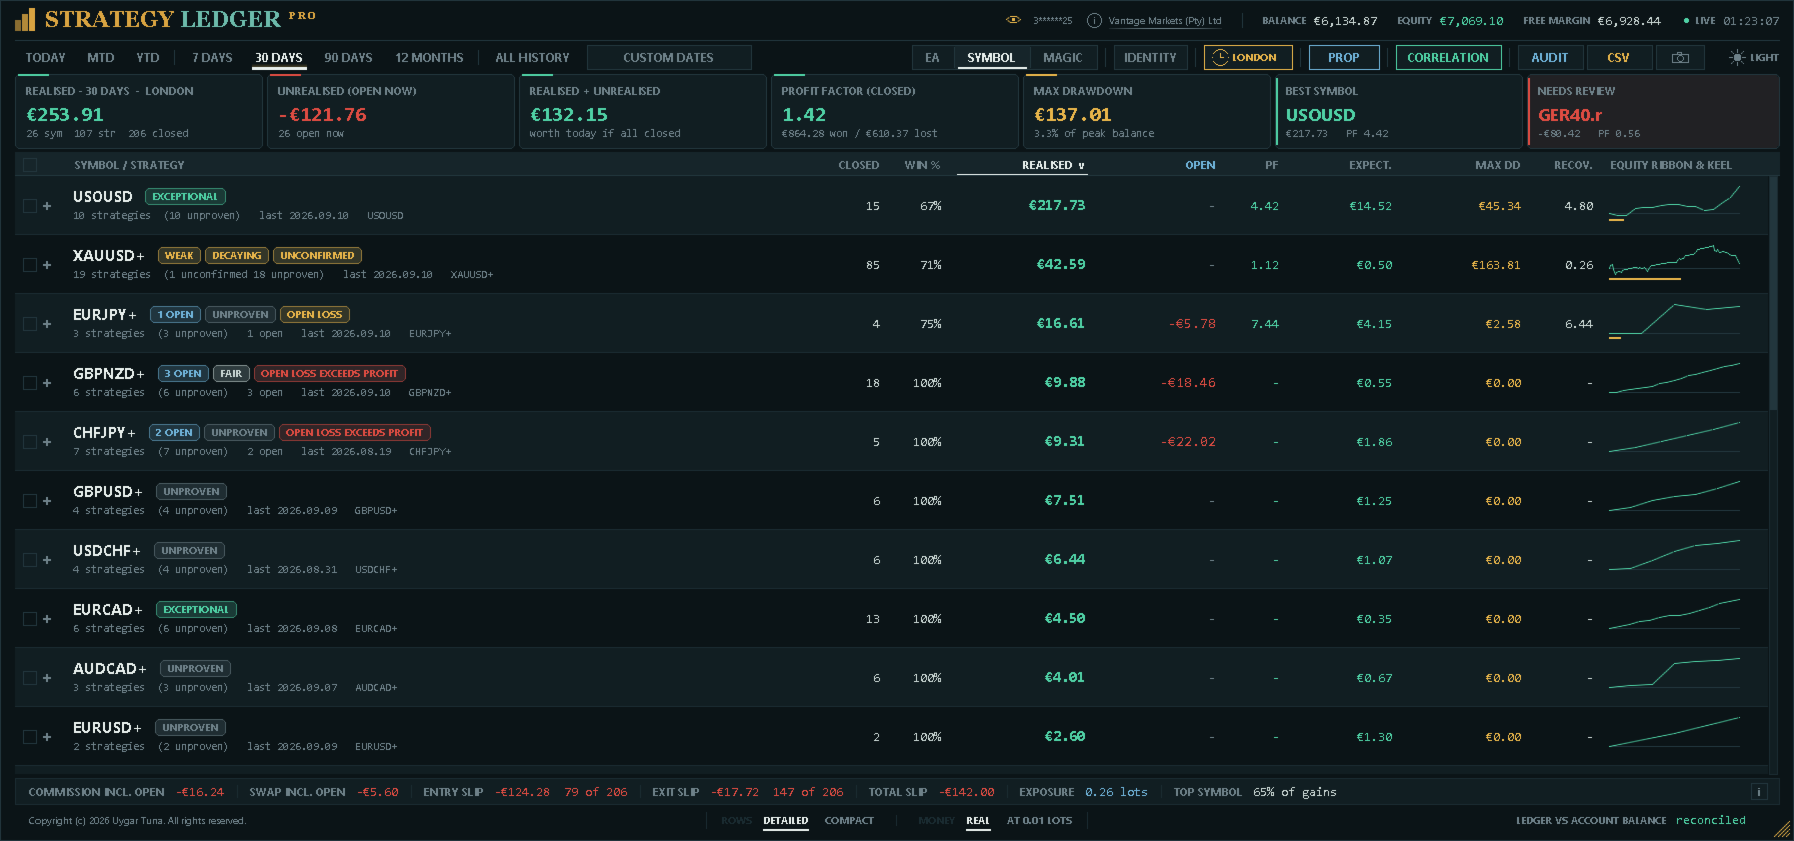
A clock in the header filters the whole panel to one trading session — Asia, London, or New York — in any view and on any period. A position belongs to the session in which it was opened. The session start hours are settings, in server time, and the period label states which session is in force wherever it is read.
Names can be learned from deal comments or supplied through manual overrides. Strategies can be renamed, grouped from a selection, dragged to another Expert Advisor, merged, or separated. Dragging a row that is part of a ticked selection moves the whole selection. Identical comments can be merged across magic numbers, with an exception list for comments that must remain separate.
Rows can be hidden individually or in a selection and restored later. Each Expert Advisor row carries two controls in a column of its own at its right edge: an eye, which hides the row and then turns amber to restore it, and a camera, which saves the row's Share Card. Both are always visible, faintly, and brighten when the mouse is on them. Hidden rows are stored separately for each view. They are excluded from visible totals and from the filtered balance curve. An Expert Advisor whose strategies are all hidden reports no figures, because it has none, and is placed below the rows that still count so that it does not move as those rows change.
Columns can be sorted by name, result, profit factor, closed positions, drawdown, or expectancy.
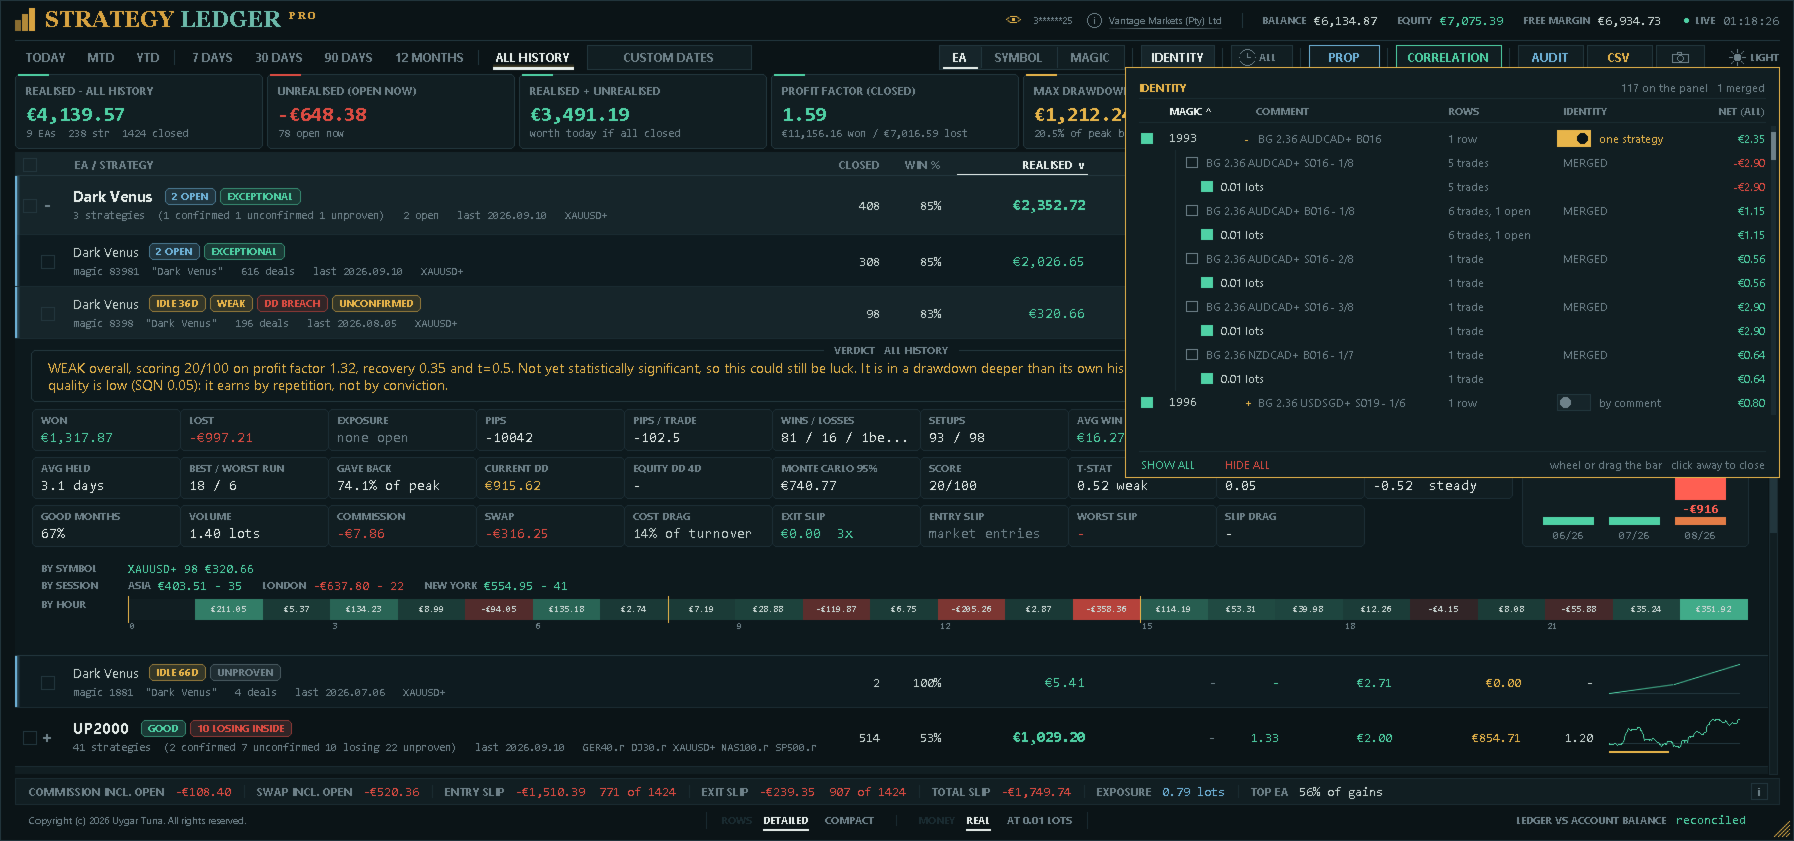
Identity
The identity box lists every magic number on the account with its rows, its result over all history, and a switch. By comment is the normal rule: a strategy is a magic number together with its comment. One strategy folds every comment under that magic number into a single row, for Expert Advisors that write diagnostics or grid-leg numbers into the comment; any single comment can be promoted back to its own row. The switch is not offered for MQL5 signals, which are already one strategy by the signal rule.
Every magic number opens to its comments and, beneath each comment, its lot sizes, smallest first, each with trades and result. A lot size can be taken off the board like a magic number; the same size under two comments can be taken off separately. Whatever is taken off is reported at the bottom of the box with the trades and money removed, so an improved result is never shown without its cost. Magic and lot-size filters are lenses: they are not saved and are cleared together. The identity switch and promotions are decisions and are remembered with the layout.
Fixed-lot mode
A switch in the footer replays every closed trade and every open position as if it had been placed at one lot size (a setting, 0.01 by default). A grid's ladder goes flat, which shows whether the entries had an edge or only the sizing did; a signal shows what it would have paid at the size it would be copied at. Because every money figure on screen is then a what-if, the panel says so wherever money is read: the realised heading and the first summary cell name the lot size, the reconciliation line reads not reconciled, exports are named and marked as rescaled, the audit does not run, grade history and equity tracking pause, and nothing is saved. The mode is off each time the panel is attached. Fixed lots equalise size, not risk; pips equalise nothing but the price move.
Dashboard and strategy details
The header shows the account, broker, balance, equity, free margin, server time, and feed status. Feed status is reported as Live, Part Live, Closed, Flat, or Offline, so that figures which cannot currently update are not mistaken for current ones. An eye beside the account number hides it, for screenshots that will be shared.
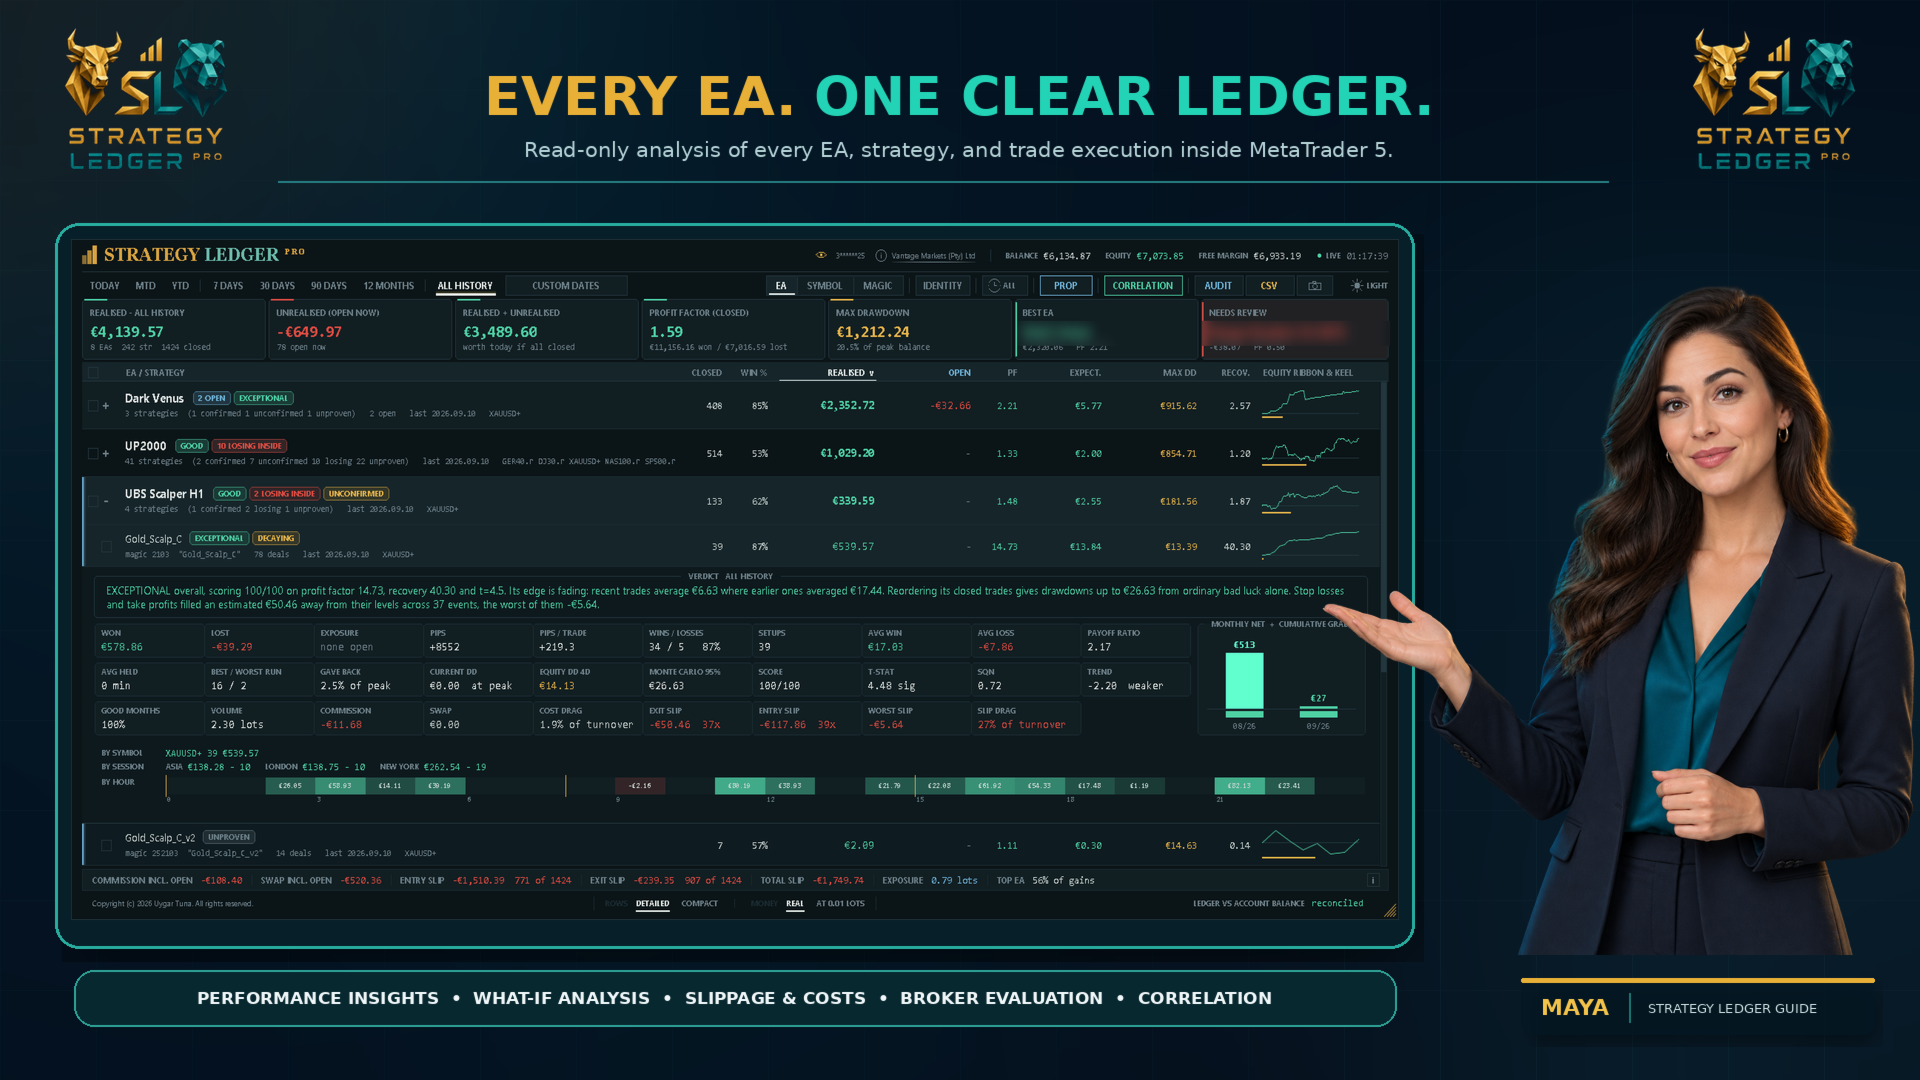
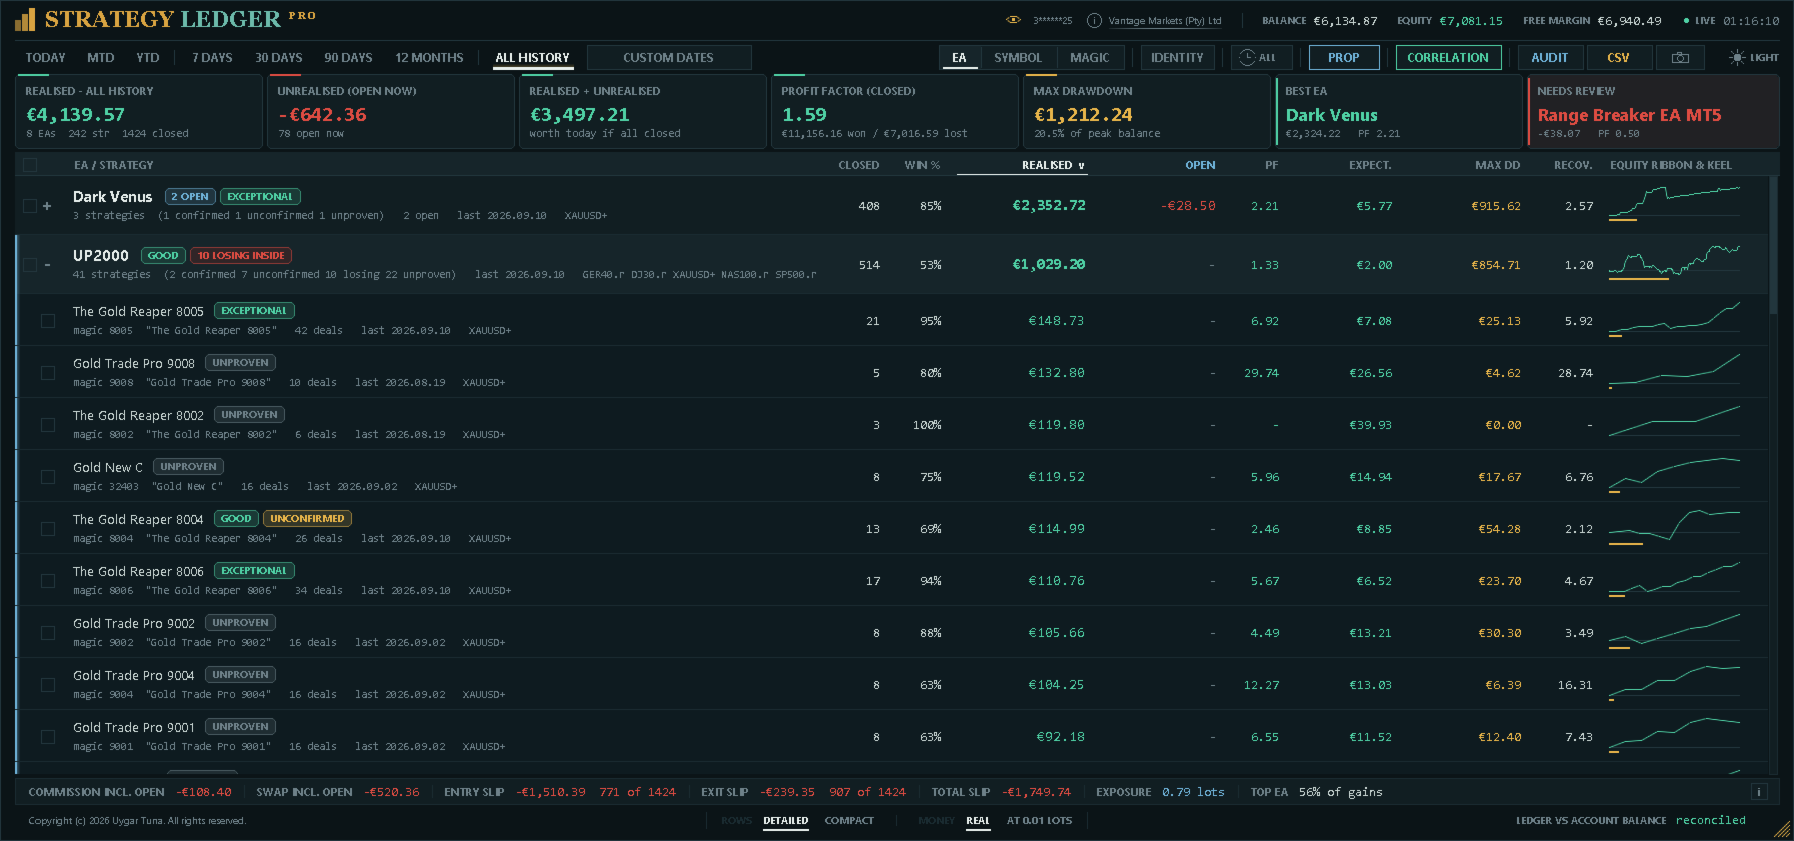
The summary shows realised result, current floating result, their combined value, closed-position profit factor, maximum balance drawdown, the strongest row by current value, and the row selected for review by the panel's concern rules. The last two cards name the reason they chose a row, and each carries a mark that opens the rule behind it: for the reviewed row, every part of the concern score with the points it earned and what it saw; for the strongest, the one rule and the figures it was applied to.
The table shows closed positions, win rate, realised result, floating result, profit factor, expectancy, maximum closed-position drawdown, recovery factor, and a compact equity curve with its drawdown path. When rows are hidden, these figures describe the displayed selection.
Rows that have changed since the start of the trading day carry a coloured edge and a direction mark with the amount of the change. Where a ratio has no denominator, because a row has no losing trade or no drawdown, the column shows a dash rather than a number.
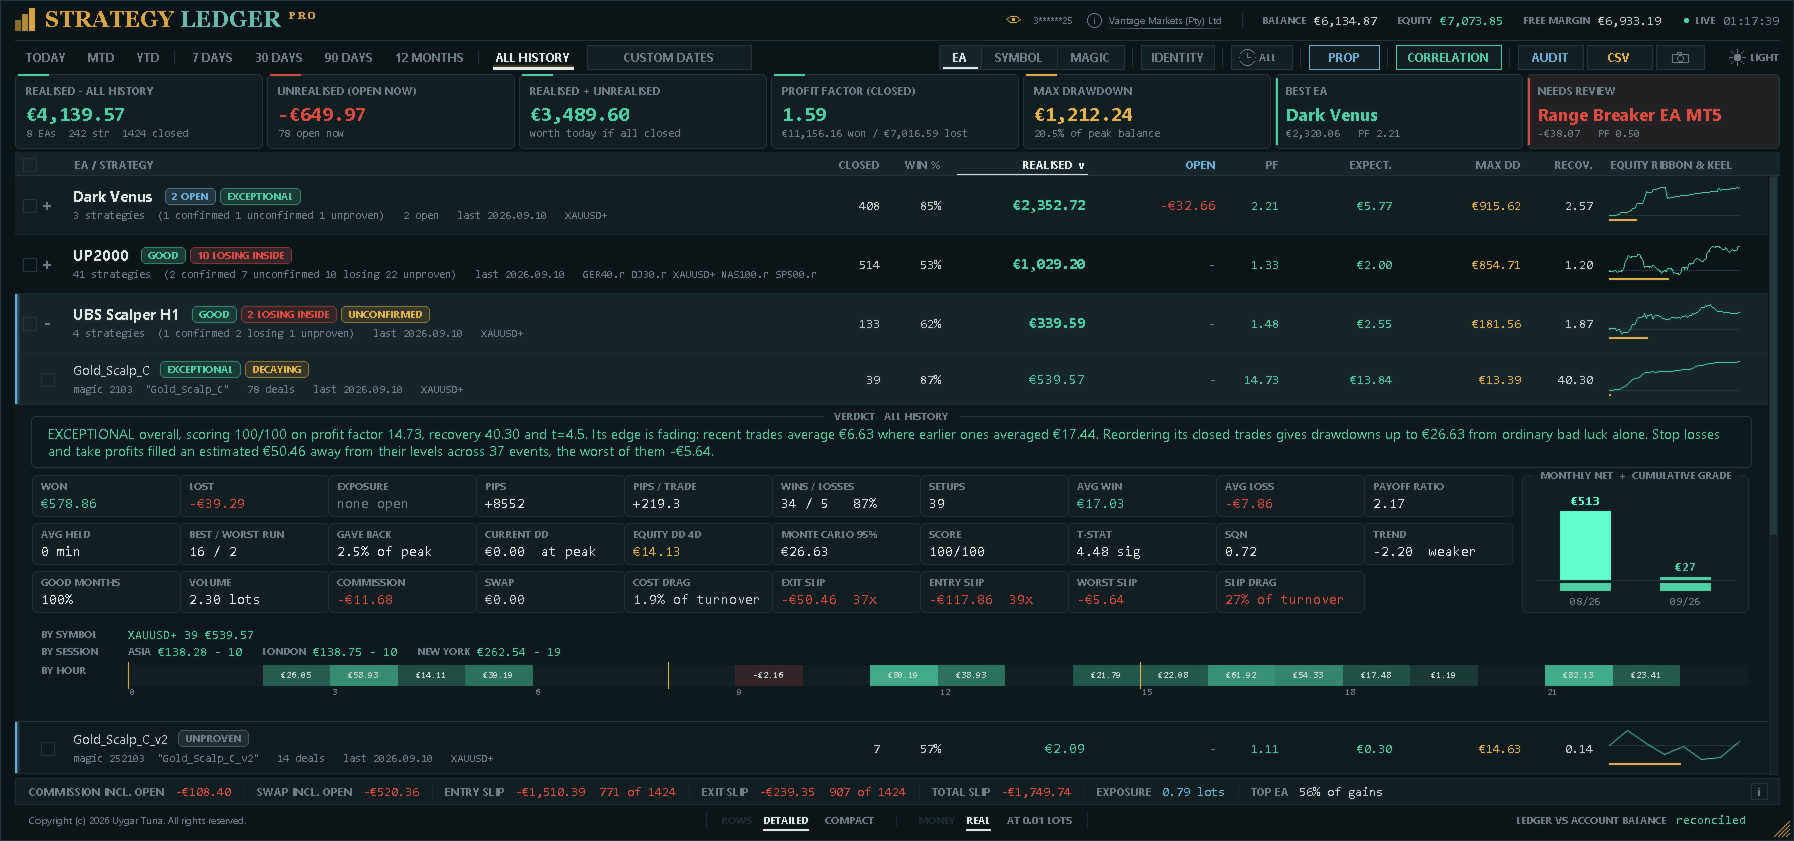
The expanded detail contains total won and lost, open exposure, pips and pips per trade, wins and losses, setups, average holding time, average win and loss, payoff ratio, best and worst consecutive runs, drawdown percentage, current drawdown, the longest time under water, volume, and profitable-month percentage.
The longest time under water is the longest stretch during which the row's cumulative closed result stayed below its previous high, from one high-water mark to the next. It is not how long a position was held: an Expert Advisor whose trades last minutes can still spend weeks below its high. A stretch that has not yet regained its high is counted up to today and reads "so far".
The detail also shows the score, statistical confidence, System Quality Number, recent-result trend, Monte Carlo drawdown estimate, live equity drawdown, commission, swap, cost drag, entry and exit slippage, worst measured slippage, and slippage drag. A monthly net chart, a per-symbol breakdown, the row's result in each session, and a strip of twenty-four cells shaded by what each hour of the day made or lost are included.
Grades and risk marks
The score combines statistical confidence, profit factor, and recovery factor. Each component is capped before averaging. A floating loss can limit the score because closed-position statistics do not include that open loss.
The default minimum sample is 20 setups. Rows below it are marked Unproven. Other grades range from Losing to Exceptional according to the score and the configured losing threshold. Grades describe recorded account data; they are not trading signals or forecasts.
Status marks identify open positions, no closed trades, inactivity, a losing result, open loss, open loss greater than booked profit, weaker recent results, insufficient statistical confirmation, drawdown above the shuffled-history estimate, losing strategies inside a profitable Expert Advisor, and live-equity drawdown materially above closed-position drawdown. Expanding a row shows the applicable marks and a written explanation in that row's own figures.
Sessions and hours
The session lens filters the whole panel; the detail of every strategy also reports its result in each of the three sessions side by side, so the comparison can be read without changing anything. Beneath it, twenty-four cells — one for each hour of the server day in which a position was opened — are shaded by what that hour made or lost and labelled with the amount, with the session boundaries marked so that the two agree.
Both are descriptions of recorded results. A session or an hour that looks strong on a handful of trades is a hypothesis, and the trade counts are shown beside the figures so that it reads as one.
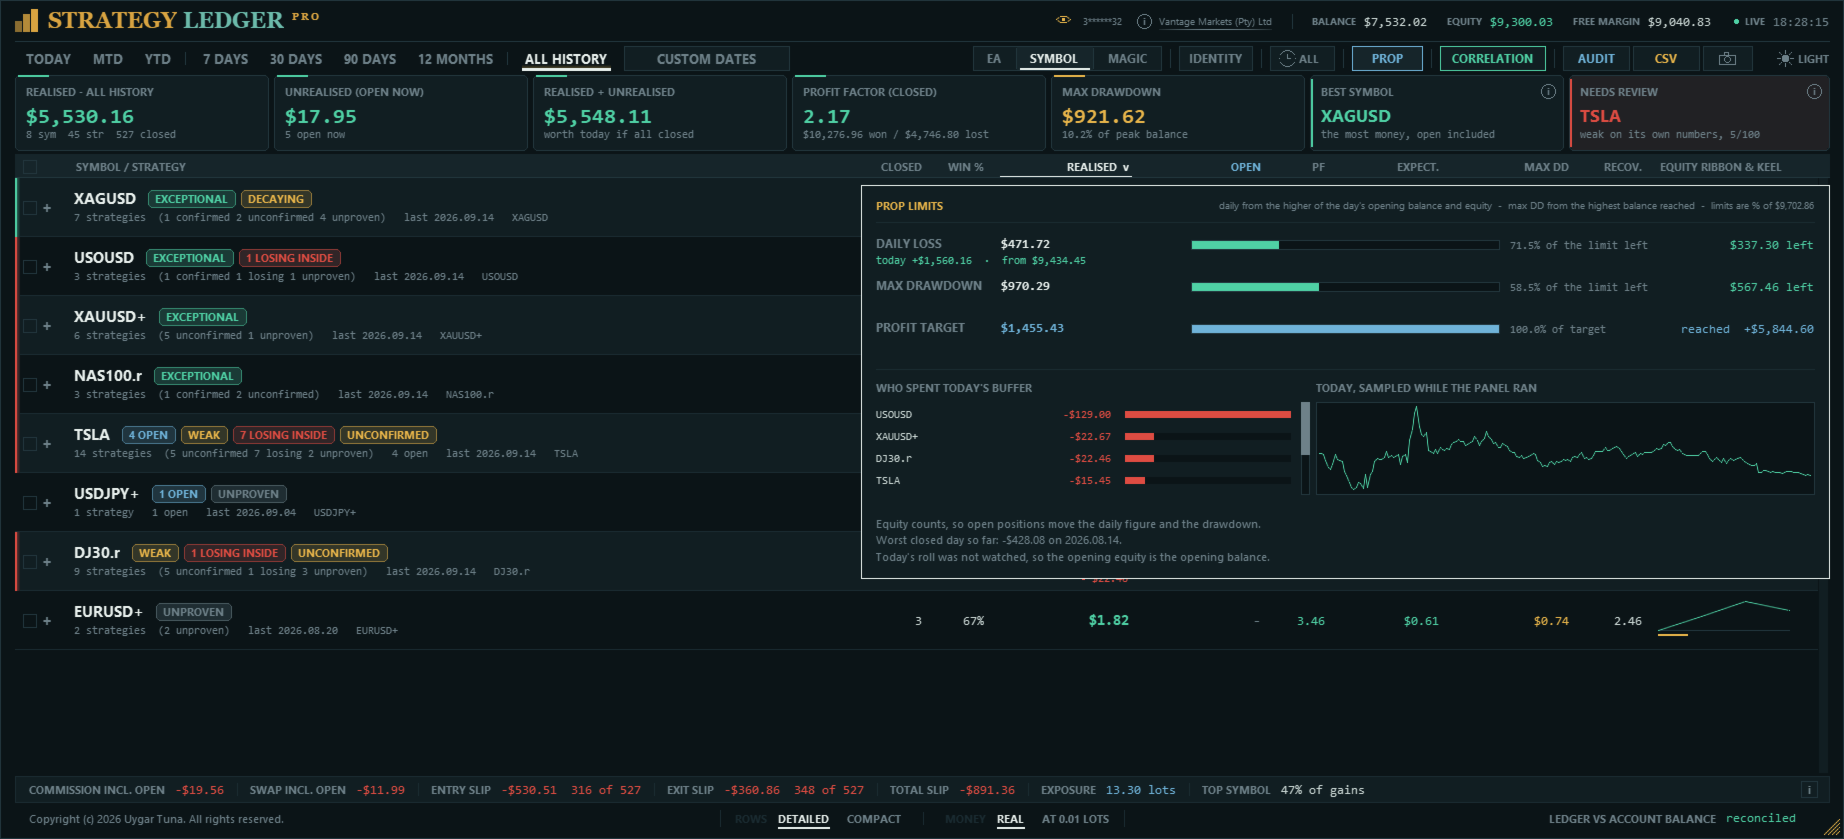
Prop-firm limits
Daily loss, maximum drawdown, and profit target can be entered in account currency or as percentages, and the panel reports the room left to each with a bar that turns amber and then red as it runs out. A limit that has been passed is stated as breached rather than as a negative amount remaining.
Firms differ in how they measure drawdown, so one setting covers both limits: static from the starting balance, trailing from the highest balance reached, or trailing from the highest equity seen. The daily limit applies the same rule within the day and resets with it — from the day's opening balance, from the higher of the day's opening balance and equity, or from the day's highest equity. The daily row also shows what the day has done so far, and the box names the figures it is counting down from.
Equity is used, so open positions move the daily figure. Equity at the moment the day rolled over cannot be reconstructed from history, so it is sampled while the panel runs; where it was not seen, the box says so and falls back to the day's opening balance, which is rebuilt exactly from the deal record.
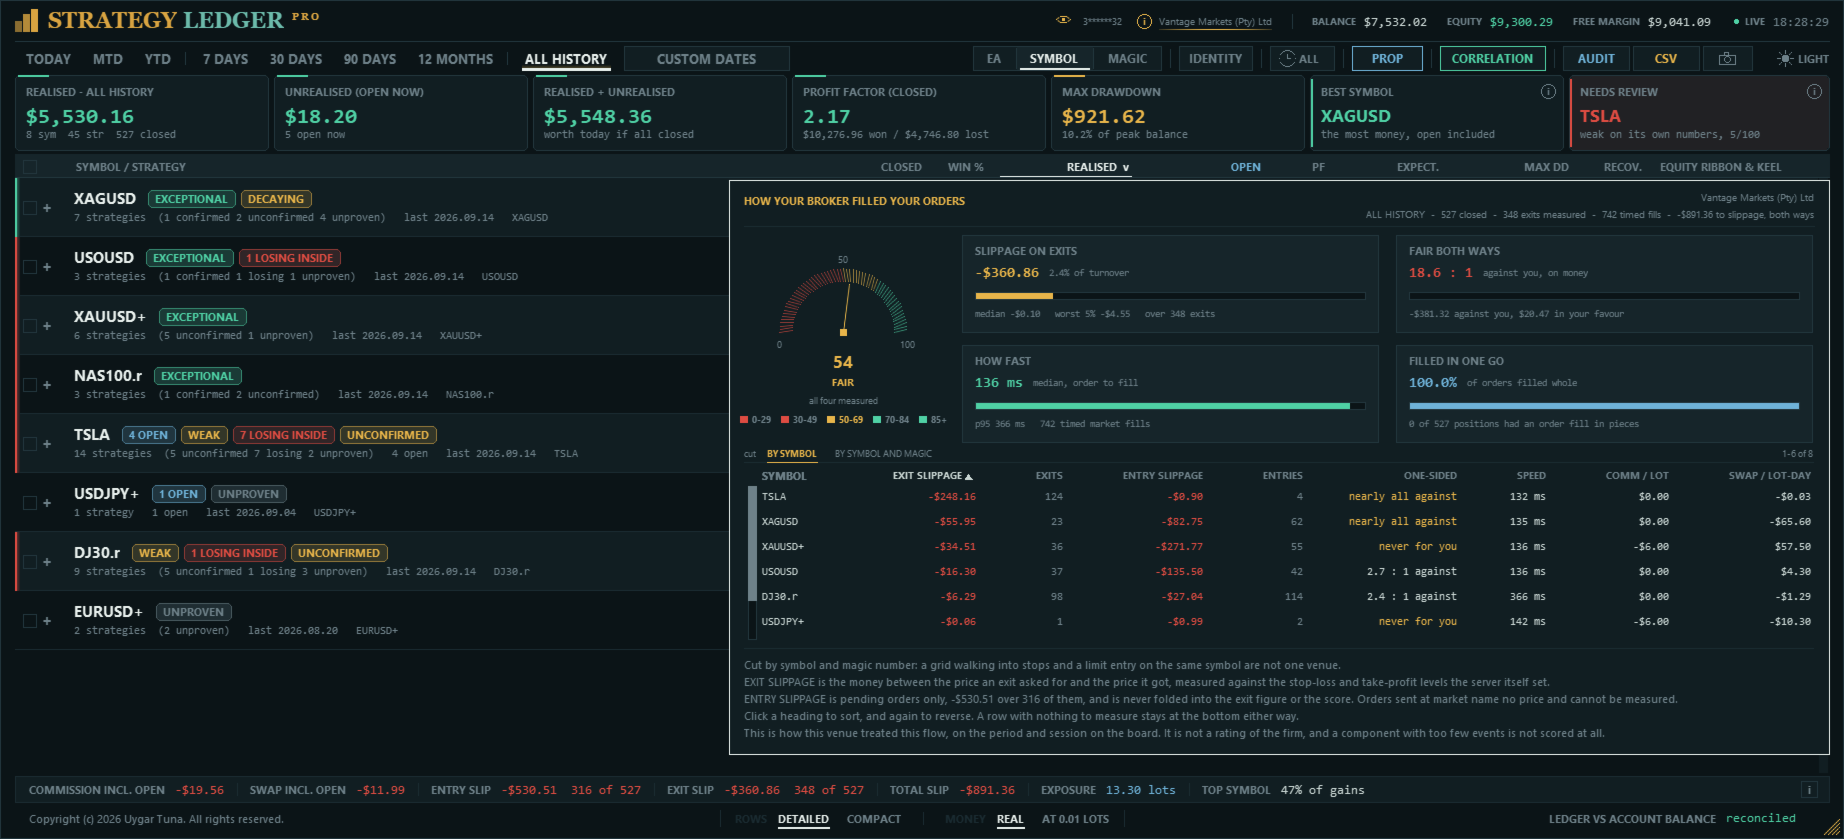
Execution report
The broker's name in the header opens a report on how your own orders were filled. A dial scores four things a venue controls, twenty-five points each: what slippage cost as a share of everything the account moved, whether fills land in your favour as often as against you, how long the broker took between receiving an order and filling it, and how often an order filled in pieces. Each part is shown with its own bar and a sentence stating what produced it.
Beneath the dial are the same figures per symbol, with commission per lot and swap per lot-day. Exit slippage is measured against the stop-loss and take-profit levels the server itself set, so the price it aimed at is known; entry slippage is measured on pending orders, and orders sent at market carry no requested price and cannot be measured. Fill speed comes from the order's own timestamps.
It is a description of your fills on this account, not a rating of the firm, and the report says so: slippage is largely a property of the strategy — a breakout entered on a stop pays it anywhere — and commission and swap depend on the account type you chose.
Drawdown, costs, and slippage
Closed-position drawdown cannot show the full movement of positions while they remain open. Strategy Ledger Pro can sample live equity once per second and store the largest observed fall from a previous high for the account, each Expert Advisor, and each strategy. Tracking starts when the feature is first enabled, and its start date is displayed. The record follows the lifetime of a row, never the period tab, the hidden state, or the fixed-lot mode: changing a view does not write a drawdown.
When live tracking is disabled, the detail panel can show a 95th-percentile drawdown estimate produced by reshuffling closed results. The reshuffle reorders setups rather than single positions, so a basket that could only ever have happened as one block is modelled as one. This estimate and all grades describe historical data only.
Commission and swap are reported separately, and each includes the amount already charged on open positions. Cost drag is shown as a percentage of gross turnover when the required data is available.
Exit slippage is estimated where the exit order contains a requested price, including stop loss, take profit, and pending-order exits. Entry slippage is estimated for pending orders with a requested entry price. Market orders have no requested price for comparison, so the panel reports unavailable or partial coverage. Both figures state how many positions were measured out of the positions closed, so that a partial sample is not read as a complete one. A combined total is also shown; it carries no count, because its two parts cover different subsets of the same positions. Values are converted to account currency using current symbol tick values.
Correlation
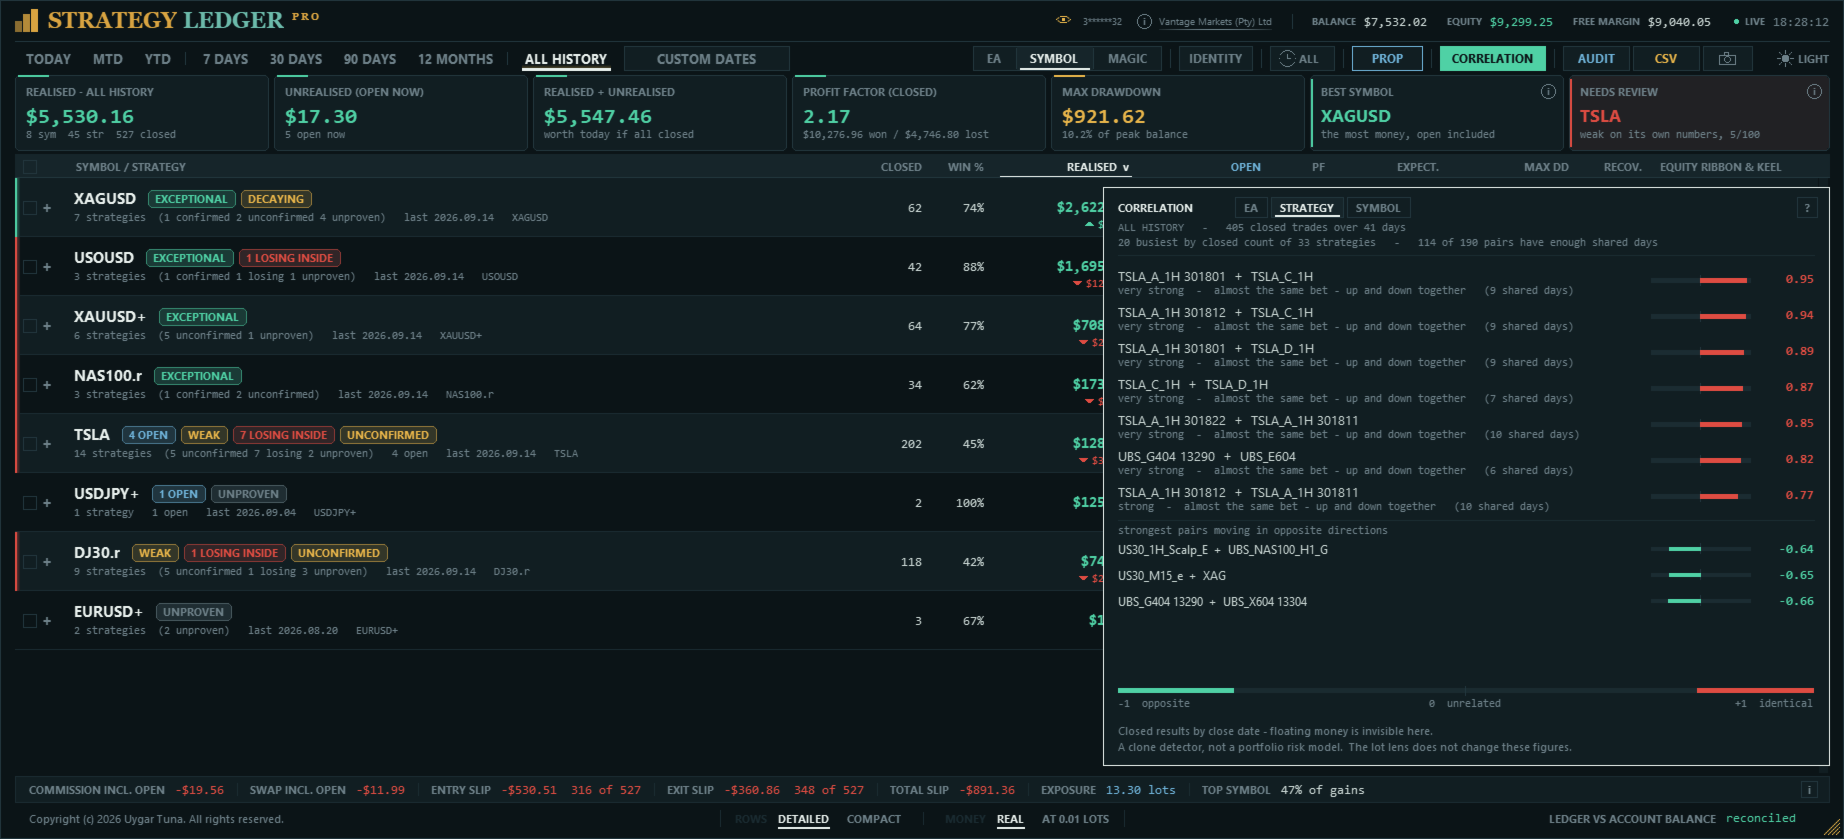
Every row is measured on its own, so several Expert Advisors can each appear sound while responding to the same conditions. The correlation list compares rows against one another instead of scoring them separately, and reports which of them move the same way on the same days.
Each row's closed results are totalled by day. Two rows are then compared across the days on which both traded; days when only one traded are excluded, because they provide no basis for comparison. The figure reported is the Pearson correlation coefficient, which ranges from +1 (identical movement) through 0 (unrelated) to -1 (opposite movement).
The list can be produced for Expert Advisors, magic numbers, individual strategies, or symbols. Only the twenty rows with the most closed positions are compared, and a pair is reported only where the two rows share at least as many trading days as the configured minimum sample. Pairs moving in opposite directions are listed separately so they remain visible.
The calculation runs when the list is opened and at most once per day thereafter, and again whenever the rows in scope change. An explanatory panel inside the list states the method, the period in use, the number of rows and trades included, and the conventional interpretation bands for the coefficient.
Grade history
The expanded detail of a row includes a strip of monthly blocks beneath the monthly net chart, aligned to the same months. Each block shows the grade that row held at the end of that month.
The blocks are cumulative: each is calculated on all positions the row had closed up to that month's end, rather than on that month alone, because a single month rarely contains enough closed positions to grade. A row that is currently graded Exceptional may therefore show undetermined months early in its history, indicating that too few positions had closed at that point to reach a conclusion.
Months preceding installation are reconstructed from account history using the same calculation applied to live data, so the strip is populated from first use. Months recorded while the panel was running are never replaced by a reconstruction.
Strategy Tester reports
The panel reads reports saved from the Strategy Tester. Save a report as HTML into MQL5\Files\StrategyLedgerPro\Backtests, press BACKTEST in the header, tick one or more reports, and load them. Each report becomes one Expert Advisor on the board, named from the report; its comments become its strategies and its symbols are separated in the symbol view, exactly as live trades would be. Several reports can be loaded together.
While a report is on the board, the header reads SIMULATED, with the number of reports, their strategies and symbols, the dates they cover and where the magic number came from, and a gold line runs along the top of the panel. The footer reconciles the rebuilt positions to the report's own balance column, to the cent. For a backtest, the cards show the report balance, the test period, the annualised return, the longest run below a previous high and, with several reports, the best by recovery. The period tabs measure from the report's last close, so 12 MONTHS is the test's last year.
Live and backtest are never shown together. Switching to a report replaces the account on every surface, and switching back restores it. Nothing read from a report is written to the account's names, groups, hidden rows, equity record or prop-firm mark; a report's own names and hidden rows are kept in files of their own. Fills, latency, slippage and today's prop-firm mark cannot be measured in a backtest, and the boxes that would show them say so. A report carries no position identifiers, so exits are paired to entries by volume and then by the tester's own profit figure; the header states how many pairings, if any, had to be inferred.
In the Strategy Tester itself, where the Market demo runs, the panel shows the picker but does not load reports; the reader works on a live or demo account.
Share Cards
The camera on each Expert Advisor row saves a Share Card: a single 1240 × 844 picture of that Expert Advisor's results for the period on screen, ready to post. It shows the net result with the trading costs (commission and swap, and their share of gross profit), the best and worst runs, the equity curve, ten key measures, the last twelve months, the results by session, by day of the week and by hour of the day, and the verdict.
A card contains no account number and no broker name, so nothing on it identifies you. Every card states the period it covers and whether it comes from a live account, a Strategy Tester report, or a fixed-lot replay, so a simulated result can never be read as a real one.
Cards are saved in MQL5\Files\StrategyLedgerPro\Cards, in a folder for each date, with the Expert Advisor's name, the period and the time in the file name; an existing card is never overwritten. Each card carries the Strategy Ledger mark by default; it can be switched off in the settings.
Please check each platform's rules before posting a card. MQL5.com does not allow product images of this kind to be posted on its site; share cards on your own channels instead.
Languages
The panel's language is the first setting in the inputs: English, Français, Deutsch, Español, Italiano, Português, Русский, Türkçe, 中文, 日本語 or 한국어. Everything the panel draws as a label follows it — the header, the period tabs, the summary cards, the column headings, the detail box, the badges, the footer, the correlation and identity boxes, and the Share Cards. Terms are the ones traders use in each market rather than word-for-word translations, and Chinese, Japanese and Korean are drawn in the fonts Windows provides for them.
The written verdicts, the second line of each row and the rename prompt are still in English. Exports, file names and the log always stay in English, so that scripts and support tools read them the same way in every language.
Exports
The measures export writes the displayed groups and strategies, including results, statistics, pips, setups, costs, slippage, grades, and written summaries. Automatic export can run after each refresh.
The audit export lists reconstructed closed positions, open positions, period and hidden-row status, and independent position-versus-deal checks. It is intended to help investigate missing history or calculation differences.
The screenshot control saves the panel as a PNG image, including any panel window that is open at the time. Exports and screenshots are written to separate folders under the account number; Share Cards go to their own folder, described above.
Layout and saved settings
The panel supports dark and light themes, mouse-wheel scrolling, custom width and table height, automatic chart fitting, display scaling, manual text scaling, and an optional live clock. Columns are removed progressively when the panel becomes too narrow. In the header, controls step aside whole rather than shrinking, in a fixed order — camera, CSV, AUDIT, CORRELATION, PROP, IDENTITY, the session clock, CUSTOM DATES and the theme switch — so that the period tabs are the last to go and nothing is ever drawn over them. Keyboard shortcuts act on the panel while the cursor is over it; over the chart, the chart keeps its keys.
A compact row height can be selected from the footer or the keyboard, which removes the second line and the equity curve and fits approximately twice as many rows.
Renaming a row opens a caret: the arrow keys move it, Home and End jump to the ends, Delete removes forward, and Ctrl with a deletion removes a whole word, so the beginning of a name can be corrected without retyping the rest.
An in-panel guide, opened from the footer, shows each mark as it appears in the table, the meaning of the abbreviated columns, the mouse actions, and the keyboard shortcuts. Badges are not repeated there, because each one is explained in the written summary of the row that carries it.
Names, groups, hidden rows, expanded rows, sorting, period, session, theme, row height, panel size, and identity decisions can be remembered. The view the panel opens in is a setting. State and live-equity history are stored separately for each account and server. Older name and layout files are copied when available. Older equity history is adopted only when its dedicated setting is enabled.
Inputs are grouped and written in plain language. They control the language, naming and grouping, signal detection, manual trades, the setup window, period basis, starting period, session hours, prop-firm limits, sorting, theme, panel position and size, chart fitting, the live clock, the saved layout, statistical summaries, the minimum sample, Monte Carlo runs, live-equity tracking, status thresholds, the fixed-lot size, the Share Card mark, automatic export, text size, diagnostic logging, and the optional adoption of older equity history.
Setup and limitations
- In the MetaTrader History tab, select All History.
- Attach Strategy Ledger Pro to a separate chart. Any symbol and timeframe can be used.
- Choose your language in the first input, if it is not English.
- Check the reconciliation line after the first scan.
The panel reads the trades on an account, so it runs on a live or demo account. In the Strategy Tester there is no account history to read; the panel states this and does no further work. It shows the report picker there but does not load reports.
Complete results require complete account history. Missing broker records, unusual deal structures, and netting reversals can create differences or unverified rows.
Slippage values are estimates. The conversion uses the symbol's current tick value rather than its value at the time of the fill. Slippage cannot be measured when an order did not specify a requested price.
Live equity drawdown, today's high-water mark, and the highest equity seen are sampled while the panel is running and cannot be reconstructed for periods when it was not. Figures rebuilt from the deal record — balances, closed results, drawdown on balance — are exact.
If an Expert Advisor writes a different comment on every trade, the comments create separate strategy rows. Common numbers and order references are removed automatically; the identity box can declare that magic number one strategy, and remaining rows can be grouped manually.
Saved names, groups, hidden rows, and equity history from earlier installations on the same account are kept. Running two copies of the panel on the same account at the same time is not recommended, because each will overwrite the other's saved layout.
Questions, suggestions, and problem reports are welcome in the product comments, by MQL5 private message, or in the AureusAI Trading Suite channel, where most updates begin as somebody's comment. Please include the audit export when reporting a calculation difference.

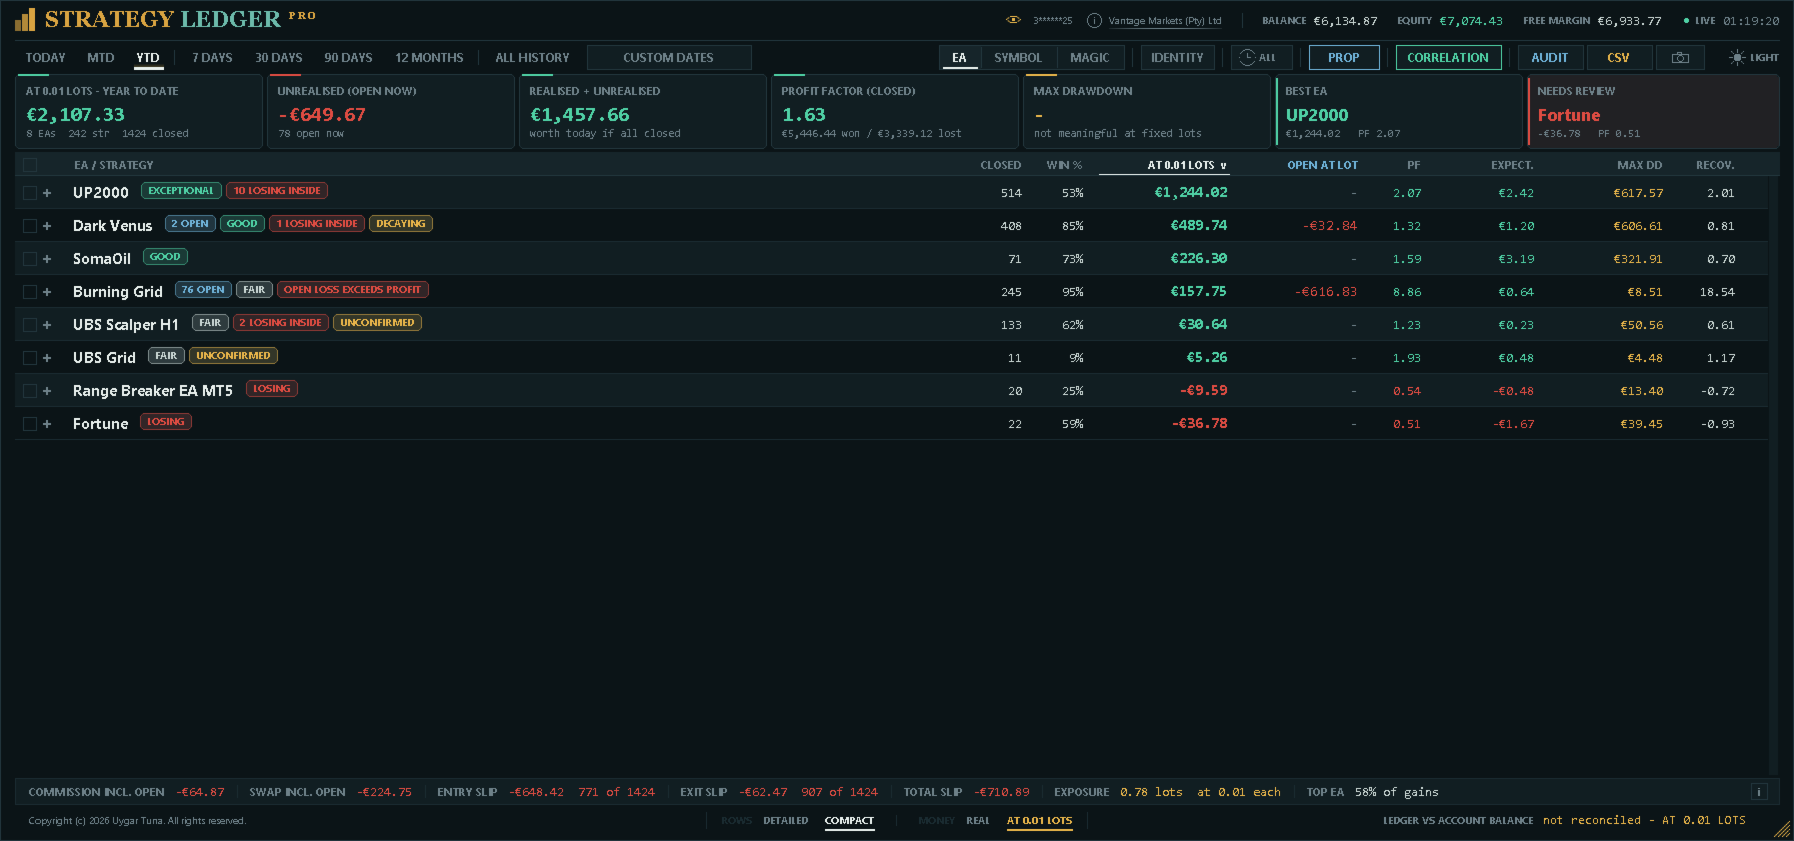
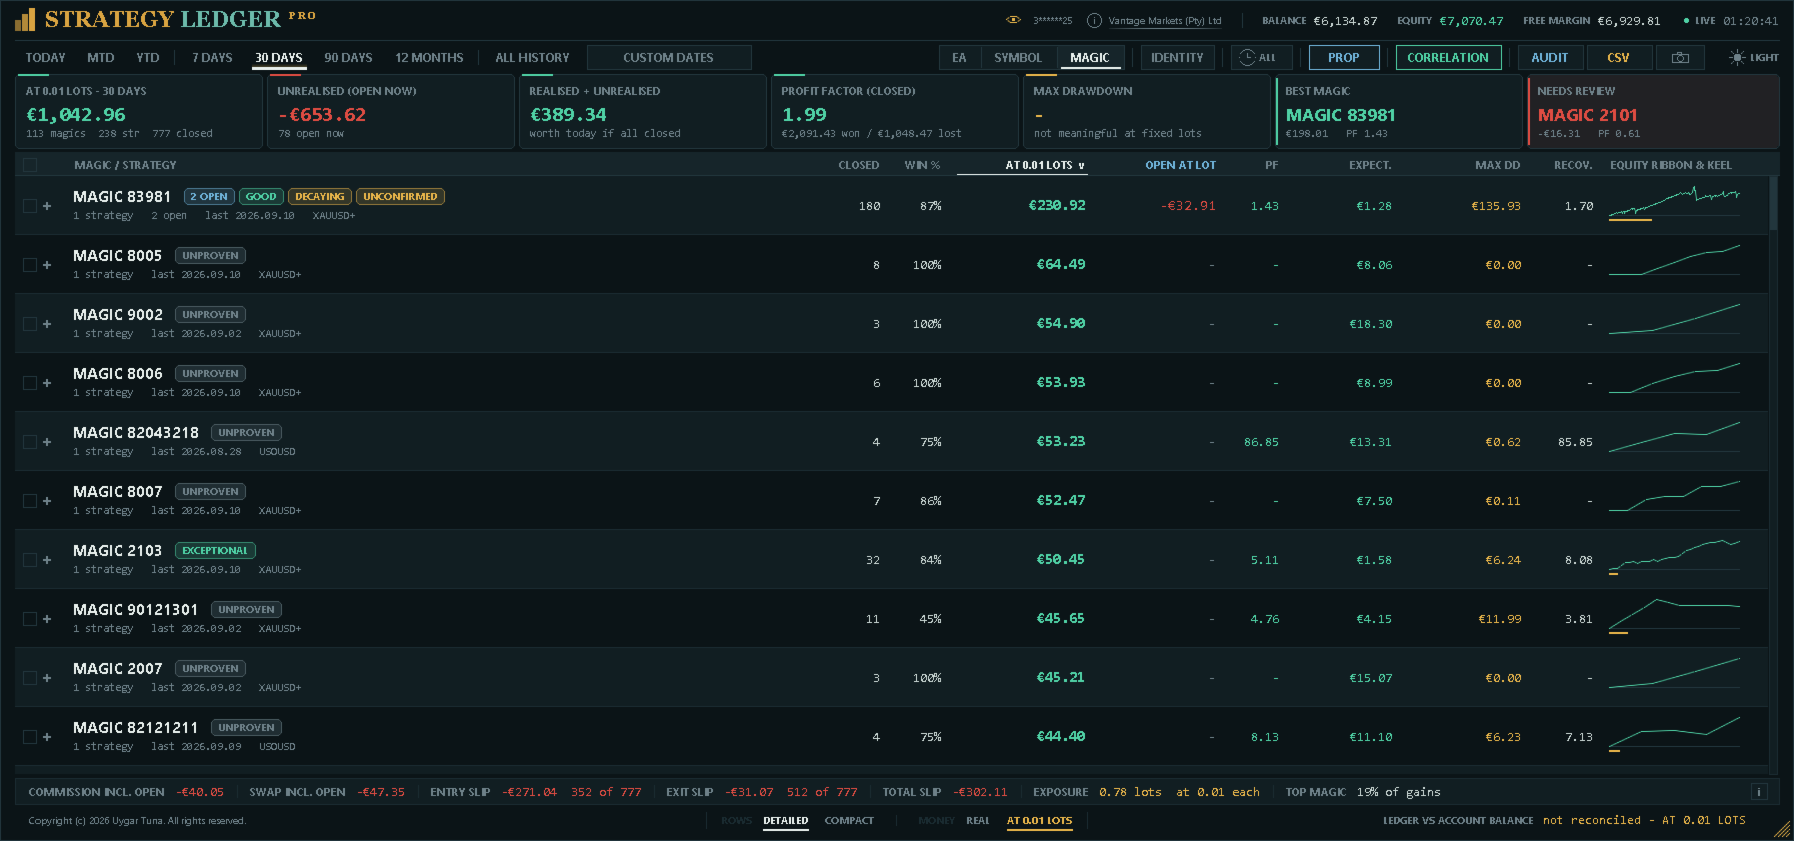
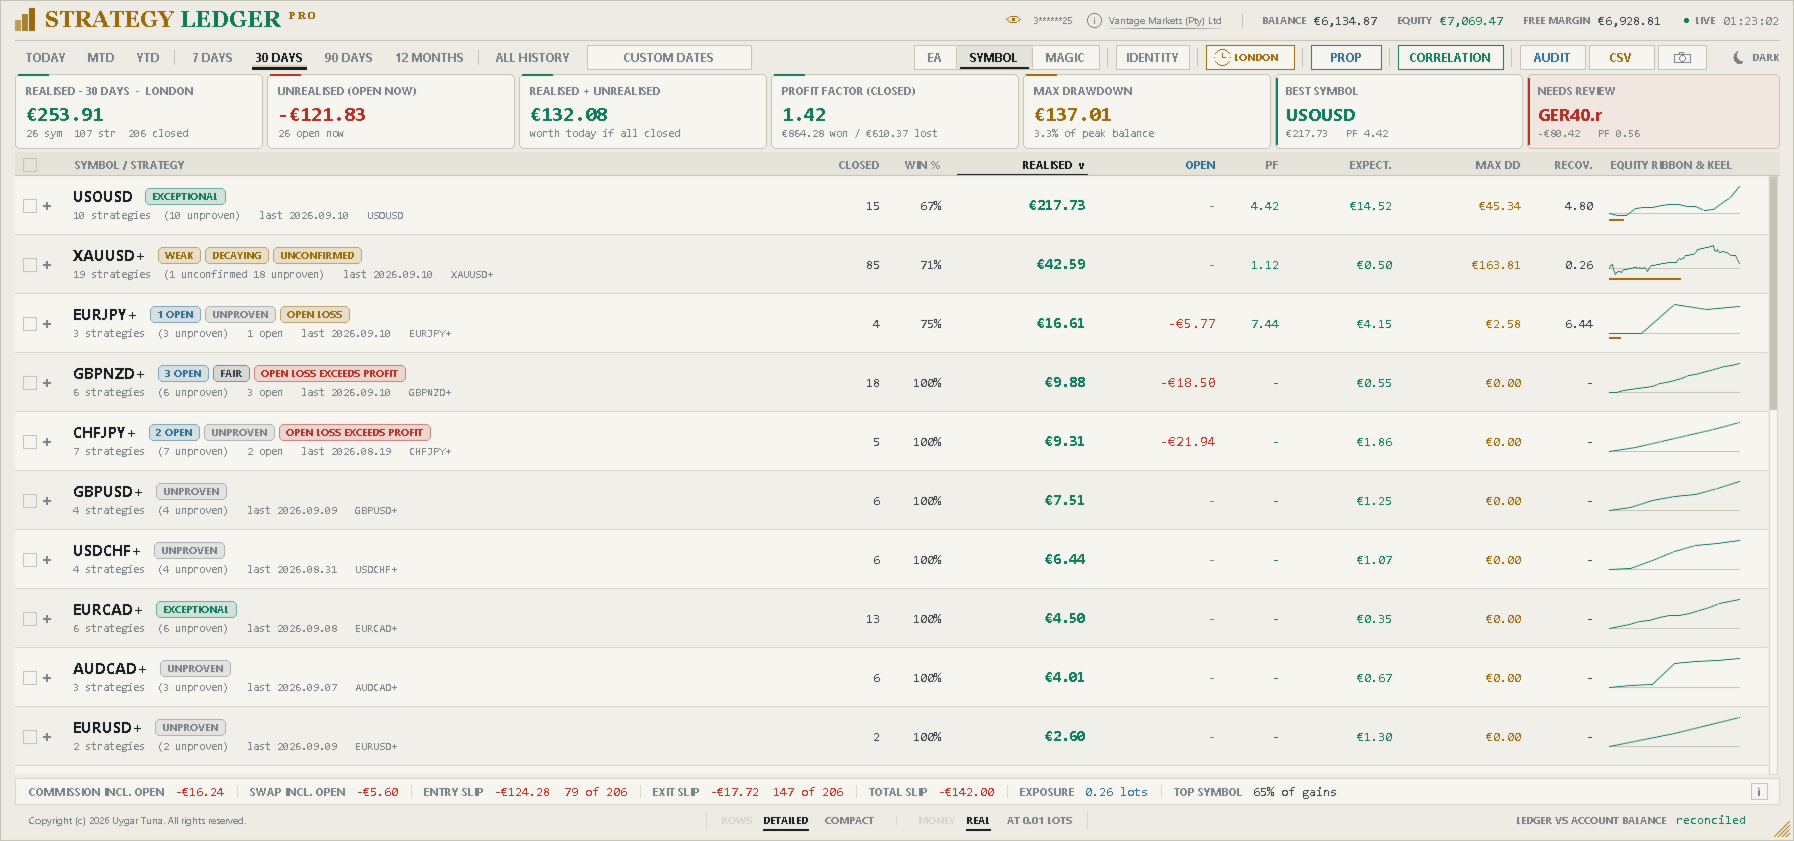














































I’ve been using Strategy Ledger Pro and it’s a really useful tool if you run multiple EAs or strategies on the same MT5 account. It makes it much easier to see what is actually performing well and what isn’t, rather than just looking at the overall account result. I particularly like being able to break things down by strategy, EA and symbol, and the extra stats give a much clearer picture of drawdown and expectancy. It’s also read-only, which I like, because it doesn’t interfere with any trades. Very practical tool and definitely useful for anyone running a portfolio of automated strategies.