Elsna Lines

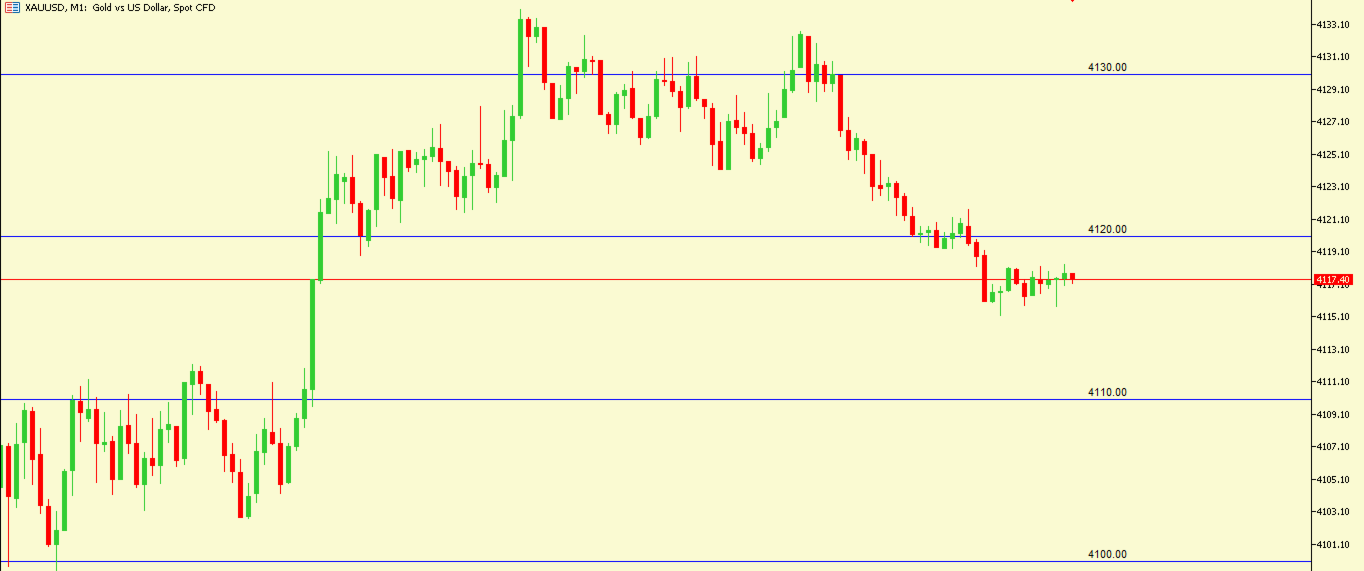
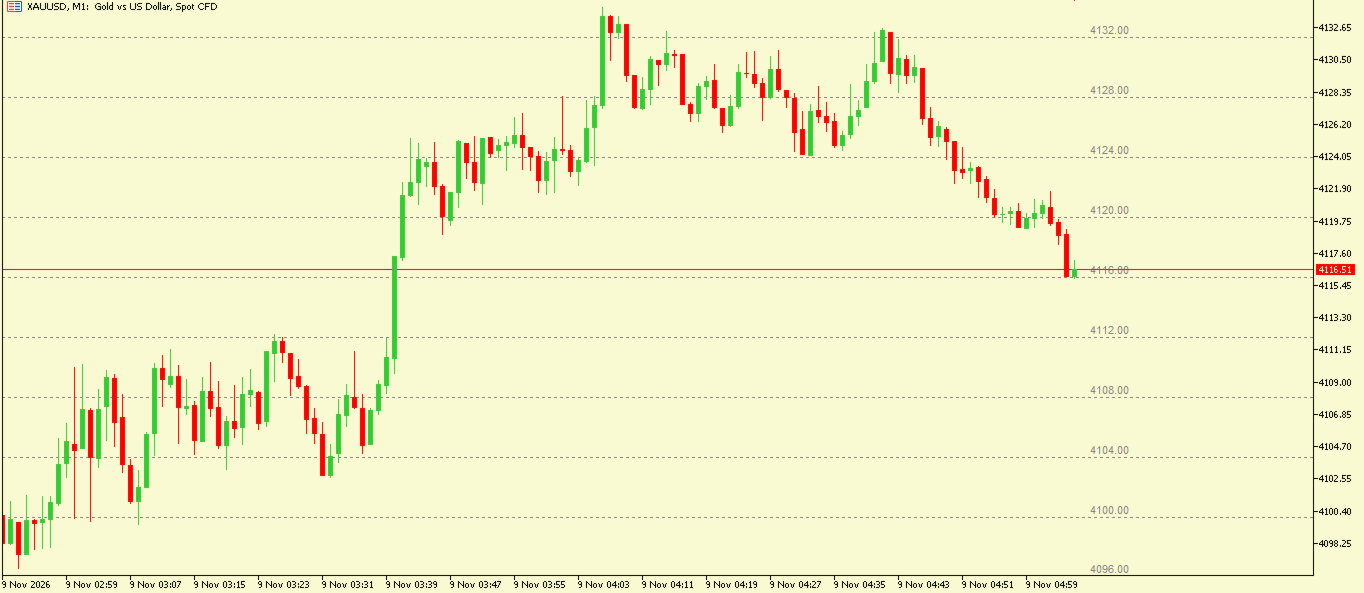
Elsna Horizontal Lines is a chart indicator. It draws a grid of evenly spaced horizontal price levels across your chart, so you can see fixed-distance levels at a glance. It’s useful for grid trading, spotting support and resistance zones, and measuring price moves in pips.

How it works

  • You set the distance between lines in pips, and the indicator draws a line at every step across the visible price range.
  • The pip size adjusts automatically for 3- and 5-digit brokers.
  • The grid begins at a starting price you choose. If you leave it at 0, it starts automatically from just below the visible chart.
  • It draws an extra screen’s worth of lines above and below what you can see, so scrolling a little doesn’t leave gaps.
  • Once drawn, the grid stays put. It only redraws if you change the pips or starting price, scroll far enough to leave the drawn area, delete a line by hand, or (for trend lines) the projection runs out.

Settings

  • StartPrice: the reference price for the first line (0 = automatic).
  • GridStepPips: the distance between lines in pips (default 20).
  • GridColor: the colour of the lines.
  • LineType: full-width horizontal lines, or trend-line segments that run from the oldest bar to a set number of bars into the future.
  • GridStyle: a named dropdown with Solid, Dash, Dot, Dash-Dot and Dash-Dot-Dot (default Dot).
  • GridWidth: the line thickness. It only shows when the style is Solid.
  • ProjectionBars: how far ahead trend-line segments extend.
  • ShowPriceOnLine: true or false. When true, each line gets a small price label next to the latest bar.
  • LabelFontSize and LabelColor: the size and colour of those price labels.

Behaviour

  • The lines are not selectable, so you can’t drag them by accident, and they sit behind the candles.
  • All grid lines and labels are removed when you take the indicator off the chart.
More from author
A full on-chart trade manager UI (not a strategy EA). It gives you a set of floating panels so you can place, manage, and analyze trades without relying only on MetaTrader’s default order ticket and terminal. Main panels Panel Purpose Menu Hub to open/close other panels, switch theme, change font, zoom Market Instant Buy/Sell with lot, SL, TP Pending Place Buy/Sell Limit & Stop orders Orders Manage open positions: close by side, breakeven, trailing, max daily loss Close Close by profit, by loss
FREE
A full on-chart trade manager UI (not a strategy EA). It gives you a set of floating panels so you can place, manage, and analyze trades without relying only on MetaTrader’s default order ticket and terminal. Main panels Panel Purpose Menu Hub to open/close other panels, switch theme, change font, zoom Market Instant Buy/Sell with lot, SL, TP Pending Place Buy/Sell Limit & Stop orders Orders Manage open positions: close by side, breakeven, trailing, max daily loss Close Close by profit, by loss,
FREE
Elsna Ma Cloud
Humu Musah Sakibu
Elsna MA Cloud plots two moving averages on your chart and shades the space between them to show who is winning, the fast MA or the slow one. What you see A fast MA and a slow MA as thin lines, blue and orange. Defaults are 14 and 50 SMA, and the period, method and applied price can be changed for each. A shaded cloud between the two lines. Green when the fast MA is above the slow MA (bullish). Red when the fast MA is below the slow MA (bearish). Color switching at crossovers: the cloud changes
FREE
Elsna MA Cloud plots two moving averages on your chart and shades the space between them to show who is winning, the fast MA or the slow one. What you see A fast MA and a slow MA as thin lines, blue and orange. Defaults are 14 and 50 SMA, and the period, method and applied price can be changed for each. A shaded cloud between the two lines. Green when the fast MA is above the slow MA (bullish). Red when the fast MA is below the slow MA (bearish). Color switching at crossovers: the cloud changes
FREE
Elsna SuperTrend is a standard SuperTrend trend-following indicator, drawn as a line on the main chart. How it works: it takes the midpoint of each bar, (high + low) / 2, and adds and subtracts the ATR (14 periods by default) times a multiplier (3.0 by default). That gives an upper and a lower band. Each band only moves toward price and never away from it, which makes them “ratchet”. What you see: Green line, below price: bullish trend. It follows the lower band and works like a trailing stop. R
FREE
Elsna Lines Mt4
Humu Musah Sakibu
Elsna Horizontal Lines is a chart indicator. It draws a grid of evenly spaced horizontal price levels across your chart, so you can see fixed-distance levels at a glance. It’s useful for grid trading, spotting support and resistance zones, and measuring price moves in pips. How it works You set the distance between lines in pips, and the indicator draws a line at every step across the visible price range. The pip size adjusts automatically for 3- and 5-digit brokers. The grid begins at a startin
FREE
Elsna Supertrend
Humu Musah Sakibu
Elsna SuperTrend is a standard SuperTrend trend-following indicator, drawn as a line on the main chart. How it works: it takes the midpoint of each bar, (high + low) / 2, and adds and subtracts the ATR (14 periods by default) times a multiplier (3.0 by default). That gives an upper and a lower band. Each band only moves toward price and never away from it, which makes them “ratchet”. What you see: Green line, below price: bullish trend. It follows the lower band and works like a trailing stop. R
FREE
Filter:
No reviews
Reply to review