Supply Demand RSJ PRO
- 지표
-
JETINVEST
 Roberto Junqueira, is Trader for over 20 years and has been developing indicators and trading experts for more than 10 years for the Forex, Cryptocurrencies and Stock Exchanges markets.
 - 버전: 1.0
- 활성화: 20
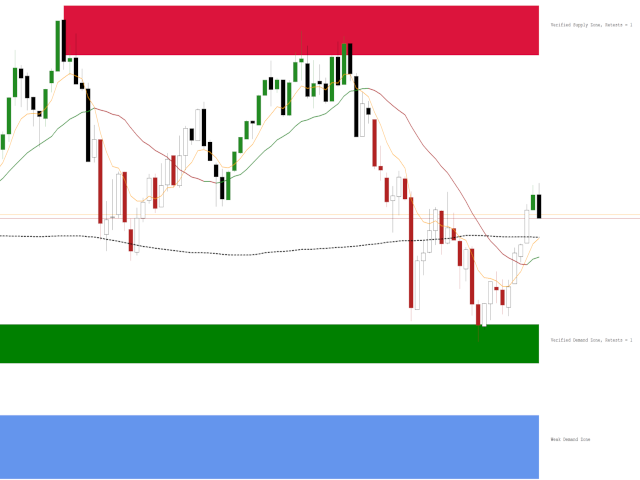
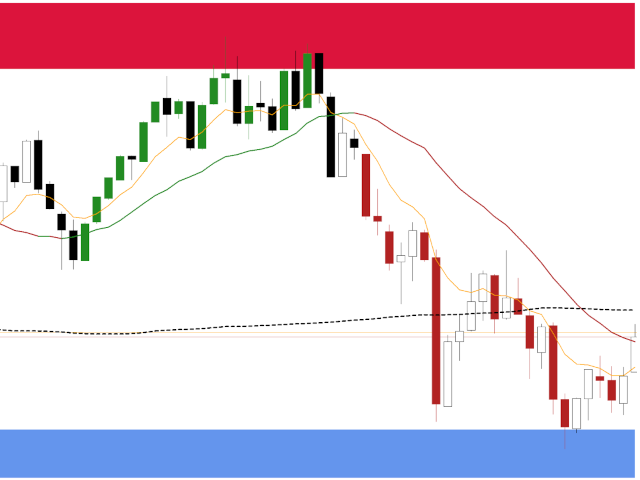
지표 공급 수요 RSJ PRO는 그래프에 "공급" 및 "수요" 영역을 계산하고 표시하여 영역 유형(약함, 강함, 확인됨, 입증됨)을 식별하고 영역을 다시 테스트하는 경우 몇 번인지 보여줍니다. 재시험했다.
"공급" 구역은 수요보다 공급이 더 많이 발생하여 가격을 낮추는 가격 구역입니다.
"수요" 구역은 공급보다 많은 수요가 발생하여 가격을 상승시키는 가격 구역입니다.
구역 분류
- 약함: 다시 테스트할 경우 위반될 가능성이 있는 가격 영역입니다.
- 강함: 추세의 방향을 변경했고 그렇게 빨리 재시험될 가능성이 없는 가격 영역.
- 검증됨: 최대 1~3번의 재테스트가 있었지만 가격이 해당 영역을 깰 수 없는 강한 가격 영역.
- 입증됨: 3회 이상의 재시험이 있었지만 가격이 해당 지역을 돌파하지 못한 강한 가격 영역.
- Broken/Turncoat: 지지의 경우 저항이 되고 지지의 경우 저항이 되는 깨지는 가격 영역입니다.
설정
- 시각적 설정:
- 약한 영역 표시: 약한 영역으로 분류된 영역이 표시됩니다.
- 테스트되지 않은 영역 표시: 테스트되지 않은 영역이 표시됩니다.
- 깨진 영역 표시: 위반된 영역이 표시됩니다.
- 영역 병합: 표시기는 매우 가까운 영역을 더 넓은 영역으로 변환합니다.
- 영역 확장: 표시기는 그려진 영역에 해당하는 이전 제한이 있는지 확인하고 동일하게 확장합니다.
- 계산 설정:
- Num Candles For Analysis: 표시기가 구역을 분류하는 데 사용할 촛불의 수입니다. 500~5000개의 양초가 될 수 있습니다.
- ATR 기간: ATR을 계산하는 데 사용되는 기간
- ATR 계수: ATR 계산에 적용되는 승수
- Fast Fractal Factor: 현재 차트 기간에 적용된 Fast Multiplier
- 느린 프랙탈 요소: 현재 차트 기간에 느린 승수 적용
- 라벨 설정:
- 레이블 표시: 활성화되면 해당하는 경우 영역 유형과 재시험 횟수를 알려주는 텍스트가 영역 옆에 표시됩니다.
- 글꼴 색상: 텍스트의 색상을 설정합니다.
- 글꼴 크기: 글꼴 크기 설정
경고 설정
- 팝업
- 소리(13가지의 소리가 있습니다.)
- 스마트폰 알림
- 팝업 및 사운드
- 팝업 및 스마트폰 알림
- 소리 및 스마트폰 알림
- 팝업, 소리 및 스마트폰 알림
그래도 궁금한 사항이 있으시면 다이렉트 메시지로 연락주세요: https://www.mql5.com/ko/users/robsjunqueira/

사용자가 평가에 대한 코멘트를 남기지 않았습니다