RSI Trend V1
- Indicators
- Version: 5.2
- Updated: 14 March 2025
- Activations: 10

Special price for a limited number of days.
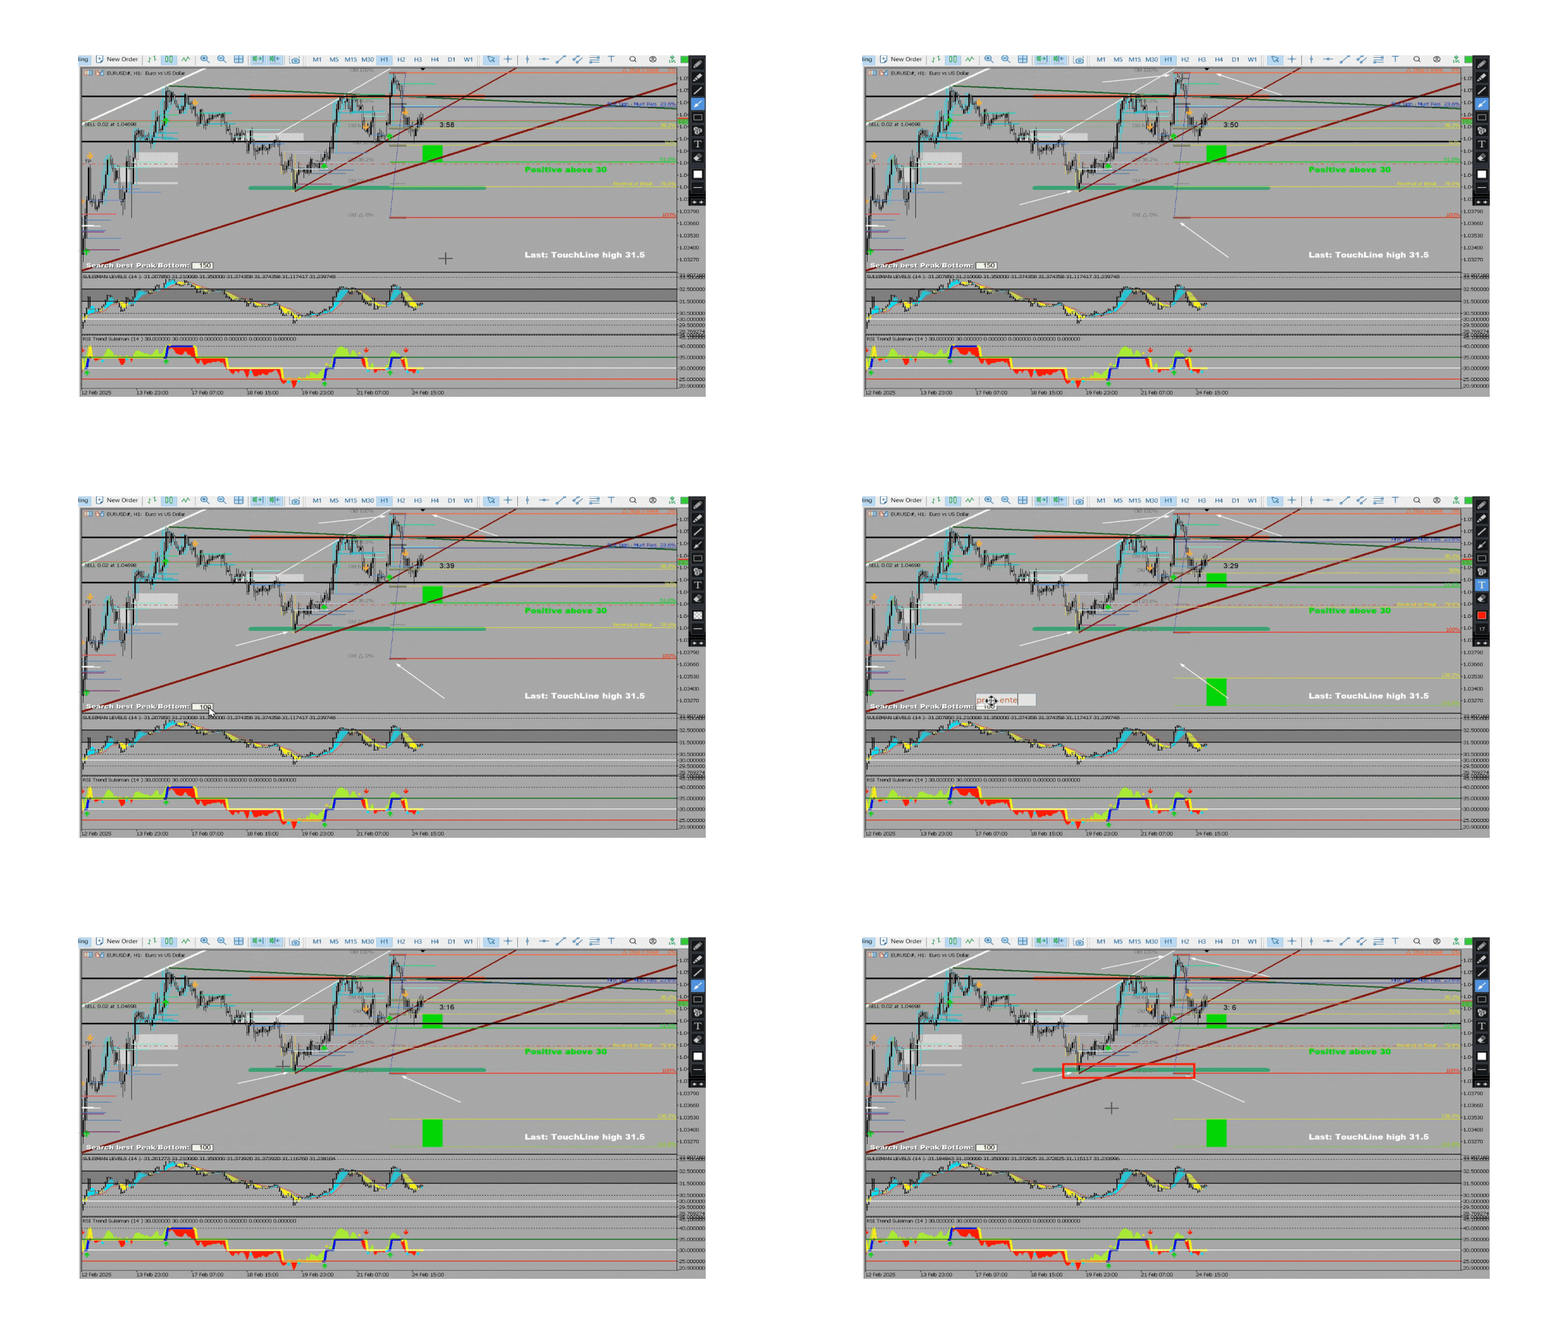
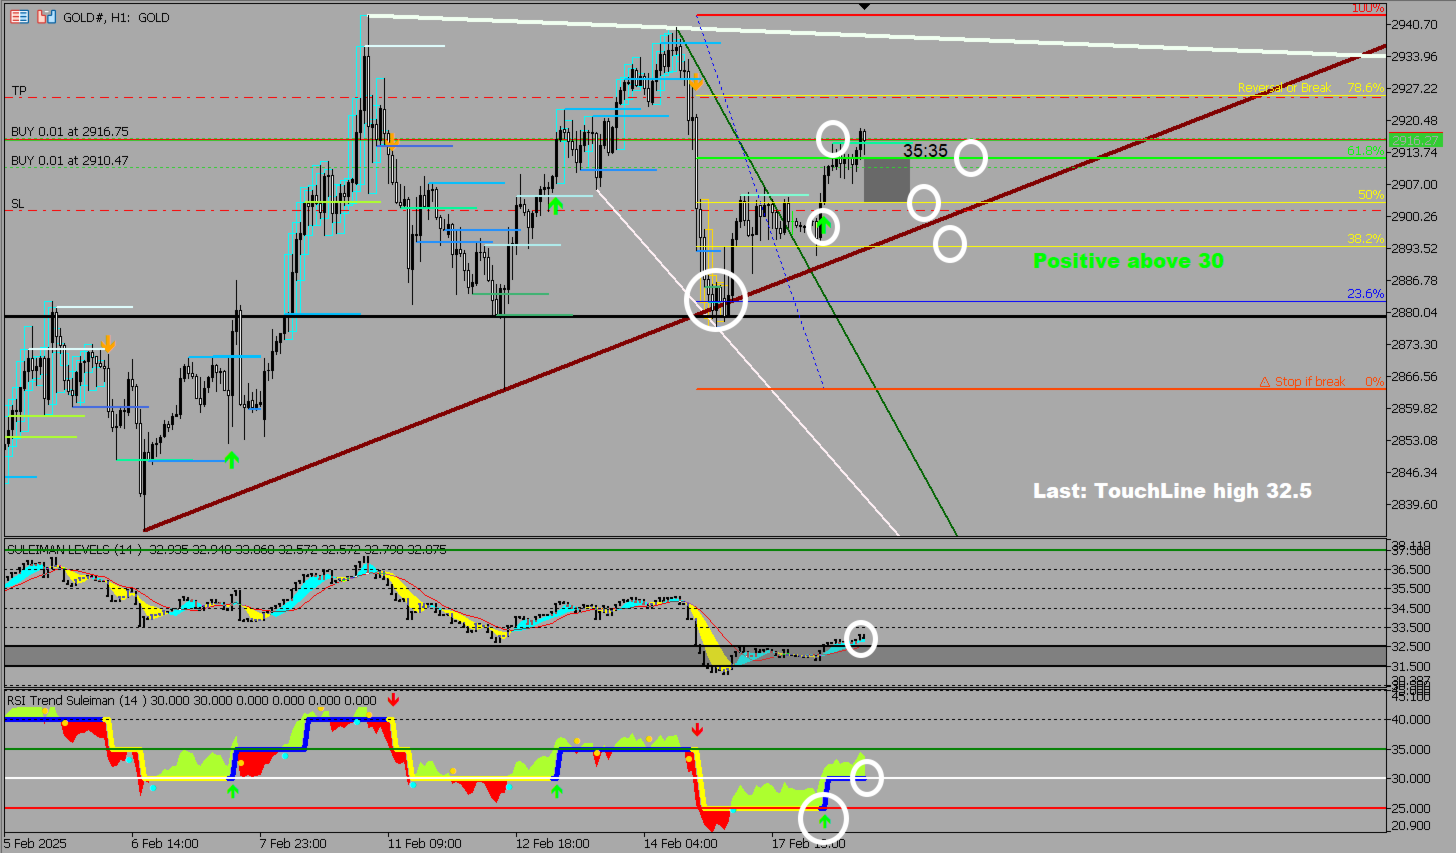
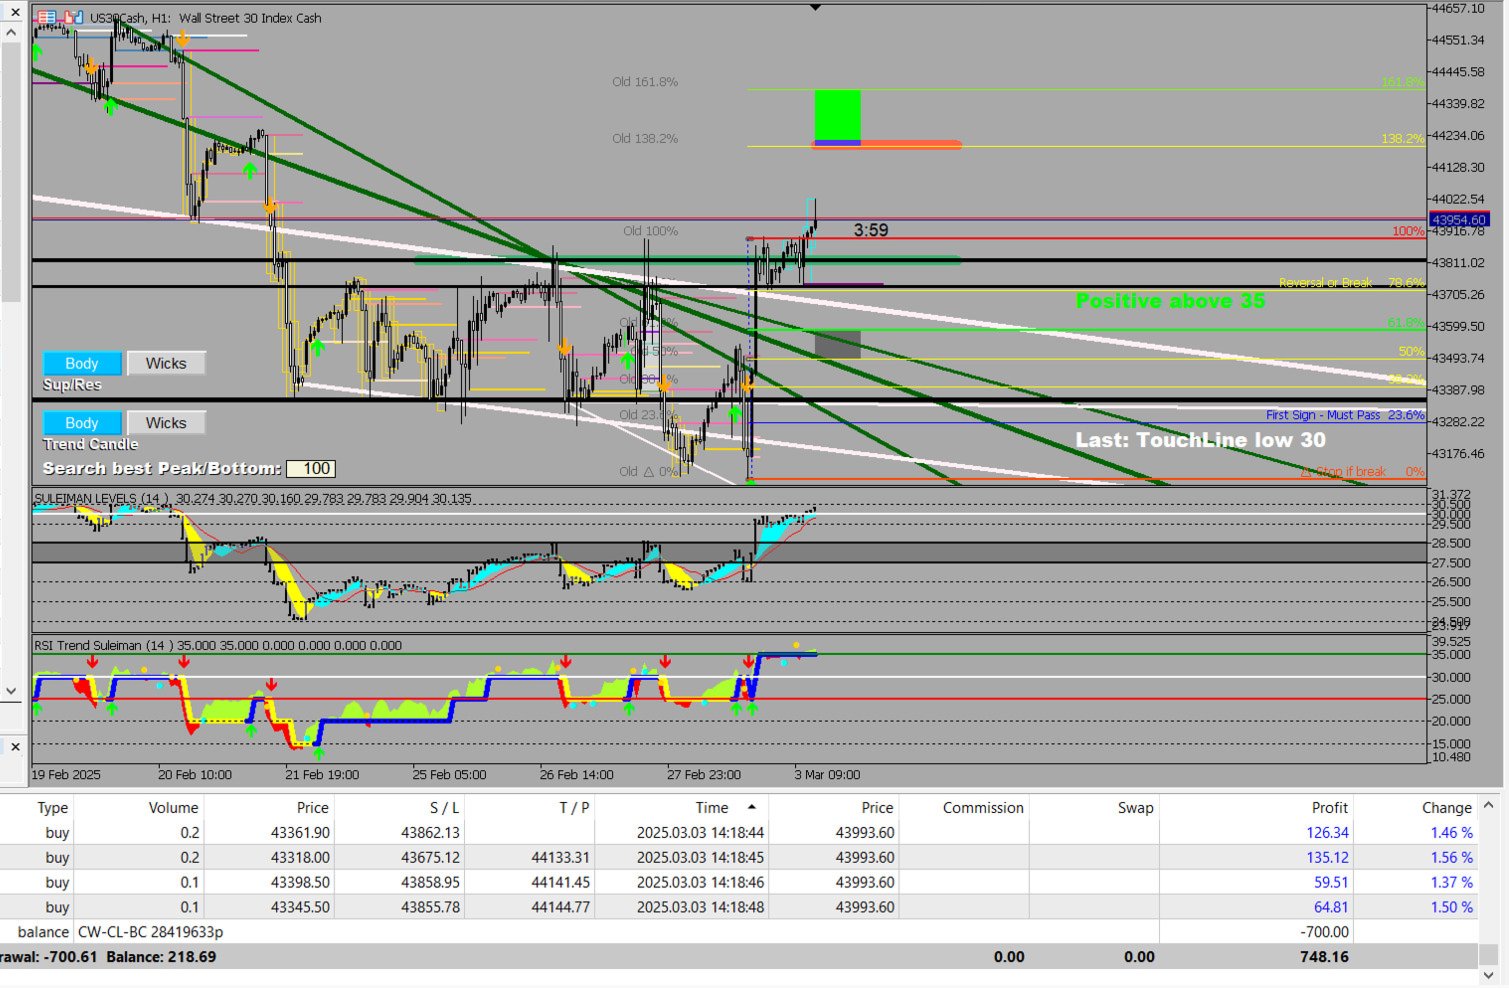
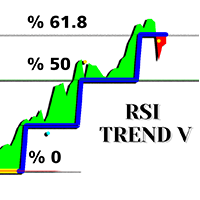
"RSI Trend V" Indicator is designed for trend identification and is integrated with Fibonacci to determine target zones and potential reversals. It includes bullish and bearish arrows that appear in potential price movement reversal areas. However, the key elements to focus on are:
-Thick blue line - Uptrend
-Thick yellow line - Downtrend
-Green cloud above the thick green line
-Red cloud below the thick yellow line
-Bullish and bearish arrows
It is essential to consider the Fibonacci levels that will appear when a new arrow is displayed. Therefore, attention must be paid to the rest of the details, as the movement could be a correction rather than a trend. The previous arrow and its corresponding Fibonacci movement may be the correct one, or the current arrow with its Fibonacci levels may represent the new potential price movement. Hence, it is necessary to focus on the rest of the analysis details and the overall chart.
It is recommended to use the RSI Trend V Indicator alongside the Suleiman Levels Indicator for a broader and more comprehensive chart analysis by considering both clouds, Suleiman Levels, support and resistance lines, and side trendlines.
https://www.mql5.com/en/market/product/128183
I wish everyone success and profitable trading
#NoRepaint #SmartMoney #SupplyAndDemand #OrderBlocks #ForexSignals #RSI #SupportResistance #PriceAction #Breakout #ChartAnalysis #FibonacciLevels