Round Price Levels MT5
- 지표
-
Robert Gerald Wood
 25년 이상 경력의 전문 소프트웨어 개발자, 이제 나만을 위한 도구를 만들고 더 많은 커뮤니티와 공유합니다.
내 제품에 대한 자세한 내용은 https://www.bunnywood.co.uk를 방문하십시오. - 버전: 1.10
- 업데이트됨: 23 2월 2026
- 활성화: 10
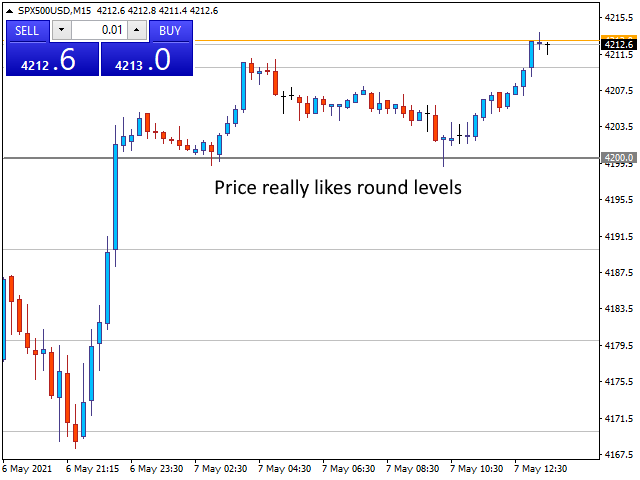
시장은 어림수를 정말 좋아하며 시장이 하락할 때 지지선 역할을 하거나 가격이 상승할 때 저항선 역할을 하는 경우가 많습니다.
이 지표는 라운드 값에서 가격 수준을 그리도록 설계되었습니다. 이 작업은 자동으로 수행되지만 이를 재정의하고 보고 싶은 수준을 결정할 수도 있습니다.
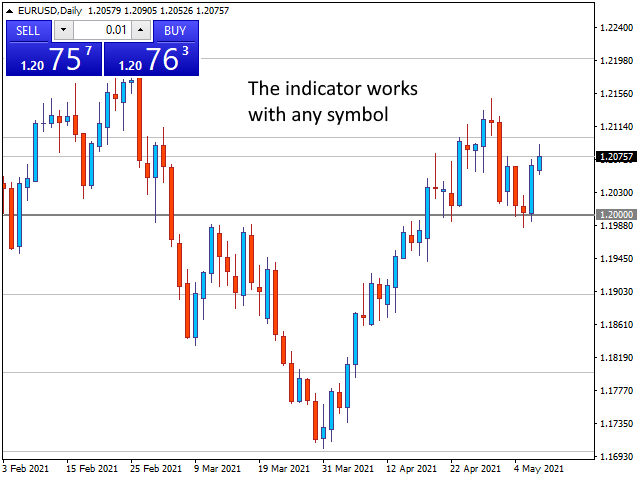
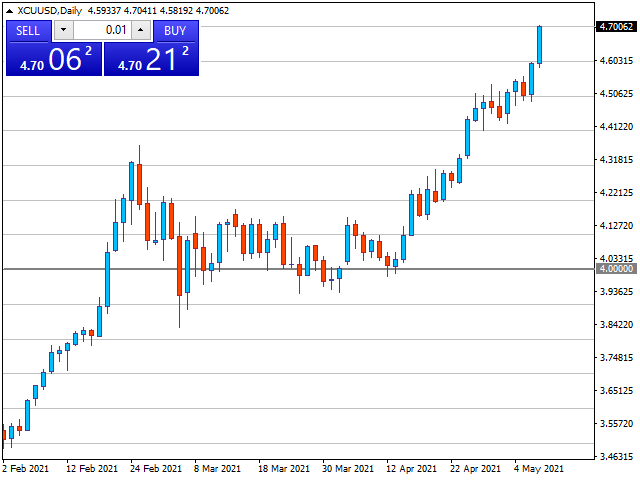
라운드 레벨은 10단계만큼 간단할 수 있으므로 10, 20, 30 등 또는 Forex에서 작업하는 경우 0.1 또는 0.01에서 변경 사항을 보고 싶을 수 있습니다.
표시기는 각각 다른 형식을 사용하여 Major 및 Minor라는 두 클래스의 라인을 그립니다. 이를 통해 레벨의 서로 다른 두 가지 변화 사이의 변화를 동시에 볼 수 있습니다.
알림
이 표시기에는 가격이 구성 가능한 거리 내에 있을 때 메이저, 마이너 또는 두 가격 수준에서 경보를 울리는 기능이 포함됩니다.
자동 설정
기본적으로 지표는 메이저 및 마이너 가격 모두에 대해 적절한 수준을 결정합니다. 언제든지 화면에 표시할 줄 수를 제어하는 구성 가능한 DensityIndex 설정을 사용하여 이를 수행합니다.
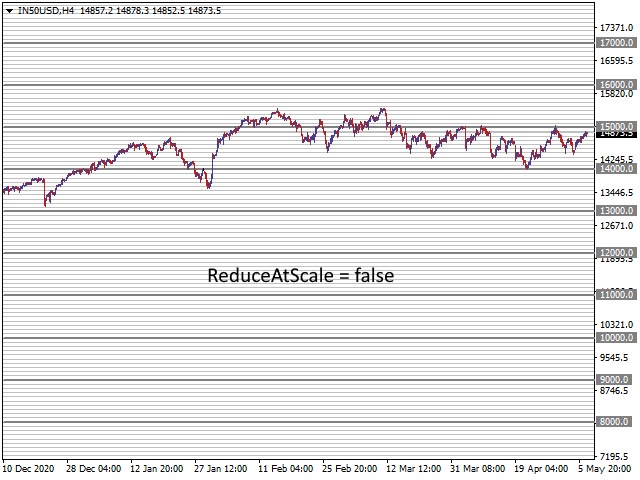
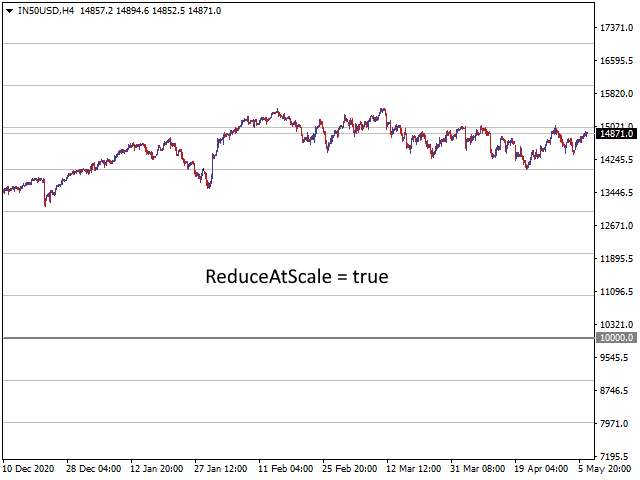
MajorGap 및 MinorGap 설정을 사용하여 자체 스케일링을 설정하는 경우에도 ReduceAtScale 설정을 사용하여 화면에 그려지는 선 수를 제한하는 표시기를 얻을 수 있습니다.
이 기능에 대한 명확한 아이디어는 스크린샷을 참조하십시오.
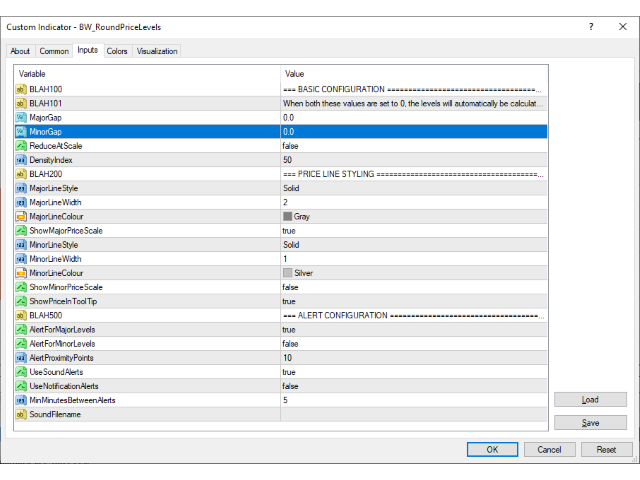
설정
기본 구성
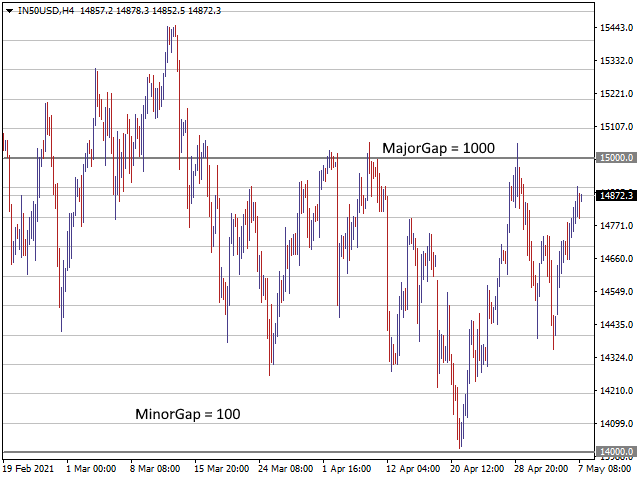
메이저갭
0.0으로 설정하면 표시기가 자동으로 적절한 배율을 계산합니다.
마이너갭
0.0으로 설정하면 표시기가 자동으로 적절한 배율을 계산합니다.
규모 축소
true인 경우 표시기는 차트의 크기를 고려하고 필요한 경우 그려지는 레벨 수를 줄입니다.
밀도 지수
자동으로 축소되기 전의 최대 마이너 값 수입니다.
가격 라인 스타일링
MajorLineStyle
그릴 선 스타일, 실선, 점선, 점선. 시스템 지원 값 목록에서 선택합니다.
MajorLineWidth
그릴 선의 너비입니다. SOLID 이외의 스타일을 사용하려면 이 값이 1이어야 합니다.
MajorLine색상
선을 그릴 색상입니다.
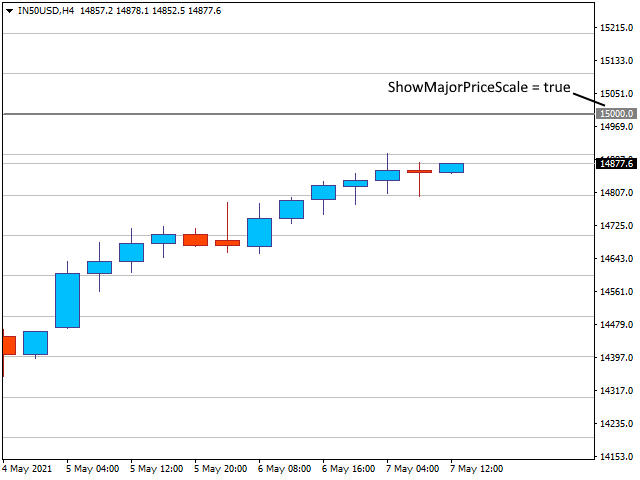
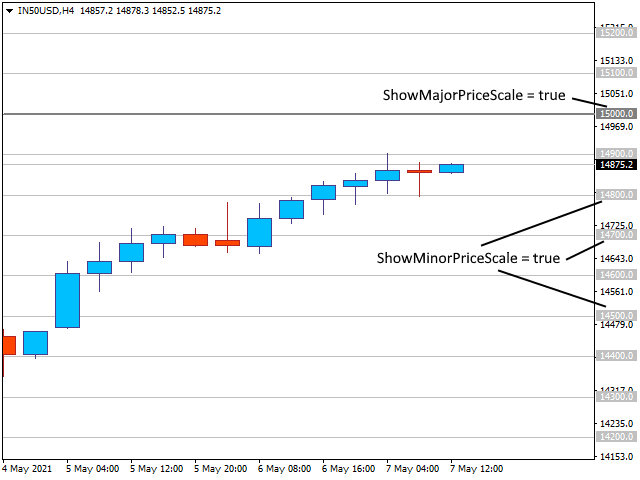
ShowMajorPriceScale
true인 경우 차트 오른쪽의 가격 척도에서 주요 가격 수준이 강조 표시됩니다.
MinorLineStyle
그릴 선 스타일, 실선, 점선, 점선. 시스템 지원 값 목록에서 선택합니다.
MinorLineWidth
그릴 선의 너비입니다. SOLID 이외의 스타일을 사용하려면 이 값이 1이어야 합니다.
마이너라인컬러
선을 그릴 색상입니다.
ShowMinorPriceScale
true인 경우 마이너 가격 수준이 차트 오른쪽의 가격 척도에서 강조 표시됩니다.
ShowPriceInToolTip
true인 경우 라인의 가격 값은 마우스 커서를 위로 가져가면 툴팁으로 표시됩니다. 가격 척도를 껐을 때 유용합니다.
경고 구성
AlertForMajorLevels
true인 경우 주요 가격 수준에 근접한 가격에 대한 경고를 발생시킵니다.
AlertForMinorLevels
true인 경우 Minor 가격 수준에 근접한 가격에 대한 경고를 발생시킵니다.
AlertProximityPoints
현재 가격이 알림을 트리거하는 수준에 얼마나 근접해야 하는지. 현재 가격이 수준의 AlertProximityPoints 포인트 내에 있으면 경고가 발생합니다.
소리 알림 사용
경고가 트리거되면 소리를 냅니다.
알림 알림 사용
경고가 트리거되면 MT4 알림 시스템을 사용하여 알림을 보냅니다. 기본 메뉴 도구 > 옵션을 확인한 다음 알림 탭을 선택하고 거기에서 설정하십시오. Apple 또는 Android 앱도 필요합니다.
MinMinutesBetweenAlerts
경고를 트리거한 후 시스템은 다른 경고가 발생하기 전에 이 시간 동안 기다립니다.
사운드 파일 이름
경고음이 내장되어 있지만 다른 소리를 사용하려면 여기에서 파일 이름을 지정하면 됩니다. 파일은 터미널 MQL/Files 폴더에 있어야 합니다.